Transcription
Kruskal- Wallis Non-Parametric AOV
Non-parametric AOV, as with other non-parametrictests, uses ranked data.The non-parametric form of AOV is called the KruskalWallis test, and the test statistic is:12𝑅𝑅𝑖𝑖2𝐻𝐻 3 𝑁𝑁 1𝑁𝑁(𝑁𝑁 1)𝑛𝑛𝑖𝑖where Ri is the sum of the ranks in category i, and ni isthe number of observations in category i, and N is thepooled observations.
The procedure is simple: Rank the pooled set of N observations.– Rank from lowest to highest, with the lowest rank being 1.– Or the opposite either way will work. Sum the ranks in each category. Plug the numbers into the equation.
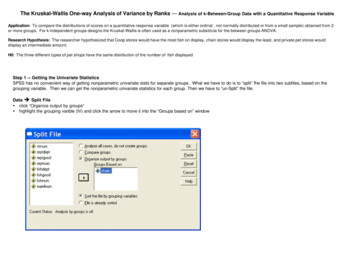
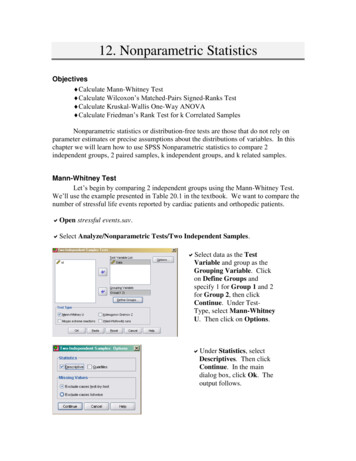
Interest on International Debt, 2007CountryRegion yArgentinaBoliviaBrazilColombiaCosta ayPeruVenezuelaRegion adeshBhutanCambodiaLao PDRMalaysiaNew GuineaPhilippinesThailandVietnamRegion 20SE2.00SE2.99
Ranked Interest on International Debt, 2007CountryRegion Interest075Cameroon ums92CountryArgentinaBoliviaBrazilColombiaCosta ayPeruVenezuelaRegion 21LA29LA26LA310CountryBangladeshBhutanCambodiaLao PDRMalaysiaNew GuineaPhilippinesThailandVietnamRegion Interest0717SE33SE13SE12SE28SE1SE20SE16SE19SE159
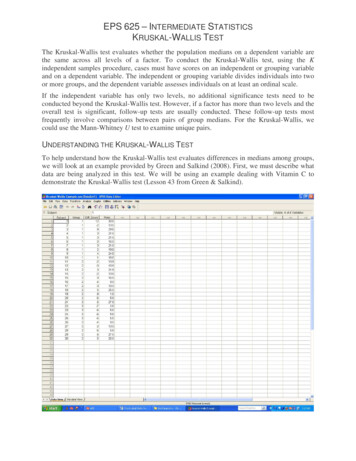
12𝑅𝑅𝑖𝑖2𝐻𝐻 3 𝑁𝑁 1𝑛𝑛𝑖𝑖𝑁𝑁(𝑁𝑁 1)12922 3102 1592𝐻𝐻 33 33 111139𝐻𝐻 0.011 10970.8 102𝐻𝐻 18.68 3 33 1
The Kruskal-Wallis H table is VERY limited in terms of thesample size displayed. It is only really useful for very smallsample sizes.The critical value of H for larger samples sizes or where k 5is approximated by χ2 table with k – 1 degrees of freedom,where k is the number of groups.
Therefore:H 18.68Critical value: χ2critical 5.991Since 18.68 5.991, reject H0.There is a significant difference in interest rates in 2007among the regions (H18.68, p 0.001).
Occasionally we find that we have tied ranks. There aretwo additional procedures that must be performed:1. Give the tied ranks the average rank.2. Apply for following adjustment to H. 𝑡𝑡 3 𝑡𝑡𝑖𝑖𝐶𝐶 1 𝑁𝑁 3 𝑁𝑁where ti is the number of observations tied at a givenrank summed over all sets of ranks.
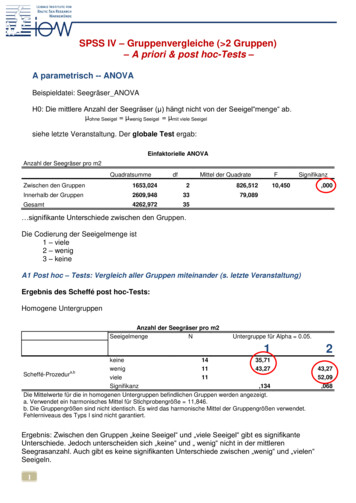
Chilean NitrateProcessing Facilities
Chilean NitrateProcessing FacilitiesNorthMiddleSouth
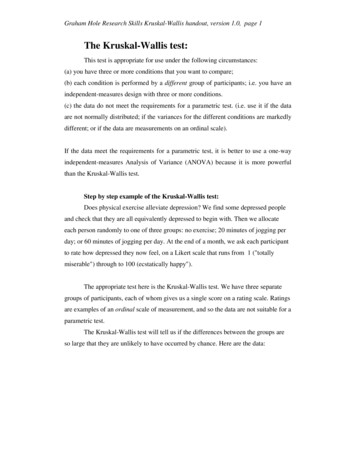
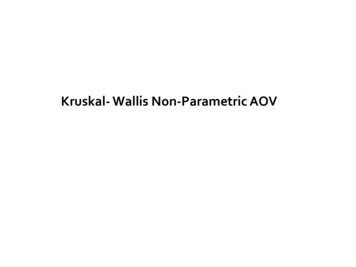
NorthJazpampaLa PatriaPacchaSan PatricioSanta Agua ario de HuaraSan JorgeSanta Rosa de 0001000007000040000SouthBuen RetiroCala CalaHumberstoneMercedesPaposoPena ChicaSan 7500070000
NorthJazpampaLa PatriaPacchaSan PatricioSanta RitaUnionRank SumsRank1915.54.51915.522.596MiddleAgua ario de HuaraSan JorgeSanta Rosa de HuaraSlaviaRank313131311024.58.519SouthRankBuen Retiro11Cala Cala24Humberstone6Mercedes19Paposo22.5Pena Chica19San Donato7Sebastopol8.587These date were ranked from largest production to smallest.117
Rank SumnN 23North966Middle8710South117812962 872 1172𝐻𝐻 24 24 16108𝐻𝐻 0.02 1536 756.9 1711.1𝐻𝐻 0.02 4004 75𝐻𝐻 5.08 75 3 24 1
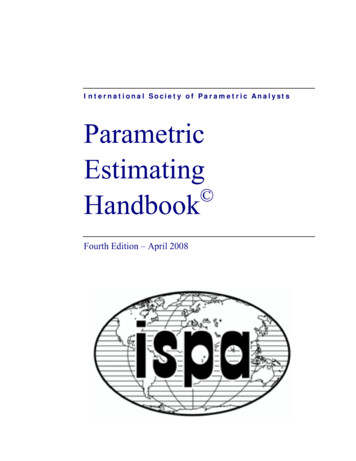
PrimitivaRosario de HuaraAgua SantaPacchaSan JorgeHumberstoneSan DonatoSanta Rosa de HuaraSebastopolPuntuncharaBuen RetiroAmeliaAuroraDemocraciaLa PatriaSanta RitaJazpampaSan PatricioSlaviaMercedesPena ChicaUnionPaposoCala 2.522.524ttttttttttttttttWe have many tied ranks: 4 set of 2 tied ranks (red) 1 set of 3 tied ranks (green) 1 set of 5 tied ranks (blue)
C 1 ( t i3 t i )iN3 N(23 2) (23 2) (23 2) (23 2) (33 3) (53 5)C 1 243 246 6 6 6 24 120C 1 13800168C 1 13800C 0.988So the correction is:5.08H 5.140.988
𝑡𝑡 3 𝑡𝑡𝑖𝑖𝐶𝐶 1 𝑁𝑁 3 𝑁𝑁23 2 23 2 23 2 23 2 33 3 53 5𝐶𝐶 1 243 246 6 6 24 120𝐶𝐶 1 13800168𝐶𝐶 1 13800𝐶𝐶 0.988𝐻𝐻 5.08 5.140.988H value corrected for ties.
Df k – 1 or 3-1 or 2
Thus we get:Critical χ2 value 5.991Since 5.14 5.991, accept H0There is no significant difference in nitrate production amongthe three oficina groups (Kruskal-Wallis χ25.14, 0.10 p 0.05).SPSS confirms our results.
In terms of correcting for ties: Ties in the data make the H value a somewhat less than itshould be, so the correction increases the size of H. Small ties (where 2 observations are tied) do not influencethe results very much unless there are a VERY large numberof them. Situations where there are multiple large ties (where 4 or 5observations are tied) and where few of the ranks are nottied will have an influence on the results.
Thoughts on tied ranks:If your data has a very large number of ties then it lacksvariation.A lack of variation in the data makes it difficult to sayanything meaningful about any differences you may happento find.
The Kruskal-Wallis H table is VERY limited in terms of the . sample size displayed. It is only really useful for very small. sample sizes. The critical value of H for larger samples sizes or where k 5 . is approximated by . χ. 2. table with k – 1 degrees of freedom, where k is the number of groups. Therefore: H 18.68. Critical value: χ. 2 critical 5.991 Since 18.68 5.991, reject H .