Transcription
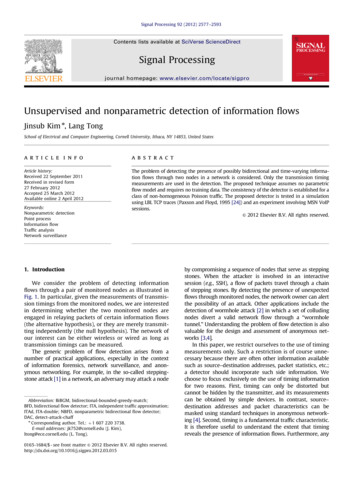
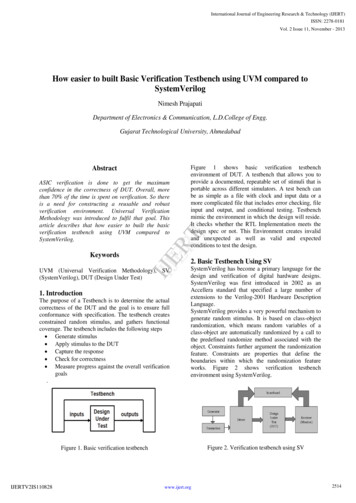
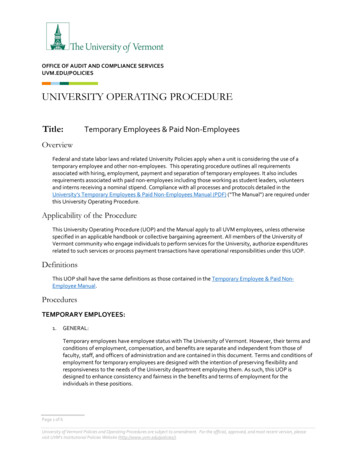
12. Nonparametric StatisticsObjectives Calculate Mann-Whitney Test Calculate Wilcoxon’s Matched-Pairs Signed-Ranks Test Calculate Kruskal-Wallis One-Way ANOVA Calculate Friedman’s Rank Test for k Correlated SamplesNonparametric statistics or distribution-free tests are those that do not rely onparameter estimates or precise assumptions about the distributions of variables. In thischapter we will learn how to use SPSS Nonparametric statistics to compare 2independent groups, 2 paired samples, k independent groups, and k related samples.Mann-Whitney TestLet’s begin by comparing 2 independent groups using the Mann-Whitney Test.We’ll use the example presented in Table 20.1 in the textbook. We want to compare thenumber of stressful life events reported by cardiac patients and orthopedic patients. Open stressful events.sav. Select Analyze/Nonparametric Tests/Two Independent Samples. Select data as the TestVariable and group as theGrouping Variable. Clickon Define Groups andspecify 1 for Group 1 and 2for Group 2, then clickContinue. Under TestType, select Mann-WhitneyU. Then click on Options. Under Statistics, selectDescriptives. Then clickContinue. In the maindialog box, click Ok. Theoutput follows.
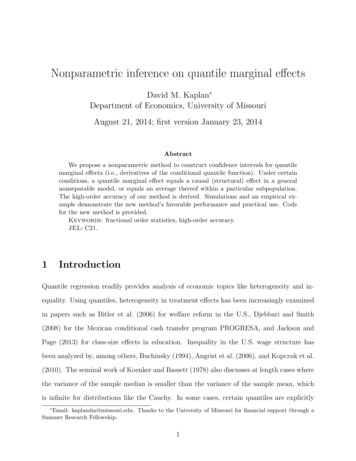
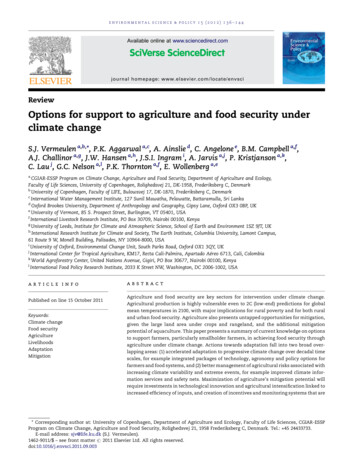
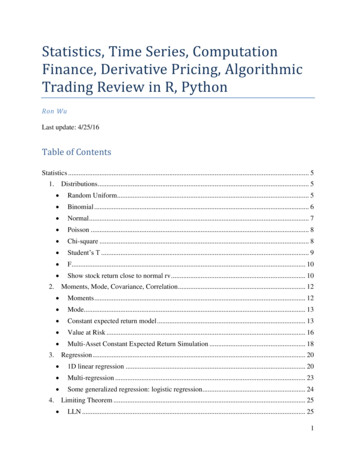
Compare this output to the results in Section 20.1 of the textbook. Specifically,focus on the row labeled Wilcoxon W in the Test Statistics table. As you can see theyare the same. There is not a statistically significant difference in stressful life events forthe 2 groups. But if this is the Mann-Whitney test, why did I tell you to look atWilcoxon’s W? The reason is that I cheated in the text. To avoid talking about twoWilcoxon tests, I called this one the Mann-Whitney (which is basically true) but showedyou how to calculate the Wilcoxon statistic. It honestly doesn’t make any difference.Wilcoxon’s Matched Pairs Signed-Ranks TestNow, let’s compare paired or related data. We will use the example illustrated inSection 20.2 of the textbook. We will compare the volume of the left hippocampus intwin pairs, one of whom is schizophrenic and one of whom is normal. Open Hippocampus Volume.sav. Select Analyze/Nonparametric Tests/2 Related Samples.
Select Normal andSchizophrenic for theTest Pairs List. SelectWilcoxon for Test Type.Then, click Ok. Theoutput follows.The Sum of Ranks column includes the T values. Compare them to the values inthe text. Note that the test statistic in SPSS is z. Regardless, the results are the same.There is a significant difference in hippocampal volume between normals andschizophrenics.
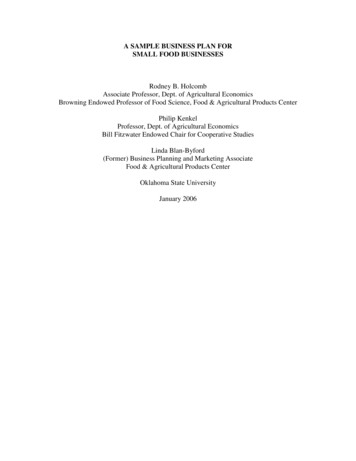
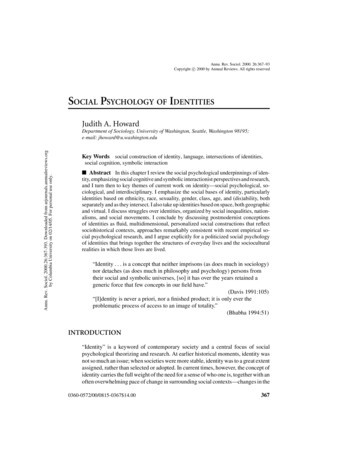
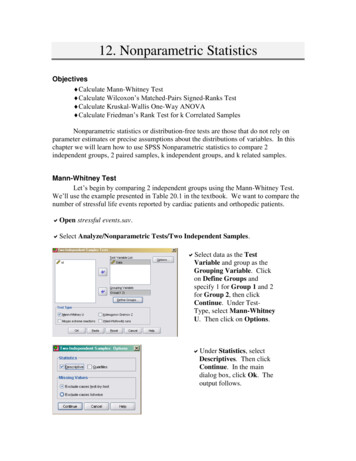
Kruskal-Wallis One-Way ANOVANow let’s compare more than 2 independent groups. We’ll use the exampleillustrated in Table 20.4 of the text, comparing the number of problems solved correctlyin one hour by people who received a depressant, stimulant, or placebo drug. Open problem solving.sav. Select Analyze/Nonparametric Test/ K Independent Samples. Select problem as theTest Variable and groupas the GroupingVariable. Then, click onDefine Range. Indicate 1 for the Minimum and 3 for theMaximum since there are 3 groups, identifiedas 1,2, and 3. Click Continue. Kruskal-Wallis is already selected in the main dialog box, so just click Ok. The outputfollows.Kruskal-Wallis TestRanksPROBLEMGROUP123TotalN78419Mean Rank5.0014.3810.00
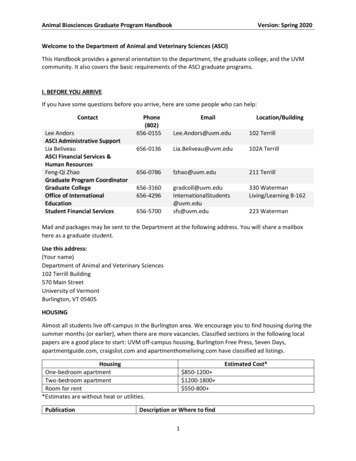
Test Statisticsa,bChi-SquaredfAsy mp. Sig.PROBLEM10.4072.005a. Kruskal Wallis Testb. Grouping Variable: GROUPAs you can see these results agree with those in the text, with minor differences inthe decimal places. This is due to rounding. Both sets of results support the conclusionthat problems solved correctly varied significantly by group.Friedman’s Rank Test for K Related SamplesNow, let’s move on to an example with k related samples. We’ll use the datapresented in Table 20.5 of the textbook as an example. We want to see if reading time iseffected when reading pronouns that do not fit common gender stereotypes. Open pronouns.sav. Select Analyze/Nonparametric Tests/K Related Samples. Select She, He, andThey as the TestVariables.Friedman is thedefault for Test Type,so we can click Ok.The output follows.RanksHESHESHEHENEUTTHEYMean Rank2.002.641.36Test StatisticsaNChi-SquaredfAsy mp. Sig.118.9092.012a. Friedman Test
As you can see, the Chi Square value is in agreement with the one in the text. Wecan conclude that reading times are related to pronoun conditions.In this chapter, you learned to use SPSS to calculate each of the NonparametricStatistics included in the textbook. Complete the following exercises to help you becomefamiliar with each.Exercises1. Using birthweight.sav, use the Mann-Whitney Test to compare the birthweight ofbabies born to mothers who began prenatal care in the third trimester to those whobegan prenatal classes in the first trimester. Compare your results to the resultspresented in Table 20.2 of the textbook. (Note: SPSS chooses to work with thesum of the scores in the larger group (71), and thus n1 and n2 are reversed. Thiswill give you the same z score, with the sign reversed. Notice that z in the outputagrees with z in the text.)2. Using anorexia family therapy.sav (the same example used for the paired t-test inChapter 7 of this manual), compare the subjects’ weight pre and post interventionusing Wilcoxon’s Matched Pairs Signed Ranks Test. What can you conclude?3. Using maternal role adaptation.sav (the same example used for one-wayANOVA in Chapter 8 of this manual), compare maternal role adaptation for the 3groups of mothers using the Kruskal-Wallis ANOVA. What can you conclude?4. Using Eysenck recall repeated.sav (the same example used for RepeatedMeasures ANOVA in Chapter 10 of this manual), examine the effect ofprocessing condition on recall using Friedman’s Test. What can you conclude?
Calculate Kruskal-Wallis One-Way ANOVA Calculate Friedman’s Rank Test for k Correlated Samples Nonparametric statistics or distribution-free tests are those that do not rely on parameter estimates or precise assumptions about the distributions of variables. In this chapter we will learn how to use SPSS Nonparametric statistics to compare 2 independent groups, 2 paired samples, k independent .