Transcription
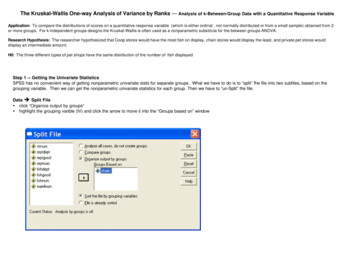
The Kruskal-Wallis One-way Analysis of Variance by Ranks — Analysis of k-Between-Group Data with a Quantitative Response VariableApplication: To compare the distributions of scores on a quantitative response variable (which is either ordinal , not normally distributed or from a small sample) obtained from 2or more groups. For k independent groups designs the Kruskal-Wallis is often used as a nonparametric substitute for the between groups ANOVA.Research Hypothesis: The researcher hypothesized that Coop stores would have the most fish on display, chain stores would display the least, and private pet stores woulddisplay an intermediate amount.H0: The three different types of pet shops have the same distribution of the number of fish displayedStep 1 -- Getting the Univariate StatisticsSPSS has no convenient way of getting nonparametric univariate stats for separate groups. What we have to do is to “split” fhe file into two subfiles, based on thegrouping variable. Then we can get the nonparametric univariate statistics for each group. Then we have to “un-Split” the file.Data è Split FileŸ click “Organize output by groups”Ÿ highlight the grouping varible (IV) and click the arrow to move it into the “Groups based on” window
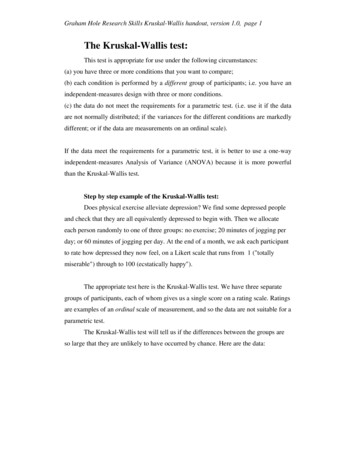
Analyze/Statistics è Summarize è FrequenciesŸ highlight the response variable and click the arrow buttonŸ Click “Statistics” — check ”Quartiles” and “Median”SPSS Output:‘type of store’ ‘chain store’‘type of store’ ‘privately owned’Statisticsa‘number of fish at e of store’ 1.50a. ‘type of store’ ‘chain store’‘number of fish at 017.0017.0024.00a. ‘type of store’ privately owned‘number of fish at store’NValidMissingMedianPercentiles255075a. ‘type of store’ coop4035.0031.2535.0040.25
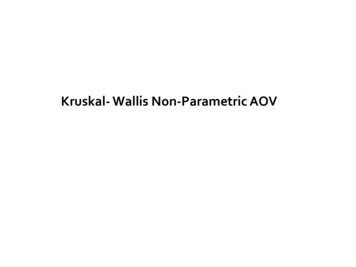
Step 2: Obtain the comparison of the groups.Data è Split FileŸ click “Analyze all cases. Do not create groups.”Analyze/Statistics è Nonparametric Tests è K Indepdent SamplesŸ highlight the quantitative response variable and click the arrow to move itto the “Test Variable List” windowŸ highlight the grouping variable (IV) and click the arrow to move it to the“Grouping Variable” windowŸ clck the “Define Groups” button -- enter the lowest ahd highest value gavethe groups and click “continue”Ÿ be sure the “Kruskal-Wallis H” is checkedOutput:Ranks‘type of store’‘number of fish at store’‘chain store’privately ownedcoopTotalTest Statisticsa,bNChi-Square‘number offish atstore’7.503dfAsymp. Sig.2.023Mean Rank54.2034125.0010.50a. Kruskal Wallis Testb. Grouping Variable: ‘type of store’There is a significant effect. However, sincethere are three groups, we do not know thespecific patternn of that effect until we completepairwise comparisons among those threegroups.
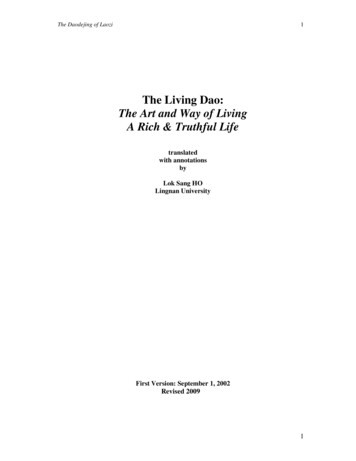
Pairwise follow-up analyses use the Kruskal Wallis to compare each pair ofconditions.Comparing groups 1 and 2 (chain vs. private)Analyze/Statistics è Nonparametric Tests è K Indepdent SamplesŸ highlight “Grouping Variable” windowŸ clck the “Define Groups” button -- change the “3” in the “maximum” window to “2”Test Statistics a,bChi-SquaredfAsymp. Sig.‘number offish atstore’.2021.653a. Kruskal Wallis Testb. Grouping Variable: ‘type of store’Comparing groups 2 and 3 (private vs. coop)Analyze/Statistics è Nonparametric Tests è K Indepdent SamplesŸ highlight “Grouping Variable” windowŸ clck the “Define Groups” button -- enter “2” as the minimum and “3”as the maximumTest StatisticsChi-SquaredfAsymp. Sig.a,b‘number offish atstore’4.5821.032a. Kruskal Wallis Testb. Grouping Variable: ‘type of store’No difference between chain (1) and private (2) stores.There is a difference between private (2) and coop (3) stores.There is a difference between chain (1) and coop (was 3, now is 0)stores.Comparing groups 1 and 3 (chain vs. coop)In order to compare groups 1 & 3, we have to first recode group 3 (coopstores) to have a value of 0. Then ask for a comparison between groups 1 and 0(which is really 3 - coop stores).Data è Select Casesè K Indepdent SamplesŸ click “If condition is satisfied” buttonŸ click the “If” button to open the “Select Cases: If” windowŸ highlight the grouping variable and click the arrow to move it intothe working windowŸ type “ 2” in the window after the name of the grouping variableand press “continue”(this tells the computer to use only caseswith a grouping variable score that is not 2)Analyze/Statistics è Nonparametric Tests è K Indepdent SamplesŸ highlight “Grouping Variable” windowŸ clck the “Define Groups” button -- enter “1” as the minimum and “3”as the maximum (since there is no cases in group “2” this will make acomparison of groups 1 and 3)Test Statisticsa,bChi-SquaredfAsymp. Sig.‘number offish atstore’6.0001.014a. Kruskal Wallis Testb. Grouping Variable: ‘type of store’
Table 1.Quartile values for the number of fish displayed by each of the three types of storesReporting the Results:Store TypeThe number of fish displayed at each type of store is summarized inTable 1. There were significantly different distributions of the number of fishdisplayed among the three types of stores (using Kruskal-Wallis, X² 7.03, p .024). Pairwise comparisons using the Kruskal-Wallis test (p .05) revealedthat, as hypothesized, Coop stores displayed the most fish. However, contrary tothe hypothesis, there was no difference between the number of fish displayed byChain and Private pet stores.ChainNumber ofStoreFish 001st Quartile3rd Quartile12.0021.5017.0022.5031.2540.25
The Kruskal-Wallis One-way Analysis of Variance by Ranks — Analysis of k-Between-Group Data with a Quantitative Response Variable Application: To compare the distributions of scores on a quantitative response variable (which is either ordinal , not normally distributed or from a small sample) obtained from 2 or more groups. For k independent groups designs the Kruskal-Wallis is often used as .