Transcription
Graham Hole Research Skills Kruskal-Wallis handout, version 1.0, page 1The Kruskal-Wallis test:This test is appropriate for use under the following circumstances:(a) you have three or more conditions that you want to compare;(b) each condition is performed by a different group of participants; i.e. you have anindependent-measures design with three or more conditions.(c) the data do not meet the requirements for a parametric test. (i.e. use it if the dataare not normally distributed; if the variances for the different conditions are markedlydifferent; or if the data are measurements on an ordinal scale).If the data meet the requirements for a parametric test, it is better to use a one-wayindependent-measures Analysis of Variance (ANOVA) because it is more powerfulthan the Kruskal-Wallis test.Step by step example of the Kruskal-Wallis test:Does physical exercise alleviate depression? We find some depressed peopleand check that they are all equivalently depressed to begin with. Then we allocateeach person randomly to one of three groups: no exercise; 20 minutes of jogging perday; or 60 minutes of jogging per day. At the end of a month, we ask each participantto rate how depressed they now feel, on a Likert scale that runs from 1 ("totallymiserable") through to 100 (ecstatically happy").The appropriate test here is the Kruskal-Wallis test. We have three separategroups of participants, each of whom gives us a single score on a rating scale. Ratingsare examples of an ordinal scale of measurement, and so the data are not suitable for aparametric test.The Kruskal-Wallis test will tell us if the differences between the groups areso large that they are unlikely to have occurred by chance. Here are the data:
Graham Hole Research Skills Kruskal-Wallis handout, version 1.0, page 2Rating on depression scale:No exerciseJogging forJogging for 6020 294956446562mean rating39.6340.6355.75(SD):(12.85)(14.23)(8.73)Step 1: Rank all of the scores, ignoring which group they belong to. Theprocedure for ranking is as follows: the lowest score gets the lowest rank. If twoor more scores are the same then they are "tied". "Tied" scores get the average ofthe ranks that they would have obtained, had they not been tied. Here's the scoresagain, now with their ranks in brackets:C1 (No exercise)C2 (Jogging forC3 (Jogging for20 minutes)60 minutes)23 (2)22 (1)59 (20)26 (3)27 (4)66 (24)51 (16)39 (9)38 (8)49 (14)29 (5.5)49 (14)58 (19)46 (11)56 (17.5)37 (7)48 (12)60 (21)29 (5.5)49 (14)56 (17.5)44 (10)65 (23)62 (22)mean rank9.569.9418.00(SD)(6.25)(6.84)(5.09)sum of ranks76.579.5144(Tc)
Graham Hole Research Skills Kruskal-Wallis handout, version 1.0, page 3In detail, this is how the ranks are arrived at for these scores.(a) "22" is the lowest score. This gets a rank of 1.(b) "23" is the next lowest score. This gets a rank of 2.(c) "26" is the next lowest score. This gets a rank of 3.(d) "27" is the next lowest score. This gets a rank of 4.(e) There are two instances of "29". This is a "tie". They both get the average ofthe ranks that they would have been allocated, had they been different from eachother. So the next two ranks are 5 and 6. The average of 5 and 6 is 11/2 5.5.Both instances of "29" therefore get a rank of 5.5.(f) "37" is the next lowest score. This gets a rank of 7 (because we've just "usedup" ranks 5 and 6).(g) "38" is the next lowest score, and it gets a rank of 8.(h) "39" is the next lowest score, and it gets a rank of 9.(i) "44" gets a rank of 10, "46" gets a rank of 11, and "48" gets a rank of 12.(j) There are three instances of "49", so this is another tie. They each get theaverage of the next three unused ranks ( (13 14 15) / 3 14).(k) "51" is the next lowest score, and it gets the next "unused" rank, which is 16.(l) There are two instances of "56", so they get the average of the next two unusedranks ( (17 18) /2 17.5).(m) "58" gets the next unused rank, which is 19.(n) "59" gets a rank of 20, "60" gets 21, "62" gets 22, "65" gets 23, and 66 gets 24.This is all tedious, but really not difficult to do once you've practiced it a couple oftimes!Step 2: Find "Tc", the total of the ranks for each group. Just add together all of theranks for each group in turn.Here, Tc1 (the rank total for the "no exercise" group) is 76.5.Tc2 (the rank total for the "20 minutes" group) is 79.5.Tc3 (the rank total for the "60 minutes" group) is 144.
Graham Hole Research Skills Kruskal-Wallis handout, version 1.0, page 4Step 3: Find "H". 12Tc 2 H 3 ( N 1)nc N ( N 1)N is the total number of participants (all groups combined). We have 24participants (3 groups of 8).Tc is the rank total for each group. Tc1 76.5, Tc2 79.5, and Tc3 144.nc is the number of participants in each group. Here, nc1 8, nc2 8 and nc3 8.For our data, 12Tc 2 H 3 (24 1)nc 24 * (24 1) )Tc 2 ncmeans the following:First, take each group's rank total, square it and then divide the result by thenumber of participants in that group.Then, add these numbers together.Tc 2 ncTc 2 nc 76.528 79.528 14428 731.5313 790.0313 2592.0000 4113.5625
Graham Hole Research Skills Kruskal-Wallis handout, version 1.0, page 5 12 H 4113.5625 75 600 H [0.02 4113.5625] 75H [0.02 4113.5625] 75H 7.27Step 4: the degrees of freedom is the number of groups minus one. Here we havethree groups, and so we have 2 d.f.Step 5:Assessing the significance of H depends on the number of participants and thenumber of groups.If you have three groups, with five or fewer participants in each group, then youneed to use the special table for small sample sizes (which is on my website).If you have more than five participants per group, then treat H as Chi-Square. H isstatistically significant if it is equal to or larger than the critical value of ChiSquare for your particular d.f. (The table of Chi-Square values is also on mywebsite).Here, we have eight participants per group, and so we treat H as Chi-Square. H is7.27, with 2 d.f. Here's the relevant part of the Chi-Square table:
Graham Hole Research Skills Kruskal-Wallis handout, version 1.0, page 6Table of critical Chi-Square values:dfp .05p .01p k along the row that corresponds to your number of degrees of freedom.So in this case, we look along the row for 2 d.f.We compare our obtained value of H to each of the critical values in that row ofthe table, starting on the lefthand side and stopping once our value of H is nolonger equal to or larger than the critical value.So here, we start by comparing our H of 7.27 to 5.99. With 2 degrees of freedom,a value of Chi-Square as large as 5.99 is likely to occur by chance only 5 times ina hundred: i.e. it has a p of .05. Our obtained value of 7.27 is even larger thanthis, and so this tells us that our value of H is even less likely to occur by chance.Our H will occur by chance with a probability of less than 0.05.Move on, and compare our H to the next value in the row, 9.21. 9.21 will occurby chance one time in a hundred, i.e. with a p of .01. However, our H of 7.27 isless than 9.21, not bigger than it. This tells us that our value of H is not so largethat it is likely to occur with a probability of 0.01.Conclusion:The likelihood of obtaining a value of H as large as the one we've found,purely by chance, is somewhere between 0.05 and 0.01 - i.e. pretty unlikely, andso we would conclude that there is a difference of some kind between our threegroups.Note that the Kruskal-Wallis test merely tells you that the groups differ insome way: you need to inspect the group means or medians to decide preciselyhow they differ. However in this particular case, the interpretation seems fairlystraightforward: exercise does seem to reduce self-reported ratings of depression,but only in the case of participants who are doing an hour of it. There seems to beno difference between those participants who took 20 minutes of exercise per day,and those who did not exercise at all.
Graham Hole Research Skills Kruskal-Wallis handout, version 1.0, page 7We could write this up as follows:"A Kruskal-Wallis test revealed that there was a significant effect of exercise ondepression levels (H (2) 7.27, p .05). Inspection of the group means suggeststhat compared to the "no exercise" control condition, depression was significantlyreduced by 60 minutes of daily exercise, but not by 20 minutes of exercise". (NB:note that a higher score in this study equates to a higher level of mood and hence alower level of depression).Using SPSS to perform the Kruskal-Wallis test:Step 1:Enter the data into SPSS. This is an independent-measures design, so you needtwo columns. One (labelled "condition" here) tells SPSS which condition eachparticipant was in. I used the codes "1","2" and "3" for "no exercise", "20minutes' jogging" and "60 minutes'jogging" respectively. I then changed to"variable view"and gave the codes"value labels", to make it easier to seewhich condition was which. The secondcolumn("rating")givesthecorresponding scores. Thus, in effect,each row in the spreadsheet correspondsto a single participant - it tells SPSSwhich condition that person was in, andwhat their depression rating was.Step 2:On the top menu, select Analyze, picknonparametric tests. In SPSS version18 (the one I'm using) you then chooselegacydialogs,andindependent samples.finallyk(In earlierversions of SPSS, this sequence simplygoes as follows: Analyze, nonparametric tests, k independent samples.).
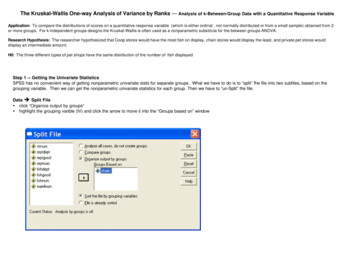
Graham Hole Research Skills Kruskal-Wallis handout, version 1.0, page 8The following dialogue box appears:You move the variable containing your scores ("rating" in this case) into the boxlabelled "test variable list". You move the variable containing the codes that identifythe different conditions ("condition" in this case) into the box labelled "groupingvariable". Then click on "define range" and tell SPSS about the codes for the variousconditions, as follows:
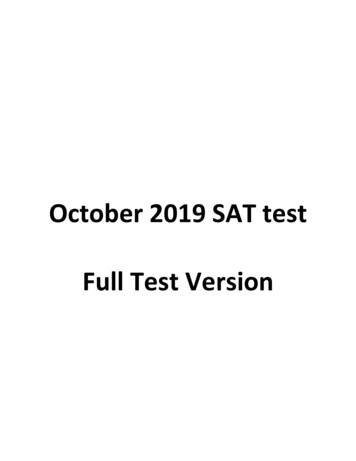
Graham Hole Research Skills Kruskal-Wallis handout, version 1.0, page 9I have three conditions, so the minimum is "1" and the maximum is "3". Thenclick on "continue". Next, click on options and select "descriptive statistics" to get themean for each condition. Finally, click on "OK", to perform the test.Here's what the output looks like:Ranksa,bTest Statisticsdepression rating (1 Nlow, 7 high)ratingdimension 1no exercise89.5620 minutes' jogging89.9460 minutes' jogging818.00TotalratingMean RankChi-square7.290df2Asymp. Sig.026a. Kruskal Wallis Test24b. Grouping Variable:depression rating (1 low,7 high)Descriptive StatisticsNMeanStd. 066.00depression rating (1 low, 7242.0000.834061.003.00 high)The first box tells you what the dependent variable was ("depression rating" inthis case); what the names of the conditions were; "N", the number of participants ineach condition; and the mean rank for each condition (not particularly useful).
Graham Hole Research Skills Kruskal-Wallis handout, version 1.0, page 10The second box gives you the result of the Kruskal-Wallis test as a value ofChi-Square ; how many d.f. are associated with it; and the significance level (an exactp-value, as opposed to the approximate value that we have to use if we do the test byhand and use a table to look up its probability value).The third box gives you the descriptive statistics. Note that SPSS hasunintelligently calculated the mean and standard deviation for both the groupingvariable (condition) and the dependent variable (rating). The descriptive statistics forthe grouping variable should be ignored, as they are quite meaningless.Note that the value of H is not quite the same as the one we worked out byhand: SPSS says it's 7.29, whereas by hand it came to 7.27. By hand, we estimatedthat the probability of obtaining a value of H this large by chance would besomewhere between .05 and .01. SPSS enables us to be a bit more precise, estimatingthe probability to be .026 (.03, if you report it to 2 significant digits).
Using SPSS to perform the Kruskal-Wallis test: Step 1: Enter the data into SPSS. This is an independent-measures design, so you need two columns. One (labelled "condition" here) tells SPSS which condition each participant was in. I used the codes "1", "2" and "3" for "no exercise", "20 minutes' jogging" and "60 minutes' jogging" respectively. I then changed to "variable view" and gave the .File Size: 375KBPage Count: 10