Transcription
Multimedia Systems 7: 184–198 (1999)Multimedia Systemsc Springer-Verlag 1999NeTra: A toolbox for navigating large image databasesWei-Ying Ma1 , B. S. Manjunath212Hewlett-Packard Laboratories, Palo Alto, CA 94304-1126, USA; e-mail: wei@hpl.hp.comElectrical and Computer Engineering, University of California, Santa Barbara, CA 93106-9560, USA; e-mail: manj@ece.ucsb.eduAbstract. We present here an implementation of NeTra, aprototype image retrieval system that uses color, texture,shape and spatial location information in segmented image regions to search and retrieve similar regions from thedatabase. A distinguishing aspect of this system is its incorporation of a robust automated image segmentation algorithm that allows object- or region-based search. Imagesegmentation significantly improves the quality of image retrieval when images contain multiple complex objects. Images are segmented into homogeneous regions at the time ofingest into the database, and image attributes that representeach of these regions are computed. In addition to imagesegmentation, other important components of the system include an efficient color representation, and indexing of color,texture, and shape features for fast search and retrieval. Thisrepresentation allows the user to compose interesting queriessuch as “retrieve all images that contain regions that havethe color of object A, texture of object B, shape of objectC, and lie in the upper of the image”, where the individual objects could be regions belonging to different images.A Java-based web implementation of NeTra is available athttp://vivaldi.ece.ucsb.edu/Netra.Key words: Color – Texture – Shape – Query by spatiallocation – Content-based image retrieval – Image databases– Image segmentation1 IntroductionRapid advances in computers and communication technology is pushing the existing information-processing tools totheir limits. The past few years have seen an overwhelming accumulation of media-rich digital data such as images,video, and audio. The internet is an excellent example of adistributed database containing several millions of images.Other examples of large image databases include satelliteand medical imagery, where often it is hard to describe orannotate the image contents. Even if it is possible for a userCorrespondence to: W.-Y. Mato describe the contents in an unambiguous way, the largeamount of data that need to be processed in applicationssuch as medicine or geographic information systems makesit necessary that robust image analysis tools be developedfor automated image annotation.In this paper, we present NeTra, a toolbox for navigating large image collections. NeTra is implemented on theWorld Wide Web (http://vivaldi.ece.ucsb.edu/Netra) usingthe platform-independent Java language. NeTra uses color,texture, and shape information to organize and search thedatabase. One of the distinguishing aspects of this systemis that it automatically segments and uses localized regioninformation in indexing images in the database. This is incontrast to global image attributes that many of the existingcontent-based retrieval systems use.Several systems have been developed recently to searchthrough image databases using color, texture, and shape attributes. These include QBIC [13], Photobook [19], Virage[3], and VisualSEEk [28]. The initial version of QBIC provided querying of the entire image and manually extractedregions. Its most recent versions have incorporated an automated foreground/background segmentation scheme [2, 11]to improve the retrieval performance. The Photobook sharesmany similar features to QBIC, but utilizes a more sophisticated texture and shape feature representation in additionto image segmentation. Its recent emphasis has focused oninteractive learning to incorporate the user’s feedback to adjust classification and segmentation parameters based on avariety of feature representation models [19]. The Viragesystem [3] uses features such as color, texture, composition,and structure to search images. However, its most recentversion has used several new techniques to include spatialinformation in the image representations. The VisualSEEk[28] proposed a feature back-projection scheme to extractsalient image regions and, therefore, the system is able toprovide joint content-based and spatial search capability.1.1 Use of color, texture, and shape featuresfor image queryUsing color to index and search images dates back to someof the early work by Swain and Ballard [30] on color his-
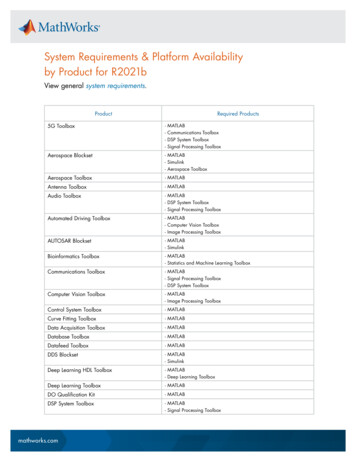
185Fig. 1. Various components in the image retrievalsystem NeTratograms. Since then many variants of the histogram indexinghave been proposed. The basic idea is to reduce the spaceof all possible colors such that the features can be efficientlyorganized for future search. Very often there is a transformation from the traditional RGB color space to some otherspace where the similarities between colors are better preserved while computing the Euclidean distances. Since coloris one visual primitive that humans can easily relate to, it hasreceived considerable attention within the image databasecommunity [4, 10, 22, 26, 31].While texture analysis has a very rich history in imageprocessing and vision, image databases are perhaps the firstlarge-scale applications demonstrating the use of texture. Thetexture search component of the UCSB’s Alexandria DigitalLibrary (ADL) project is a very good example [15, 18, 29].The ADL collections include aerial photographs and satellite imagery besides other geospatially referenced data suchas the Gazetteer. The ADL testbed can be accessed on theweb at http://alexandria.sdc.ucsb.edu and the users can, byvarious means, retrieve spatially referenced data. For the airphotos in the database, the users can also use texture as oneof the attributes. Texture in these pictures has turned out tobe a surprisingly powerful representation, as one can searchand retrieve patterns, such as those consisting of parking lots,orchards, runways, and airplanes by using the correspondingtexture features.Shape is another low-level attribute that can be used torepresent local image information. However, it is not aswidespread as color and texture, as it involves extractionof region/object boundaries, a hard problem by itself. Mostof the current work on using shape is for single simple tosegment objects in the scene [13, 20].Automated image segmentation is clearly a bottleneckfor enhancing the retrieval performance. Although some ofthe existing systems have demonstrated a certain capability in extracting image regions and providing a region-basedsearch [5], the performance of their segmentation algorithmsin terms of processing large and diverse collections of imagedata has not been clearly demonstrated. Lack of robust segmentation algorithms is one of the reasons why shape andother local image features have not been extensively used inimage queries.In contrast, NeTra builds on a robust segmentation algorithm [16]. Figure 1 shows a schematic of NeTra. Thesystem advances the current technology in many ways: (a)it incorporates a very robust image segmentation scheme thatpartitions the image into homogeneous regions. Segmentation enables searching based on regions/objects in the image,as well as facilitating specifying spatial relationships in thequery language. (b) A color representation and indexing forsegmented regions is described that facilitates fast search.(c) Texture and shape attributes, together with spatial information, further help the user to compose queries moreaccurately, improving retrieval performance.The entire system is implemented on the web using theJava programming language. An initial prototype of this system has been implemented in the UCSB ADL project [29],where it is used to search through large collections of aerialimages using image texture [14, 18].1.2 OverviewFigure 1 shows the main components of NeTra. At the timeof data ingest, images are analyzed to extract texture andcolor information. Texture and color are used to partitionthe image into non-overlapping homogeneous segments. Theregion boundaries/shape, together with the region color, texture, and its spatial location, are used in representing theregion within the database. Vector quantization techniques[8] are used to cluster each of the features to create a visualthesaurus [14].One of the outstanding issues in database retrieval is thatof similarity matching in the feature space. While the concept of a visual thesaurus addresses this problem to someextent, interactive learning and iterative query refinement
186are needed to further improve retrieval results. These components are not yet part of the current version of NeTra.For details of the image thesaurus construction and learningsimilarity measures, we refer to our previous work [14, 15,18].The organization of the paper is as follows: the next section (Sect. 2) describes a color feature representation that isquite compact and well suited to represent color in homogeneous regions. An efficient color-indexing scheme which involves only boolean operations is presented. Section 3 brieflyreviews the shape and texture features used in NeTra. Section 4 summarizes a new image segmentation scheme. Section 5 discusses query specification and retrieval and Sect. 6provides experimental results. Section 7 concludes with discussions.2 Color featuresColor histogram is a popular color representation schemethat has been used in many image retrieval applications [13,27, 30]. It works quite well in quantifying global color content in images. Several algorithms have been developed formatching color histograms efficiently. However, within homogeneous regions, the color content is much more sparselydistributed in the color space than the color of the wholeimage. Fewer colors (typically 5–15 per region) can thus beused to represent region color without affecting the perceptual quality. For example, a field of yellow poppy flowers hastypically two dominant colors, yellow and green. The imageitself may contain more than just this flower bed, such as ariver or skyline or other objects, and may require a significantly wider spectrum of colors to adequately represent theglobal content.In NeTra, each image region is represented by a subset of colors from a color codebook. The color codebookitself could be context dependent, and a different codebookcan exist for different applications. From a training datasetof image samples, the codebook is constructed using thegeneralized Lloyd Algorithm (GLA) [8] to vector quantizecolors in the RGB color space. The codebook construction isdiscussed in the Appendix. The codebook in our prototypecontains a total of 256 colors.In order to represent the color within each homogeneousregion, we again use the GLA to cluster the local colors. Oneof the objectives is to represent the region with as few colorsas possible. Starting with one color, the number of clusters isprogressively increased until either of the following stoppingcriteria is met.1. The number of color clusters has reached the maximumnumber of colors allowed (20 in our experiments).2. The mean squared error of the color clustering is belowa pre-defined threshold.Note that the color descriptor can be of varying length,depending upon the color complexity of the homogeneousregion. The resulting number of color clusters in the experiments is in the range 5–15. The color feature is then definedas fc (Ij , Pj ) Ij {1, 2, . . . , 256}, 0 Pj 1 , XPj 1 , and 1 j N , (1)1 j Nwhere Ij is the index into the color codebook C, Pj is thecorresponding percentage, and N is the total number of colors in the region.This color feature representation can be considered as aquantized version of the color histogram. This representation scheme has several advantages. First, it best representsthe original color content in terms of minimizing the meansquare error using a small number of colors. Second, thiscolor feature is very compact. By taking advantage of thefact that human eyes cannot distinguish close colors verywell and that most segmented image regions contain onlya very small set of colors, this method extracts the mostprominent and distinctive colors from the region. It greatlyreduces the amount of feature data for storage and indexing. Furthermore, this representation facilitates queries suchas “Find me all image regions that have 50% red and 30%green.”2.1 A color dissimilarity measureGiven two image regions and , suppose their color featuresare {(Ia , Pa ) 1 a Na } and {(Ib , Pb ) 1 b Nb },respectively, where Na and Nb denote the correspondingnumber of colors in their color features. Now let us firstdefineW (Ia , Ib ) kCIa CIb kq (rIa rIb )2 (gIa gIb )2 (bIa bIb )2 , (2)which is the Euclidean distance between any given two colors from the color codebook C. It can be pre-computed andstored as a table. Now identify the best matched color kfrom the region B which has the minimum distance to thecolor Ia :k arg min1 b Nb W (Ia , Ib ) .(3)Use this to computeD[(Ia , Pa ), B] Pa Pk · W (Ia , Ik ) ,(4)where D[(Ia , Pb ), B] is a distance measure between thegiven color element (Ia , Pa ) and the set of color elements{(Ib , Pb ) 1 b Nb } in region B. D[(Ib , Pb ), A] can becomputed in a similar manner. Thus, for each color in A,the closest color in B is found and the distance is calculated.Using the color percentages as weighting factors, a cumulative distance over all colors in A is calculated. The sameprocess is also performed for each color in B. The distancebetween the regions A and B is then defined as follows:XD[(Ia , Pb ), B]d(A, B) 1 a Na X1 b NbD[(Ib , Pb ), A] .(5)
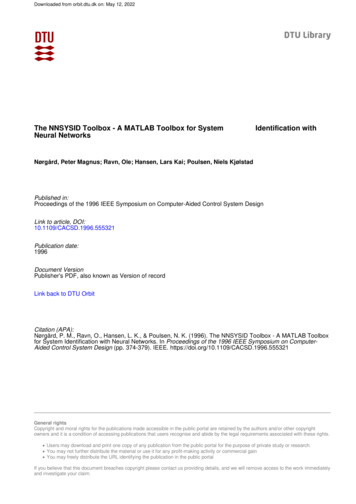
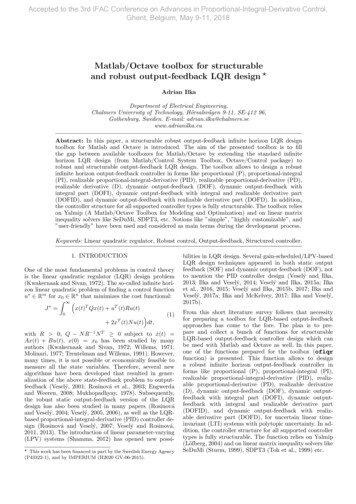
187Fig. 2. An example of efficient color indexing. The table contains256 N elements with 1 representing the existence of color in theregion and 0 for non-existence. The final set of matches is obtainedfrom the intersection (AND operation) of the two candidate listsaccording to the dominant colors of the query imageNote that d(A, B) d(B, A). However, d(.) is not a distancemetric, as the triangular inequality does not hold.2.2 Efficient color indexingWe now describe an efficient search algorithm to identifysimilar colors in the database. Towards this objective, wefirst construct an M N binary color table T (i, j), whereM 256 is the number of colors in the color table and Nis the number of image regions in the database. Figure 2shows an example. T (i, j) 1 if the ith color is present inthe jth region, otherwise it is set to zero. One bit is used torepresent each element in the table.A query object color information is represented using afeature vector similar to the one described in the previoussection. The K color elements in the query color featurevector fq {(Ij(q) , Pj(q) ) 1 j K} are sorted such that thefirst color is the most dominant color (in terms of the percentage of pixels belonging to that color in the region), thesecond index representing the second most dominant colorand so on, i.e., Pa(q) Pb(q) if a b.The search for images with similar colors as the query isthen conducted in two phases. In the first phase, the binarycolor table is used to significantly prune the search space.This is described in greater detail in the following. For thoseimage regions that survive the first phase, the more expensive dissimilarity measure (Eq. 5) is computed.Note that the elements in binary table T (.) indicate eitherthe presence or absence of a color. However, one needs toallow for “similar” colors close to the colors in the queryimage as well for browsing applications. This is done byspecifying a similarity color table S(i, j), where an entryS(i, j) represents the jth most similar color index to thecolor Ci . Consider a color Ci that belongs to the queryimage. A vector A(i) is now constructed asA(i) T (i, 1 : N ) T (S(i, 1), 1 : N ) . . . T (S(i, p), 1 : N ) ,2. Set L&A(Ik(q) ) L where the operator & represents theelement-by-element AND operation.3. Count the number of 1s in L. If it is smaller than a giventhreshold, or if k K, then go to step 4. Otherwise setk 1 k and go to step 2.4. Compute the color distance measure with the image regions whose corresponding index in the vector L is 1.Show the sorted results to the user.Figure 2 shows an example with p 1 and the top twodominant query image colors are used to reduce the searchspace.Because the computations required in color indexing aremostly simple boolean operations such as bit-to-bit ANDand OR, they can be implemented efficiently. Besides, thestorage space required for these tables is very small. Whennew data is entered into the database, one can simply updatethe table by adding a new column vector at the end.3 Shape and texture features3.1 Shape featuresThe shape of objects or of regions of interest is anotherimportant image feature for content-based image retrieval.Over the past few decades many approaches to the characterization of shape and shape similarity have been proposedin the literature. An important class of shape analysis algorithms is based on the representation of the outer boundariesof objects [32]. We have adapted some of the existing wellknown shape representations with some minor modifications.For the sake of completeness, we briefly describe the actualimplementation used in NeTra.3.1.1 Contour representation(6)where means the element-by-element OR operation, and pis the number of similar colors considered. The similarityis determined based on the Euclidean distance in the RGBcolor space. The binary vector A(i) is now used to select asubset of image regions for further search as follows.1. Begin with a 1 N binary vector L [1 1 . . . 1] (withall elements as 1). Set k 1.The contour of a 2D object is considered as a closed sequence of successive boundary pixel coordinates (xs , ys ),where 0 s N 1 and N is the total number of pixels on the boundary. An example of this coordinate chainis shown in Fig. 3. In our experiments, three types of contour representations are derived from these boundary coordinates, which include curvature function, centroid distance,and complex coordinate functions.
188Fig. 3a,b. The object boundary is represented as a discrete coordinate chain.a A segmented flower image. b A small portion of the outer boundary offlowerThe curvature at any point along the contour is definedas the rate of change in tangent direction of a contour, as afunction of arc length. Let us denote the curvature functionas K(s), which can be expressed asdθ(s) ,(7)dswhere θ(s) is the tangent angle function of the contour andis defined as dysdxsẏsand ẋs .(8), ẏs θ(s) atanẋsdsdsK(s) When implementing the above formula in a digital image where the contour is represented as a discrete coordinatechain (as shown in Fig. 3b), we can use the following equation to compute the curvature: ys 1 ys 1 wys ys w atan, (9)K(s) atanxs xs wxs 1 ys 1 wmodels [7, 25] and Fourier descriptors [1, 21, 35] of contourshave been proposed. Recently, an experimental comparisonof shape classification methods based on these two principleshas been carried out in [12], which indicates that Fourierbased methods provide better performance than AR-basedapproaches, especially for noisy images. For this reason, weuse the Fourier-based shape descriptions in our image retrieval system.In order to ensure that the resulting shape features ofall image objects in the database have the same length, theboundary function ((xs , ys ), 0 s N 1) of each objectis re-sampled to M samples before performing the Fouriertransform. In our experiments, we choose M 26 64 sothat the transformation can be conducted efficiently usingFFT.Fourier transform of a contour representation generatesa set of complex coefficients. These coefficients representthe shape of an object in the frequency domain, with lowerfrequency describing the general shape property and higherfrequency denoting the shape details. The shape feature canbe extracted from these transform coefficients. In order toachieve rotation invariance, we only use the amplitude information of the coefficients and discard the phase component.This allows the encoding of the contour to begin at any pointalong the contour. Scale invariance is achieved by dividingthe amplitude of the coefficients by the amplitude of the DCcomponent or the first non-zero frequency coefficient [12].Note that translation invariance is obtained directly from thecontour representation.Three Fourier-based shape feature representations arenow computed. For curvature and centroid distance functions, we only need to consider the positive frequency axes,because these functions are real and, therefore, their Fouriertransforms exhibit symmetry, i.e., F i Fi . The shapefeature for the curvature is*f K [ F1 , F2 , . . . , FM/2 ] ,(12)(11)Z(s) (xs xc ) j(ys yc ) , where j 1. Note that an object-centered coordinatesystem is used here to make the representation translationinvariant.where Fi denotes the ith component of Fourier transformcoefficients. Similarly, The shape feature for the centroiddistance is * FM/2 F1 F2 ,,.,.(13)fR F0 F0 F0 For a complex coordinate function, we use both negativeand positive frequency components. The DC coefficient isdependent on the position of shape and, therefore, is discarded. The first non-zero frequency component is used tonormalize the other transform coefficients. The shape featurefor complex coordinate representation is * FM/2 F (M/2 1) F 1 F2 ,.,,,.,. (14)fZ F1 F1 F1 F1 In the prototype system, any of the three features fromEqs. (12, 13, and 14) can be specified by the user for computing shape similarity. A Euclidean metric is used to computethe distance between two shape feature vectors.3.1.2 Fourier-based shape description3.2 Texture featuresIn the area of shape analysis and classification, several shapefeature representation schemes based on autoregressive (AR)In [17], we presented a texture feature representation schemebased on a Gabor decomposition. A comprehensive evalua-where w 1 is used to reduce the effect of contour noise incomputing the differentiation. Also note that yt yt N andxt xt N , because the boundary representation is a closedchain.The centroid distance function is the second contour representation which will be used in extracting the shape features. It is defined to be the distance of boundary pixels fromthe centroid (xc , yc ) of the object (see Fig. 4):p(10)R(s) (xs xc )2 (ys yc )2 .The third contour representation is the complex coordinate function, which can be obtained by simply representingthe coordinates of the boundary pixels as complex numbers:
189Fig. 4. An example of the centroid distance functionFig. 5a,b. A comparison of the edge flow model with the conventional approach to detecting edges. a Traditional method of edge detection. b Edge flowmodeltion and comparison with other multiresolution texture features using the Brodatz texture database was also provided.The conclusion was that these Gabor features provide excellent pattern retrieval performance. A brief review of thetexture feature extraction from [19] is given below. Firstconsider a prototype Gabor filter: 1 x2 y 21exp h(x, y) 2πσx σy2 σx2 σy2· exp[2πjW x] .(15)A bank of Gabor filters can be generated by dilating androtating the above function:hi,j (x, y) a i h(x0 , y 0 ) , i, j integer0 ix a (x cos θ y sin θ) ,0(16) iy a ( x sin θ y cos θ) ,where θ jπ/K and K is the total number of orientations.The scale factor a i is meant to ensure the equal energyamong different filters. These Gabor filters can be considered as orientation- and scale-tunable edge and line (bar)detectors. The statistics of the detected features can be usedto characterize the underlying texture information. Given animage I(x, y), a Gabor decomposition can be obtained byZOi,j (x, y) I(x, y)h i,j (x x1 , y y1 )dx1 dy1 ,(17)where * indicates the complex conjugate. A simple texturefeature representation can be constructed using the mean andstandard deviation of the amplitude information:Z Z Oi,j (x, y) dxdyµij sZ Z 2 Oi,j (x, y) µij dxdy ,(18)σij ft µ00 σ00 µ01 . . . µ(S 1)(K 1) σ(S 1)(K 1) .(19)Four different scales, S 4, and six orientations, K 6, areused in the following experiments. This results in a featurevector of length 48. The normalized Euclidean distance isused to measure the distance between two texture features.For more details on this representation, we refer the readerto [17].
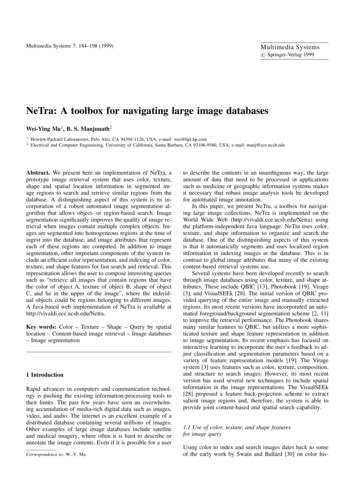
1904 Image segmentation and groupingOne of the distinguishing features of NeTra is the automatedimage segmentation algorithm. Images are segmented andlocal region features are computed and stored at data ingesttime. Segmentation is based on an edge flow model that werecently developed [16]. The basic ideas of the edge flowalgorithm are outlined here and for details we refer to [16].The usefulness of the segmentation scheme lies in thefact that very little parameter tuning is needed. The onlyfree parameters controlling segmentation that the user needsto provide are:1. Image features to be used (gray/color, texture, or both).2. The preferred scale to localize the desired image boundaries.3. The approximate number of image regions for the regionmerging algorithm.Discontinuities in natural images can occur in texture,color, or both. A segmentation algorithm should considerthese different image attributes together in computing a partition of the image. Towards this, a general framework forboundary detection called “edge flow” is proposed in [16].This framework utilizes a predictive coding model to identifyand integrate the direction of change in color, texture, andfiltered phase discontinuities at each image location. Fromthis, an edge flow vector which points to the closest imageboundary is constructed. This edge flow is iteratively propagated to its neighbor if the edge flow of the correspondingneighbor points in a similar direction. The edge flow stopspropagating if the corresponding neighbor has an oppositedirection of edge flow. In this case, the two image locationshave their edge flows pointing at each other indicating thepresence of a boundary between the two pixels. After theflow propagation reaches a stable state, all the local edgeenergies will be accumulated at the nearest image boundaries. The boundary energy is then defined as the sum ofthe flow energies from either side of the boundary. Figure 5provides a comparison of the edge flow model with the conventional approaches to detecting edges using a 1D edge asan example.The edge flow model results in a “dynamic” boundarydetection scheme. The flow direction gives the direction withthe most information change in feature space. Since any ofthe image attributes such as color, texture, or their combination can be used to define the edge flow, this schemeprovides an easy framework for integrating different typesof image information for boundary detection. This wholeprocess including image smoothing, feature extraction, andprediction for identifying the flow direction is designed in away that it can be controlled by a single scale parameter.After boundary detection, disjoint boundaries are connected to form closed contours, thus partitioning the imageinto a number of regions. This is followed by a regionmerging algorithm. Region merging utilizes dissimilarity incolor and texture of the neighboring regions, as well as thelength of the original boundary (before boundary connection) between those regions. One of the stopping criteriafor region merging is the user-provided preferred numberof segments in the image. The user’s preference may not bestrictly enforced if it requires merging two largely dissimilarregions.Figure 6 illustrates the various stages of the image segmentation algorithm. This algorithm has been applied to over2,500 images from a Corel photo gallery. This is one of fewinstances where a segmentation algorithm has been demonstrated to give good results on a wide class of images. Thesystem also provides an optional tool for the user to furthermerge some of the regions if necessary. However, no additional boundaries apart from the ones given by the algorithmare created and the user-assisted region merging can be performed extremely fast. Figure 7 shows some of the imagesegmentation results.A note regarding performance evaluation: Since noground truth is available for the color images, no quantitative performance evaluation can be provided at this time.However, our experiments with some of the synthetic texturemosaics have given results better than most of the algorithmsthat we are currently aware of in the segmentation literature.A visual inspection of the results indicate that the segmentation is of acceptable quality, particularly for applicationssuch as image browsing.5 Query processingSummarizing the discussions so far, a given image is firstsegmented into a number of homogeneous regions. Each region is represented using color, texture, and shape attributesas described in Sects. 2 and 3. For color features. a colorexistence table is generated/updated for fast indexing.The texture and shape features are represented using adata structure similar to the SS-tree [33]. To construct thetree data structure, a modified k-means clustering algorithmis used. The modification is mainly to balance the tree, sothat browsing can be supported efficiently. The balancing ofthe tree is achieved by imposing a constraint on the minimum number of nodes in each cluster. If the clustering inany iteration results in clusters with fewer than the minimum, such clusters are deleted and their members are assigned to other needy clusters. The cluster centers are thenre-computed and used as the initial condition for the nextiteration. The process is repeated until no cluster is smallerthan the specified threshold or if the number of i
Multimedia Systems 7: 184–198 (1999) Multimedia Systems Springer-Verlag 1999c NeTra: A toolbox for navigating large image databases Wei-Ying Ma 1, B. S. Manjunath2 1 Hewlett-Packard Laboratories, Palo Alto, CA 94304-1126, USA; e-mail: wei@hpl.hp.com 2 Electrical and Computer Engineering, University of