Transcription
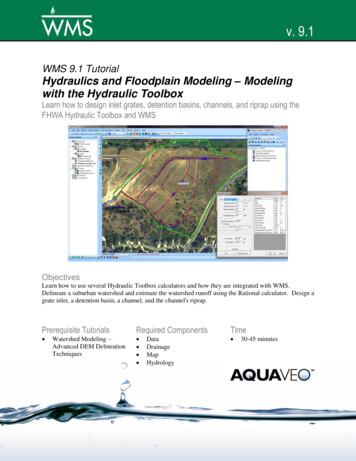
v. 9.1WMS 9.1 TutorialHydraulics and Floodplain Modeling – Modelingwith the Hydraulic ToolboxLearn how to design inlet grates, detention basins, channels, and riprap using theFHWA Hydraulic Toolbox and WMSObjectivesLearn how to use several Hydraulic Toolbox calculators and how they are integrated with WMS.Delineate a suburban watershed and estimate the watershed runoff using the Rational calculator. Design agrate inlet, a detention basin, a channel, and the channel's riprap.Prerequisite Tutorials Watershed Modeling –Advanced DEM DelineationTechniquesRequired Components DataDrainageMapHydrologyPage 1 of 10Time 30-45 minutes Aquaveo 2012
1Contents1234Contents . 2Introduction . 2Objectives . 2Define Drainage Data . 34.1Read Data . 34.2Define Project Coordinate System . 34.3Convert Roadway Drainage Paths to Streams . 44.4Define the Drainage Basin . 45Link Drainage Data with the Hydraulic Toolbox . 55.1Define the Rational Method Computation . 55.2Define the Inlet and Detention Basin Computations . 65.3Define the Channel and Channel Lining Computations . 66Define Hydraulic Toolbox Parameters . 66.1Start the Hydraulic Toolbox and Compute the Rational Method Hydrograph . 66.2Route the Rational Method Hydrograph through the Detention Basin . 76.3Size a Storm Drain Inlet Grate at the Bottom of the Sub-Basin . 86.4Size the Channel and Riprap Downstream of the Detention Basin . 97Create a Report from the Hydraulic Toolbox . 102IntroductionThe US Federal Highway Administration's Hydraulic Toolbox is a MS Windows-basedprogram with a set of calculator tools that can be used for such things as computingchannel properties using Manning's equation and computing a sub-basin's discharge usingthe Rational method. The hydrologic and hydraulic calculations in the hydraulic toolboxhave been integrated with feature objects in the WMS map module. When points, arcs, orpolygons are defined in the WMS map module, hydraulic toolbox calculations can beassigned to these objects and WMS-computed data is passed to the hydraulic toolbox.This tutorial shows you how to delineate a small suburban sub-basin and then how tocompute the sub-basin discharge and design hydraulic structures based on this dischargeusing the hydraulic toolbox calculators. It is recommended that you be familiar withsome of the more advanced watershed modeling techniques in WMS by following theadvanced watershed modeling tutorial before attempting this one.3ObjectivesYour task in this workshop is to design the drainage associated with Tuscany Creek, asmall suburban development. In this exercise, you will learn how to use the WMS link tothe Hydraulic Toolbox to simulate a drainage design in a suburban area. The followingtasks will be demonstrated in this workshop: Delineating a suburban watershed. Estimating the runoff from the watershed using the Rational Method. Designing a grate inlet for conveying street discharges into a storm drain.Page 2 of 10 Aquaveo 2012
WMS Tutorials4Hydraulics and Floodplain Modeling – Modeling with the Hydraulic Toolbox Designing a detention basin to handle the flow from the Rational Methodhydrograph. Designing a channel and its riprap to convey flow from a detention basinto a natural stream.Define Drainage Data4.1Read Data1. Open WMS2. From the File menu, Select Open.3. Locate the HydraulicToolbox folder in your tutorial files. If you have useddefault installation settings in WMS, the tutorial files will be located in\My documents\WMS 9.1\Tutorials\.4. Open RoadDrainage.shp. This is an ArcInfo shapefile containing roadwaydrainage paths in the watershed you are modeling. If a window appearsasking if you want to "keep this current projection, define a new projection,or set your project projection to the coordinate system defined by theprojection file", select Use the projection file and select OK.5. Select File Open again and open tuscanycreek.jpg. This is an image ofthe area under consideration for the Tuscany Creek subdivision.6. Select File Open.7. Browse to the HydraulicToolbox\TuscanyCreekDEM\ 42093886 folder.Open 42093886.hdr. This is a high-resolution DEM with approximately 3meter cell sizes.8. In the Importing NED GRIDFLOAT File dialog, select the OK button toread the DEM.4.2Define Project Coordinate System1. You will see a message that the DEM coordinates are geographic andshould be converted to a planimetric coordinate system for basindelineation. Select Yes to convert the coordinates to a planimetriccoordinate system.2. In the Reproject Object dialog, under Project projection, select Set.3. Select the Global Projection option.4. If the Select Projection dialog does not show up, click on the Set Projectionbutton.5. In the Select Projection dialog set: Projection to UTM Zone to 12 (114 W - 108 W – Northern Hemisphere) Datum to NAD83Page 3 of 10 Aquaveo 2012
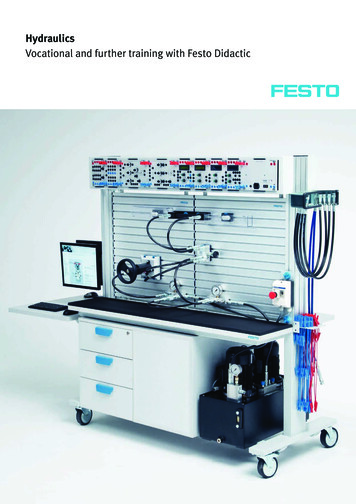
WMS TutorialsHydraulics and Floodplain Modeling – Modeling with the Hydraulic Toolbox Planar Units to Meters6. Select OK.7. Set the Vertical Projection to NAVD 88(US) and Vertical Units to Meters.8. Select OK.displayed.4.3The DEM is read and the contours from the DEM areConvert Roadway Drainage Paths to StreamsSince the drainage in the sub-basin of interest will be modified by the addition of roads,curbs, and other drainage conveyance structures, these drainage paths have been definedusing a shapefile. You need to convert these drainage paths to stream arcs in the mapmodule to use them to delineate the sub-basin.1. Select the RoadDrainage.shp file in the project explorer.2. Select Mapping Shapes - Feature Objects.3. Select Yes to use all shapes in all the visible shapefiles for mapping.4. Select Next.5. Select Next.6. Select Finish.7. Hide the RoadDrainage.shp file by deselecting its check box in the ProjectExplorer.8. Select the Drainage coverage in the Project Explorer.4.4Define the Drainage BasinWith the streams and flow directions defined, you can now compute the flow directionsand accumulations and use the streams to define the drainage basins.1. Choose the Select Feature Point/Node tool.2. Double-click on the node at the downstream end of the detention basinlocation shown in the background image and change Drainage FeaturePoint Type to Drainage outlet. Thisoutlet point defines the terminus ofClick Herethe upper sub-basin. The boundariesfor this upper sub-basin are thesame as the boundaries for thesubdivision you are modeling.Select OK to close the Feature ArcType dialog.3. Switch to the Drainage module.4. Select DEM Compute Flow Direction/Accumulation .5. Select OK.6. Change the Parameter units-Basin Areas to Acres.7. Select OK.Page 4 of 10 Aquaveo 2012
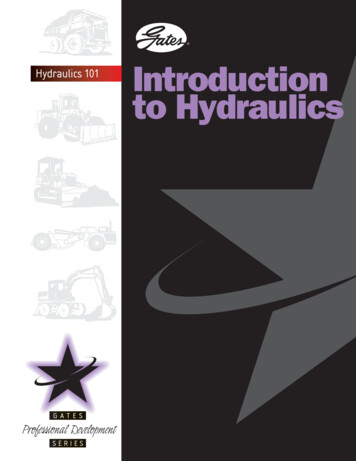
WMS TutorialsHydraulics and Floodplain Modeling – Modeling with the Hydraulic Toolbox8. Select Close once TOPAZ finishes running (you may have to wait a fewseconds to a minute or so). Notice the flow accumulation cells aredisplayed after TOPAZ is finished.9. Right-click on DEM (Converted) in the Project Explorer and select DisplayOptions .10. Change the Minimum Accumulation For Display to 3.0 acres.11. Select OK.12. Switch to the Drainage module13. Select DEM Define Basins14. Select DEM Basins- Polygons15. Select DEM Compute Basin Data16. Select OK17. Right-click on the Drainage coverage in the Project Explorer and selectZoom to LayerNotice that two drainage basins are defined. The smaller sub-basin is the one you areinterested in modeling because it covers the subdivision area. You can ignore the othersub-basin for now.5Link Drainage Data with the Hydraulic ToolboxNow that you have a sub-basin defined, you can associate hydraulic toolboxcomputations with points, arcs, and polygons in the map module.5.1Define the Rational Method Computation1. Select the Drainage coverage inthe Project Explorer.Click Here2. Select the Select Polygon tool.3. Double-click on the sub-basinupstream from the detentionbasin.4. Select Edit Attributes .5. Turn on the toggle box next toRational Method Analysis. Thiswill create a new Rational Method Analysis and assign a default name tothe analysis.6. Change the name of the analysis in the drop-down box to Tuscany CreekBasin and select OK.7. Select OK to close the Drainage Feature Polygon Type dialog.Page 5 of 10 Aquaveo 2012
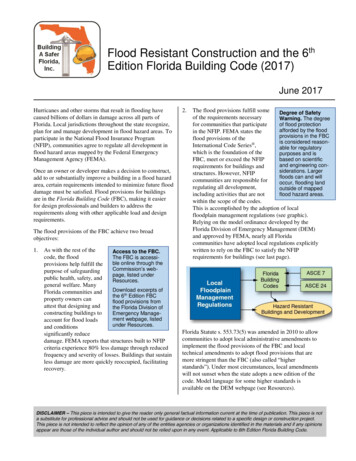
WMS Tutorials5.2Hydraulics and Floodplain Modeling – Modeling with the Hydraulic ToolboxDefine the Inlet and Detention BasinComputations1. ChoosetheSelectPoint/Node tool.Feature1-Click Here2. Double-click on the node at thedownstream end of the detentionbasin location shown in thebackground image and select theEdit Attributes button.3. Turn on the toggle box next to Detention Basin Analysis, change the nameto Tuscany Creek Detention Basin, and select OK.4. Select OK to close the DrainageFeature Point Type dialog.5. Double-click on the node just abovethe detention basin location andselect the Edit Attributes button.2-Click Here6. Turn on the toggle box next to CurbInlet Analysis, change the name toInlet Analysis, and select OK.7. Select OK to close the DrainageFeature Point Type dialog.5.3Define the Channel and Channel Lining Computations1. Choose the Select Feature Arc tool.2. Double-click on the stream arc downstream from the detention basinlocation and select the Edit Attributes button.3. Turn on the Channel Analysis and the Channel Lining Design Analysistoggles. Change the Channel Analysis name to Detention Basin Channeland the Channel Lining Design Analysis to Detention Basin Lining. SelectOK to close the Stream Arc Attributes dialog.4. Select OK to close the Feature Arc Type dialog.6Define Hydraulic Toolbox ParametersWith the locations of the hydraulic toolbox structures defined, you can now start theHydraulic Toolbox from WMS and the structures and their associated geometric data iscopied to the Hydraulic Toolbox.6.1Start the Hydraulic Toolbox and Compute the Rational MethodHydrograph1. Select the Hydraulic Toolbox buttonPage 6 of 10from the WMS Get Data toolbar. Aquaveo 2012
WMS TutorialsHydraulics and Floodplain Modeling – Modeling with the Hydraulic Toolbox2. Double-click on the Tuscany Creek Basin rational method computation.3. Notice that the basin area has been copied from the WMS interface. Youneed to define a runoff coefficient (C) and a rainfall intensity (i). Enter avalue of 0.3 for the runoff coefficient since this is a low-density suburbanarea.4. Select the Compute button under the Compute I-IDF Curves row of thespreadsheet. Select the option to Define User Supplied Data.5. Select the Define Storm Data button.6. Change the Recurrence Interval to 100 years.7. Enter the following data for the 100-year storm (from NOAA Atlas 14) andselect OK:Duration (min)Intensity (in/hr)57.03105.35154.40302.98601.848. Select the 100-year recurrence interval line in the IDF curve table.9. Enter a Specified Tc of 12 minutes.10. Select the Compute Intensity button and then select Done.11. Notice the peak flowrate of 57.0 cfs from the basin. Select the button tocompute a hydrograph.12. Select Rational method hydrograph for the hydrograph computationmethod and select OK.13. The rational method hydrograph appears. Copy/paste the data in thisrational method hydrograph to a spreadsheet or to a text file for future use.Select OK to close the hydrograph and OK to close the Tuscany CreekBasin rational method computation.6.2Route the Rational Method Hydrograph through the Detention Basin1. Double-click on the Tuscany Creek Detention Basin computation.2. Select the Define Storage button.3. Select the Known geometry option to define a detention basin with thefollowing data:Length: 60 ftWidth: 30 ftPage 7 of 10 Aquaveo 2012
WMS TutorialsHydraulics and Floodplain Modeling – Modeling with the Hydraulic ToolboxDepth: 10 ftSide slope: 0.5 ft/ftBase elevation: 0 ft4. Select the OK button.5. Select Define Outflow Discharges 6. Select the Add Weir button and define the following parameters (use thedefault values for all other parameters):Weir Length: 3.0 ftHeight above Base Elevation: 8.0 ft7. Select the Add Outlet button and define the following parameters (use thedefault values for all other parameters):Diameter: 1.0 ftManning's n: 0.013Slope: 0.01 ft/ft8. Select the Add Standpipe button and define the following parameters (usethe default values for all other parameters):Pipe diameter: 1.0 ftHeight above Base Elevation: 2.0 ft9. Select the OK button.10. Select the Define Inflow Hydrograph button. Change the Number of x,ypoints to 25 and copy the hydrograph data from the rational methodcalculation. Select the OK button.11. Select the Route Hydrograph option. Note the peak discharge of 33.82 cfs.Before this detention basin was added, the rational method computed apeak discharge of 57.0 cfs. You can plot the inflow and outflowhydrographs to compare them in the detention basin calculator window ifyou wish.12. Select OK and then OK again to close the detention basin calculator.6.3Size a Storm Drain Inlet Grate at the Bottom of the Sub-Basin1. Double-click on the Inlet Analysis computation.2. Enter the following data for the inlet analysis:Longitudinal slope of road: 0.04 ft/ftCross-slope of pavement: 0.01 ft/ftManning's roughness: 0.015Gutter Width: 2.0 ftDesign flow: 57.0 cfs (from the Rational Method computation)Inlet Location: Inlet in sagPage 8 of 10 Aquaveo 2012
WMS TutorialsHydraulics and Floodplain Modeling – Modeling with the Hydraulic ToolboxPercent clogging: 0.0Inlet Type: GrateGrate Type: P - 1-7/8Grate width: 4.0 ftGrate length: 4.0 ft3. Select the Compute Inlet Data button. Notice the large width of spread atthe sag and the large depth at the center of the grate. To avoid flooding,you should consider subdividing this watershed and add additional inletsand storm drains to better convey water through each sub-basin. We willcontinue with this analysis assuming the computed width of spread anddepth do not cause flooding problems around the inlet.4. Select the OK button to close the Inlet Analysis dialog.6.4Size the Channel and Riprap Downstream of the Detention BasinYou have computed the 100-year peak flow in this subdivision using the rational methodand have modified the peak flow by routing it through a detention basin. In this design,the inlet near the bottom of the subdivision will also provide a degree of routing becauseof the storage provided by the width of spread and the depth above the inlet. This tutorialwill ignore the storage above the inlet in this analysis. You will now design the channeland the channel lining to convey flow to the natural channel downstream of the detentionbasin.1. Double-click on the Detention Basin Channel computation.2. Enter the following data for the channel analysis:Size slope 1 (Z1): 2.0 H:1VSize slope 2 (Z2): 2.0 H:1VChannel width (B): 5.0 ftLongitudinal slope: use the default value computed by WMS (0.072).Manning's roughness: 0.06 (we will install large-diameter riprap encased in agabion mattress-a rock-filled wire container)Enter flow: 33.82 cfs (from the peak detention basin discharge)3. Select the calculate button. Notice that the flow is supercritical (the depthis less than critical depth) because of the steep slope.4. Select OK to close the Detention Basin Channel calculation dialog.You should now design riprap that can be used to control channel erosion.This tutorial uses the Channel Lining Design Analysis Tool to design theriprap, but there is also a Riprap Analysis Tool that can be used in theHydraulic Toolbox. In addition to riprap, you should design a riprap filtermaterial to be placed between the riprap and the original soil. The hydraulictoolbox provides a filter calculation and design tool as a part of the RiprapAnalysis Tool. Design of a filter is not covered in this tutorial, but theinstallation of a filter reduces the failure potential of a riprap installation.Page 9 of 10 Aquaveo 2012
WMS TutorialsHydraulics and Floodplain Modeling – Modeling with the Hydraulic Toolbox5. Double-click on the Detention Basin Lining computation.6. Change the Lining type to Gabion.7. Under the Select Channel row, select Detention Basin Channel as thechannel. Notice that all the parameters entered and computed for thechannel are copied to this calculator.8. Enter a D50 of 0.75 ft.9. Enter a Gabion Mattress Thickness of 1.5 ft.10. Enter a Safety Factor of 1.3.Notice the analysis results at the bottom of the window. The Manning's nvalue has been changed to 0.056 based on the Bathurst equation for computingManning's n. Both the channel bottom and the channel are stable. Since therewill not be any curvature in this channel, you do not need to enter a curvatureradius. Riprap or some sort of erosion control should be installed where thischannel meets the main channel.7Create a Report from the Hydraulic ToolboxFinally, you will create a report containing all the information entered in the hydraulictoolbox calculators. You can choose to create this report in PDF or RTF format,depending on the software available on your computer. The RTF format report can beedited in several word processing programs.1. From the Hydraulic Toolbox, select Calculators Create Report 2. Browse to a folder where you want to save the report and enter TuscanyCreek as the filename.3. In the Report Generator dialog, select all the calculations to be included inthe report.4. Change the file format to PDF or RTF (a Word Pad or MS Word-readableformat), depending on which file format you would like to export.5. Select OK. The report is created and the default viewer brings up yourreport. You can now view and edit this report (if in RTF format).6. Close the hydraulic toolbox. The results are saved and read into WMS.When the WMS project file is saved, the hydraulic toolbox input data andresults are saved and read back into WMS when the WMS project is read.Page 10 of 10 Aquaveo 2012
With the locations of the hydraulic toolbox structures defined, you can now start the Hydraulic Toolbox from WMS and the structures and their associated geometric data is copied to the Hydraulic Toolbox. 6.1 Start the Hydraulic Toolbox and Compute the Rational Method Hydrograph 1. Select the Hydraulic Toolbox button from the WMS Get Data toolbar.