Transcription
WORKPLACESTANDARDSBENCHMARKINGMarch 6, 2012INTRODUCTION. 2TERMINOLOGYMETHODOLOGY & ASSUMPTIONSKEY FINDINGS SUMMARYBENCHMARKING: INDUSTRY SECTORS. 6WORKPLACE TRENDS & CASE STUDIES. 11APPENDIX. A1MASTER DATABENCHMARKING: PER INDUSTRY SECTOR
INTRODUCTIONThe methods in which workplace standards are measuredand benchmarked vary drastically across companies andindustries. For example, the legal industry bases many of itsbenchmarking metrics on the number of attorneys rather thanthe overall personnel headcount at an office location. Similarly,biotechnology and science laboratories relate metrics to thenumber of scientists per office facility.The purpose of this document is to bridge the gap acrossthe various industry benchmarking metrics. By developinga consistent and uniform method for measuring workplacemetrics, we are able to uncover the differences and similaritiesbetween industry benchmarks, understand how workplacestandards and strategies affect space allocation and identifyworkplace trends.In this study, we have collected the workplace standards,space programs, and sample floor plans from 38 differentprojects across eight different industry sectors: Architecture& Engineering (A/E), Biotechnology & Science, Call Centers,Finance, Law Enforcement, Legal, Social Services, andTechnology.Image (Above): Confidential Client, Ryan Gobuty. Small meeting roomImage (Cover): Putnam Investments, Andrew Bordwin. Team roomWhen the workplace revolution started 20 years ago,the office was still shaped by mid-century views ofwork. Today, the office is a reflection of contemporarytrends, a mobile work style most of all.- Fred Bernstein, “Work in Context”March 2012The first portion of this report introduces the researchmethodology, assumptions, common terminology andsummarizes the key takeaways. The second section analyzesworkplace metrics across the different sectors to compareindustry standards and highlight prevailing trends and insights.The final component of the report provides a brief overview offour common workplace trends accompanied with case studyexamples.INDUSTRY SECTORSARCHITECTURE / ENGINEERING (A/E)Includes all architecture, construction,engineering and related services.BIOTECHNOLOGY & SCIENCEBiotechnology, pharmaceutical, and relatedservices. Case study samples represent bothgeneral administrative spaces and somelaboratory functions.CALL CENTERSContact, phone, or call centers focused onproviding customer service.FINANCEFinancial services related to investmentbanking and capital markets. Private wealthmanagement and trading floors are notincluded.LAW ENFORCEMENTPublic sector law enforcement agencies. Doesnot include spaces with detention facilities.LEGALPublic and private sector law firms.SOCIAL SERVICESPublic sector agencies providing health andsocial services.TECHNOLOGYTechnology development companies, bothhardware and software oriented.See the Appendix at the end of this document for more sectorspecific information.Workplace Standards Benchmarking2
TERMINOLOGYThe following is a list of common terminology that will be referencedthroughout this document.CIRCULATIONHOTELINGAll pathways connectingprogrammatic spaces, includingoffices, workstations, supportspaces, entry and elevator lobbies,and egress locations.The practice of providingtemporary seating to employeeson an as-needed basis through aformal reservation system.core, and common building supportspaces. The NSF measures thearea contained within the outlineof each identified program space.Example: the Net Area (NSF) of an8’ x 8’ workstation is 64 NSF.MOBILITY RATIOENCLOSED VS. OPENThe proportion of seats perheadcount assigned to a specificfacility location.An Enclosed workspace generallyrefers to an office or sharedoffice setting in which theworkspace is fully surroundedby full-height partitions. Openrefers to workstations in an openplan environment with minimalpartitions between work settings.DESK-SHARINGThe practice of leveraging individualworkspaces by reducing the totalnumber of seats per assignedheadcount. There are many differentdesk-sharing strategies, such as freeaddress, hoteling, and shared-ownedsettings.FREE-ADDRESSThe practice of providingtemporary seating to employees ona first-come, first-served basis. Freeaddress work settings do not needto be reserved through a formalreservation system.HEADCOUNT (HC)The total number of employees,including full-time, part-time,interns, and contractors, that workat a designated office location.MOBILITY VS. TELEWORKMobility refers to an employee’sability to work freely inside andoutside the office. Mobility alsoencompasses all remote work thatis functionally required for a job.Telework is a sub-set of Mobilityin which an employee worksspecifically at home or at a satellitework location near the employee’shome.NET SQUARE FEET (NSF)The total area of workspaces (officeand workstations), dedicatedsupport (conference, supply, etc.)and shared support (entry lobby,shared floor support, break rooms,etc.). Does not include primaryor secondary circulation, buildingSPACE ALLOCATION RATEThe total usable area of anorganization divided by the totalnumber of personnel (includes allfull-time and part-time employees,interns, and any contractors thatoccupy space. Personnel excludescontractors that service the space,such as janitors and securityguards).SPACE ALLOCATION RATIOProportion of space, measured inNet Square Feet (NSF), dedicated tooffices, workstations, collaborationspace, general support, socialsupport, and mission specific spaces.SPACE TYPESOffices - Includes all individual andshared workspaces that are fullyenclosed.Workstations - Includes all individualand shared workspaces that arenot fully enclosed, such as cubicles,open workstations, and touchdownstations.Collaboration - Incorporates allopen and enclosed collaborationspaces, including training rooms,open meeting areas, focus rooms,huddle rooms/enclaves, and projectrooms.General Support - All common officesupport functions included in theUsable Square Feet (USF). Includesstorage, supply, print and copy,receptions, mail rooms, libraries,lateral files and filing rooms,mother’s/wellness rooms, andserver/ADP rooms.Mission Specific - Specialized roomsto support core business functions,such as laboratories and secureevidence storage.Excluded - Building core, primaryand secondary circulation, and allmajor amenities, such as fitnessfacilities and cafeterias.USABLE SQUARE FEET (USF)*Area of a floor occupiable by atenant area which is where a tenantnormally houses personnel and/orfurniture.UTILIZATION RATEThe average usage of a space,often measured as a percentageof the total period that the spaceis available for use, such as theorganization’s business hours. Thisterm is often misconstrued as“Space Allocation Rate.”Social Support - Includes all breakand recreation areas, such as breakrooms, coffee bars, common areas,informal seating, and game rooms.* Definitions per ANSI/BOMA 265.1 - 1996 Standard Method for Measuring Floor Area in Office BuildingsMarch 2012Workplace Standards Benchmarking3
METHODOLOGY & ASSUMPTIONSDATA SOURCEASSUMPTIONSBENCHMARKING METRICS1) The data source for all casestudy companies and organizationshave been compiled from spaceprograms, test-fits, existing plans,and workplace guidelines.1) To account for the disparatescales of the projects includedwithin this study, we havediscounted all amenity type spacesfrom this report. Amenity spaces,such as full-scale cafeterias andfitness centers, are generally aprovision that is based on the scaleof a project and the site location.The research within this reportis based on the following list ofbenchmarking metrics. In thebody of the report, the metrics areexpressed as industry averages. Forsector-specific information, referto the Appendix at the end of thisdocument.2) To ensure that the findingsgenerated from this reportrepresent the most recenttrends and standards, we haveonly selected projects that werecompleted between 2007 to 2011.3) The data of this report is basedon the metrics from (5) samplecase study organizations perindustry sector, with the exceptionof the Social Services industrysector, which included only (3)sample case studies.March 20122) Our Usable Square Feet (USF)calculations include any sharedspaces that would normallybe included in a tenant’s USFcalculations at a pro-rata share.This includes such spaces as sharedsupport areas, conference centers,training rooms, and other sharedfacilities that might not be directlywithin the immediate office area.Space Allocation Rate: USF per totalpersonnel - Total Usable SquareFeet (USF) of the office spacedivided by the amount of totalpersonnel working in the office,including full-time, part-time,contractors, interns and othertemporary staff. Personnel excludessupport staff that service thebuilding and do not have a primaryworkspace.Space Allocation Ratio- Proportionof office space allocated for thefollowing classifications: offices,workstations, collaboration, generalsupport, social support, and missionspecific spaces. The space allocationcalculations, measured in NetSquare Feet (NSF), also incorporateany shared spaces that qualifyunder the listed classifications ata pro-rata share. Building core,primary and secondary circulation,and any major amenity spaces areexcluded from this metric.Enclosed to Open Ratio - Proportionof individual work settings that areenclosed (i.e. offices) versus open(i.e. cubicles and workstations).Office Sizes- Average office standardsizes measured in Net Square Feet(NSF). All companies that do nothave offices are voided from thismetric.Workstation Sizes- Predominantworkstation standard size measuredin Net Square Feet (NSF). If thereis not a prevailing workstationstandard size, an average iscalculated based on the differentworkstation standards.Workplace Standards Benchmarking4
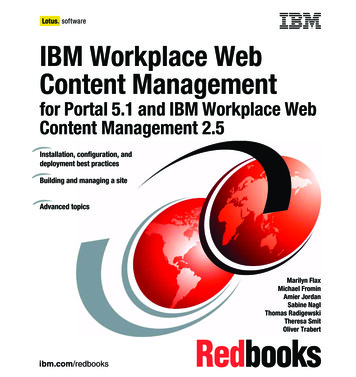
KEY FINDINGS SUMMARYThe analysis of the standards and workplaceallocation of eight industry sector case studies hasrevealed several universal and sector-specific insights.The following key findings briefly summarize fourprominent takeaways from the benchmarkingexercise. For more sector-specific details, refer to theAppendix at the conclusion of this report.KEY FINDING #1Workstation sizes and the ratio of enclosed offices to open workstationshave the strongest correlation to space allocation rate efficiency. We haveconsistently found that the companies with smaller workstation standards andlower ratios of offices to workstations have the lowest space allocation rates.KEY FINDING #2More “We” space and less “Me” space. There is a correlation between theproportion of space that is dedicated to individually assigned spaces andImage 1: Belkin, Nicholas Cope. Informal Collaboration Hubspaces for collaboration. Companies and organizations in the Technology,Image 2: Belkin, Nicholas Cope. WorkstationLaw Enforcement, and A/E sectors are reducing the amount of spaces forImage 3: Deloitte, Timothy Soar. Touch-down Stationindividuals in exchange for more spaces that promote employee interaction andImage 4: Confidential Company. Mobility Stationcollaboration.KEY FINDING #3SUMMARY BENCHMARKING AVERAGESTOTALPUBLICPRIVATE1922011891 : 1.091 : 1.231 : 1.01Enclosed to Open Ratio1:41:41:4Office Size142151136Workstation Size536149Space Allocation RateMobility Ratio*Of all the case studies included in this report, Public Sector organizationshave higher space standards than Private Sector companies in terms ofaverage space allocation rate, office size, and workstation size. However, PublicSector organizations have explored higher levels of mobility. Public Sectororganizations average 1 seat per every 1.23 personnel compared to the PrivateSector average of 1 seat per every 1.01 personnel.KEY FINDING #4The case studies with workplace mobility programs have an estimatedaverage space allocation rate savings of 35 USF per person. The average spacesavings is estimated by dividing the total USF by number of seats versus headcountassigned to a site. Organizations are leveraging underutilized workstations and/oroffices to increase workspace utilization, reduce real estate waste, and create moreenergetic office environments.* Ratio of total number of seats to total headcount assigned to a site.March 2012Workplace Standards Benchmarking5
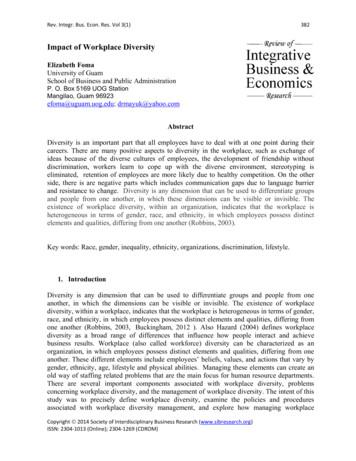
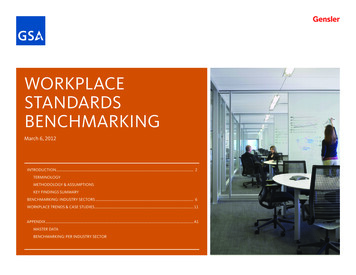
BENCHMARKING: INDUSTRY SECTORSThis chart illustrates the averagespace allocation rate for eachindustry sector based on USF pertotal personnel.SPACE ALLOCATION RATE: USF PER TOTAL PERSONNELIndustry Sector50100150200250300350400450500103.2Call Center140.0TechnologyLegendMobility ProgramPrivate SectorPublic Sector168.0Finance###AverageRange168.4Arch & EngineeringKEY TAKEAWAY #1The Call Center sector has the lowest average spaceallocation rate at 101 USF per person. The Legal Sectorhas the highest average at 335 USF per person.199.6Law Enforcement207.3Social ServicesKEY TAKEAWAY #2The Biotech & Science and Legal sectors display thegreatest range in space allocation rates. The A/E,Technology, and Social Services sectors display the mostconsistent space allocation rates.219.6Biotech & Science335.0LegalMarch 2012Workplace Standards Benchmarking6
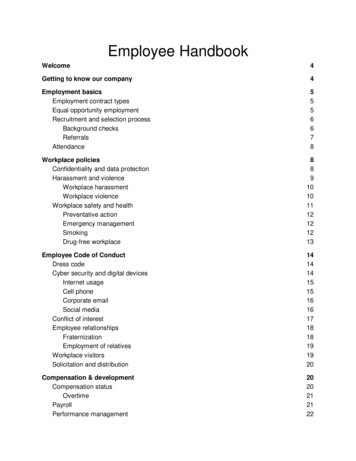
BENCHMARKING: INDUSTRY SECTORSThe bar graphs below demonstrate the average proportion of NSF thatis allocated to each space type per industry sector. Industry sectors areordered by proportion of space allocated to individual workspaces.SPACE ALLOCATION RATIO CHARTSIndustry SectorSpace TypesLaw Enforcement14%32%23%16%4%11%Space Allocation Rate: 199.6TechnologySpace Allocation Rate: 140.01%Biotech & Science50%25%Space Allocation Rate: 219.643%Space Allocation Rate: 335.0Arch & EngineeringCall CentersSpace Allocation Rate: 103.2Finance28%16%10% 1%9%11%4%17%KEY TAKEAWAY #1LegalSpace Allocation Rate: 168.429%11%10%19%43%6%22%51%30%16%15%27%37%4%7% 2%11%13%7%14%5%5%Space Allocation Rate: 168.0Social ServicesSpace Allocation Rate: 207.3March 2012OfficeWorkstationCollaborationGeneral SupportSocial SupportMission Specific41%38%8%11%3%With few exceptions, the industrysectors with the lowest proportionof space allocated for offices andworkstations generally have a higherallocation of space to supportcollaboration. There is no directcorrelation to general support, socialsupport or mission specific space types.KEY TAKEAWAY #2Historically, the typical workplacewas comprised of 50% individualworkspace area and 50% supportareas. The data suggests that recentworkplaces are allocating less spacefor general support and reallocatingthat space to increase either group orindividual workspace area.Workplace Standards Benchmarking7
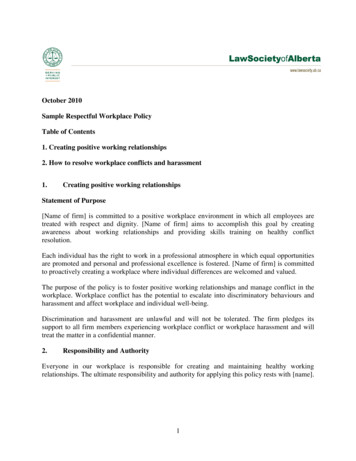
BENCHMARKING: INDUSTRY SECTORSThe chart below displays the average ratio of enclosed offices to openworkstations per industry sector.ENCLOSED OFFICE TO OPEN WORKSTATION RATIOIndustry SectorTechnologySpace Allocation Rate: 140.0Call CentersSpace Allocation Rate: 103.2Arch & EngineeringSpace Types1%99%4%96%8%Enclosed OfficeOpen Workstation92%Space Allocation Rate: 168.4Law EnforcementKEY TAKEAWAY #114%The ratio of enclosed offices toopen workstations is lowest in theTechnology, Call Centers, A/E, andLaw Enforcement sectors. All four ofthese industry sectors also have themost amount of area allocated forcollaborative spaces (22-29% of theirtotal NSF).86%Space Allocation Rate: 199.6Biotech & Science29%71%29%71%Space Allocation Rate: 219.6FinanceKEY TAKEAWAY #2Space Allocation Rate: 168.0Social Services42%58%Space Allocation Rate: 207.3Legal60%40%Legal is the only industry sector with ahigher proportion of enclosed officesto open workstations. The Legal sectoralso has the highest average spaceallocation rate at 335 USF per totalpersonnel.Space Allocation Rate: 335.0March 2012Workplace Standards Benchmarking8
BENCHMARKING: INDUSTRY SECTORSThe following graph illustrates the average office size per industry sectorwhere available. Most organizations within the Technology sector as wellas a few others from other sectors do not have enclosed offices.AVERAGE OFFICE SIZE & SPACE ALLOCATION RATELegendNSFUSF /Person170370160157158158335150Avg. Office NSFUSF per PersonSample 1101902001681001601681409013080100103Biotech &ScienceMarch 2012TechnologyCall CentersFinanceSocialServicesLawEnforcementArch &EngineeringKEY TAKEAWAY #1There is no direct relationshipbetween space allocation rates andaverage office size standards. Despitevarying average office sizes, theCall Centers, Technology, and A/Esectors have among the lowest spaceallocation rates. While the Legal, LawEnforcement, and A/E sectors havecomparable office size standards,their space allocation rates varysignificantly. The efficiency of aworkspace is more strongly influencedby the ratio of enclosed offices to Enclosed:Open)(Enclosed:Open)Workplace Standards Benchmarking9
BENCHMARKING: INDUSTRY SECTORSThe following graph records the average standard workstation size perindustry sector. The metrics are a combination of prevailing workstationsizes as well as averages where no dominant workstation size was present.AVERAGE WORKSTATION SIZE & SPACE ALLOCATION RATELegendNSFUSF /Person75757076370Avg. Workstation NSFUSF per PersonSample 42168KEY TAKEAWAY #1The industry sectors with the lowestworkstation standards and the lowestproportion of enclosed offices to openworkstations have among the mostefficient space allocation rates.19016840160140343513010330Call CenterMarch 2012100TechnologyFinanceArch &EngineeringBiotech Y TAKEAWAY #2The Social Services and Legalsector averages have the highestproportion of enclosed officesto open workstations (42:58 and60:40 respectively) and the largestworkstation standard sizes. However,their space allocation rates vary byapproximately 128 USF per person.Workplace Standards Benchmarking10
WORKPLACE TREND #1: HOTELING & FREE-ADDRESSAcross industry sectors, more employeesare working in more locations outside theoffice, within the office, and from home.The purpose for coming into the office isbecoming less focused on individual workand more about collaborating and interactingwith others. As a result, companies arebeginning to rethink both real estate andworkplace strategies with four key objectivesin mind: 1) increase employee performanceby supporting mobile work patterns; 2) utilizespace more efficiently and reduce real estateand occupancy costs; 3) reduce resource useand contribute to sustainability; 4) positivelyimpact recruitment and retention by properlysupporting diverse workstyles.Facilities and workplace strategists havebeen exploring new methods of assigningspace as a means to increase utilization andsupport the new ways in which employees areworking. Rather than unilaterally assigningall employees to a dedicated workstation oroffice, many companies are adopting hotelingor free-address programs to repurposepreviously assigned individual space tocollaboration space, and, in some cases,significantly reducing overall real estate.The hoteling concept is a system inwhich individual workspaces are sharedamong employees and reserved for useby an individual for a specific time period.Frequently, a corporate concierge isresponsible for scheduling and equippingthese spaces for use. However, the norm istransitioning to a virtual reservation system.Image 1: Razorfish, David Joseph. Mobility WorkstationImage 2: Metlife, Chris Leonard. Reservation KioskImage 3: Metlife, Chris Leonard. Touch-down CafeSimilar to hoteling, the free-addressworkspaces are unassigned and can beused by any employee. Reservations are notrequired; spaces are available on a firstcome, first-serve basis. Free-address is alsocommonly referred to as “just-in-time.”Prior to adopting a hoteling or free-addressprogram, an organization should developand carefully consider the feasibility of amobility strategy. There are many otherfactors that must be addressed to effectivelyimplement a hoteling or free-address system,such as employee work patterns, currentand projected mobility adoption levels, andthe mobility readiness criteria, which coverssuch considerations as organizational culture,technology, work function, processes, policies,and protocols.STEPS TO DEVELOP A MOBILITY STRATEGYWORK PATTERNDefining how people work MOBILITY ADOPTIONDocumenting the state of mobility MOBILITY STRATEGY Understand the implications of amobility strategy through aligningspace solutions with work patterns,processes, policies, and culture.MOBILITY READINESS CRITERIAAssessing the feasibility of mobility readinessMarch 2012Workplace Standards Benchmarking11
CASE STUDY #1: CONFIDENTIAL CONSULTING CLIENTCONFIDENTIAL CONSULTING CLIENTWORKPLACE PILOT STUDYNew York, NY2010Area: 10,000 USFTotal Staff: 659Mobile Staff: 56%Mobile Sharing Ratio: 5:4 (HC : Seats)16%higher satisfaction withthe overall work environmentIn 2010, a confidential consulting client was rapidly outgrowing its NewYork office location. To respond to the considerable increase in staff andpreserve the culture and connectedness of teams, the company launcheda workplace transformation pilot study on a select floor of their NewYork office.The pilot included three major workplace changes. Firstly, the companyreduced workplace standards to more appropriately support thefunctional nature of the work. Senior consultants moved from largeperimeter offices to more appropriately sized interior offices. The juniorconsultants moved from interior offices to a collaborative open officeenvironment. The second component of the pilot study incorporated aformal mobility strategy to acknowledge the significant amount oftime that consultants were out of the office traveling to client locations.As a result, the company adopted an overall mobility sharing ratio of5 mobile staff per 4 hoteling workstations. Workstations are reservedthrough a reservations system. Mobile staff members store personal filesand supplies in assigned lockers. The final component of the workplacetransformation study was to increase and enhance the social, training,and meeting spaces to preserve and promote the collaborativeculture of the consulting teams.Recognizing the magnitude of the changes, a formal changemanagement process was incorporated to strategically introduce andimplement the pilot study. The change management program involved avisual marketing campaign and series of engagements to involve staff inthe transformation process and educate them about the benefits.A post-occupancy survey was launched to all staff in the New Yorkoffice in 2011 to assess the results of the workplace pilot study. Theresults were overwhelmingly positive. Overall, staff members were moresatisfied with the work environment in the pilot study than any otherfloor. Residents rated their ability to collaborate, sense of community,and awareness and approachability of other colleagues highest. Despitethe transition to the open work environment and hoteling system, therewas no adverse result in how well the individual workspace supportedtheir diverse workpatterns, including quiet, focused work.Confidential Client, Chris Leonard. Mobility WorkstationMarch 2012Workplace Standards Benchmarking12
WORKPLACE TREND #2: BENCHINGCompanies are finding the demand forlayout space and individual filing is rapidlydecreasing as work becomes more digital.The need for more desk surface area isquickly being replaced by the need for morecomputer screen surface as employees movebetween multiple electronic documents andfiles simultaneously. As a result, the functionalneed for larger workstations are beingreevaluated. Many companies are reducingworkstation standards and transitioning toa benching system to enhance flexibility,promote overall awareness, and generatehigher density, which results in increasedutilization, employee satisfaction, and realestate cost reduction.The benching systems are generally the mostcost-efficient workplace solution. While panelmounted systems are available for 10% lessthan the traditional cubicle, benching systemsare available for nearly 50% less. In additionto the cost of furniture, the flexibility of theconfiguration can reduce costs associatedwith moves and maintenance.Image 1: Ares Management, Andrew Bordwin. Benching with ReturnImage 2: Confidential Client, Ryan Gobuty. Open WorkspaceBenching is a workstation system thatallows full lateral flexibility. Widely used inthe financial industry, the workstations weretraditionally designed around the frame of atrading desk. The system allows the ability toreconfigure the space to accommodate 1.5m( 5 ft) desks or 2m ( 6.5 ft) desks simplyby sliding along the work surface plan andadding or subtracting storage returns.AVERAGE FURNITURE SYSTEM COSTSHIGH PANELS 7x7Average Cost: 2,850 per workstationMarch 2012LOW PANELS 7x7*Averages include furniture samples from Steelcase, Herman Miller, and Haworth.Average Cost: 2,650 per workstationBENCHING 6x8Average Cost: 1,700 per workstationWorkplace Standards Benchmarking13
CASE STUDY #2: ate2010Area: 156,000ProjectStats.USFTotal Staff: 800195 USF per person (seat count)100%36sf open workstations (benching)Nokia, Nic Lehoux. Open Benching systemMarch 2012Faced with an increasingly competitive market, Nokia combined several of its scattered R&D sitesinto a single location in Sunnyvale, California. The real estate strategy was about more than just realestate cost-savings. By collocating their R&D employees into a single, collaborative environment,Nokia sought to re-position and re-invent their culture and image in the Silicon Valley.Nokia’s workplace strategy is centered on a fundamental workplace shift. By decreasing the focus onthe traditional definition of individual workspace, they were able to increase the allocation of spacesthat provide alternative individual work settings as well as an increase in spaces that are conducivefor interaction, collaboration, and non-traditional ways of working.Nokia implemented a simple 36sf benching system as the “home-base” for employees. The benchingworkstations provide employees with a dedicated workspace to functionally meet the majority ofindividual work task requirements. At the same time, the modularity of the system provides Nokiawith maximum flexibility to quickly and efficiently adapt to workplace changes and team formations.The reduced standards open up the workspace to provide significantly more spaces to supportdifferent individual and collaborative tasks.Nokia, Nic Lehoux. Informal Collaboration SpaceWorkplace Standards Benchmarking14
WORKPLACE TREND #3: THE HUBMore than ever before, companies aresearching for the best way to fosterinnovation in an increasingly competitivebusiness environment. The workplace canhelp by creating more opportunities for theexchange of concepts and ideas. Workplacedesign can articulate how people use andmove throughout the office. Strategicallylocating spaces within an office increasesthe likelihood for employees that wouldnot typically work together to cross pathsand interact. The idea of the Hub is tointentionally design for these informalpoints of intersection. At the same time, theHub results in efficient utilization of spaceand shared resources. It can also promoteorganizational community, which oftenrelates to job satisfaction.open and enclosed meeting rooms, print andcopy functions, and common filing or storagespaces, the Hub has the ability to bring awider range of people together in one centrallocation.Image 1: Belkin, Ryan Gobuty. Informal Collaboration HubImage 2: Confidential Consulting Company, Chris Leonard. Social HubImage 3: OneWorld Lounge, Christopher Barrett. Lounge HubThe circulation and paths that connect thedifferent workplace components are just asimportant as the individual spaces themselvesin a Hub environment. These interstitialspaces guide different people along commonpaths and foster the informal interactionsthat promote the exchange of ideas. Pivotallocations along major thoroughfares orintersections can be enhanced with smallopen breakout areas with seating and toolsfor impromptu collaboration.The break room or pantry is the mostcommon form of a Hub setting in theeffort to promote organizational and socialcommunity. By collocating the primary socialareas with other support spaces, such asImage 1: Confidential Client. Centralized Support; Image 2: Confidential Client, Sherman Takata. Breakout Space offCirculation; Image 3: Columbia College Chicago, Michelle Litvin. Flexible Interactive SpaceCREATING A “HUB” ENVIRONMENTCENTRALIZE SUPPORT &SOCIAL SPACESMarch 2012MAKE CIRCULATIONINTENTIONALDESIGN FOR IMPROMPTUINTERACTIONSWorkplace Standards Benchmarking15
CASE STUDY #3: CONFIDENTIAL TECHNOLOGY CLIENTCONFIDENTIAL TECHNOLOGY CLIENTLProjectPROTOTYPEWORKPLACECity Jose, CASanDate2007Area: 324,000ProjectStats. SFStaff: Administrative OfficeTotal Headcount: 2,200Total Seat Count: 1,800Mobile Sharing Ratio: 3:2 (HC : Seats)60%higher workplace occupancy per floor.A confidential technology company was interested in exploring howtechnology systems can
March 2012 Workplace Standards Benchmarking 5 SUMMARY BENCHMARKING AVERAGES KEY FINDING #3 Of all the case studies included in this report, Public Sector organizations have higher space standards than Private Sector companies in terms of average