Transcription
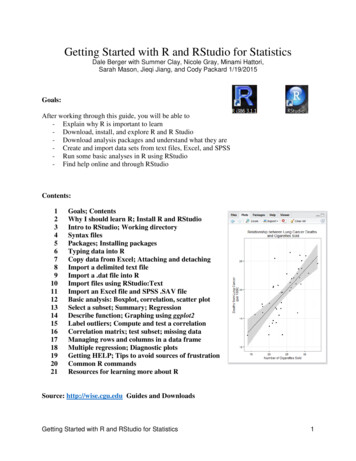
Getting Started with R and RStudio for StatisticsDale Berger with Summer Clay, Nicole Gray, Minami Hattori,Sarah Mason, Jieqi Jiang, and Cody Packard 1/19/2015Goals:After working through this guide, you will be able to- Explain why R is important to learn- Download, install, and explore R and R Studio- Download analysis packages and understand what they are- Create and import data sets from text files, Excel, and SPSS- Run some basic analyses in R using RStudio- Find help online and through oals; ContentsWhy I should learn R; Install R and RStudioIntro to RStudio; Working directorySyntax filesPackages; Installing packagesTyping data into RCopy data from Excel; Attaching and detachingImport a delimited text fileImport a .dat file into RImport files using RStudio:TextImport an Excel file and SPSS .SAV fileBasic analysis: Boxplot, correlation, scatter plotSelect a subset; Summary; RegressionDescribe function; Graphing using ggplot2Label outliers; Compute and test a correlationCorrelation matrix; test subset; missing dataManaging rows and columns in a data frameMultiple regression; Diagnostic plotsGetting HELP; Tips to avoid sources of frustrationCommon R commandsResources for learning more about RSource: http://wise.cgu.edu Guides and DownloadsGetting Started with R and RStudio for Statistics1
Why should I learn about R?Your old friend Bumble asks: “I can calculate basic statistics using Microsoft Excel, and I knowhow to conduct more sophisticated statistical analyses using SPSS. Why should I learn R?”1.2.3.4.5.6.7.8.9.10.It’s FREE!!!R is growing rapidly in all areas that use data analysis, including in social science.R code is included in many journal articles and other publications.R has incredible graphics capability, including 3D and interactive graphs.Over 6000 analyses and graphics packages are available for free download.You can do customized analyses with R, and even create and share your own packages.Datasets from other statistical software can be imported into R.There is a large international user community of helpful people.After you gain experience with R, it becomes relatively easy to use.R is listed as a desirable skill for an increasing number of jobs.Install RTo download R, go to http://cran.r-project.org, the home base for R.For Mac users, click “Download R for (Mac) OS X” and just accept all defaults.For Windows users: Click on “Download R for Windows” “base” “Download R 3.x.x forWindows” Double-click the downloaded installer file. You can just accept all default settingsthough you may have some different preferences.After the program is installed, an icon for R will appear on your desktop.You can read more about the R project at http://www.r-project.org/ where you will find links tomanuals, FAQs, etc.When you open R, you are presented with the bare prompt “ ” indicating it is your turn to dosomething. RStudio provides a friendlier interface, with pull-down menus, and separate windowsfor entering commands and showing output. For that reason, I recommend that you installRStudio and that you use it to interface with R.Install RStudioDownload R Studio at http://RStudio.org.Click “Download RStudio” “RStudio Desktop” “Download RStudio Desktop” “RStudioxx.xx.xxx” (select Windows or Mac version as appropriate for your system)Save the file, execute the file, and accept all default options.An RStudio icon will appear on your desktop.Getting Started with R and RStudio for Statistics2
Introduction to RStudioRStudio integrates the features of R. Open RStudio. It displays four panes, some of which havetabs and some may be minimized or hidden. Options to change the display can be found byclicking “Tools” “Global Options” “Pane Layout then select viewer under Source.The lower-left pane is the ‘Console’ where commands are entered to the R prompt and someresults are shown immediately. Other panes may be hidden, but the R console is alwaysavailable.The upper-left pane is a ‘Source’ window where syntax files and other information can be seen.R script (i.e., syntax) can be entered here.The upper-right pane is the ‘Workspace’ that shows files that you have imported and a tab showsthe history of commands you have used.The lower-right pane shows files, with tabs to show plots that you generate, packages in yourlibrary, and help that offers ability to search.Working DirectoryYour working directory is the specific location on your computer where files available to R bydefault are stored. To find your working directory, enter the command getwd() to the prompt.After you enter this command and press Enter, your working directory is shown immediately inthe console window, following [1], and a new prompt is shown.Many commands in R can take ‘arguments’ that indicate specific information. Even when noarguments are specified, both left and right parentheses must be included with those commands.Here the command to get the working directory getwd()includes the left and right parentheses.Important note: R is very fussy about capitalization. Thus, HELLO, Hello, and hello are threedifferent objects in R. When you get an error message saying that an object is not found or that Rcan’t do something, check to make sure you have used exactly the correct capitalization.It is good to use a special directory for R, separate from our other documents. First, create thedirectory that you want to use, and then give the setwd command to change to that directory. Icreated a directory called “C:Users/Dale/Documents/R” with Windows Explorer. Then I told R setwd("c:/Users/Dale/Documents/R")Error in setwd("c:/Users/Dale/Documents/R") :cannot change working directoryOh, oh! What happened? Really R, you can’t do it?Oops, I forgot to capitalize the C! setwd("C:/Users/Dale/Documents/R")R doesn’t tell me that it worked, but at least it didn’t scold me. Let’s check to see if it worked. getwd()[1] "C:/Users/Dale/Documents/R"Getting Started with R and RStudio for Statistics3
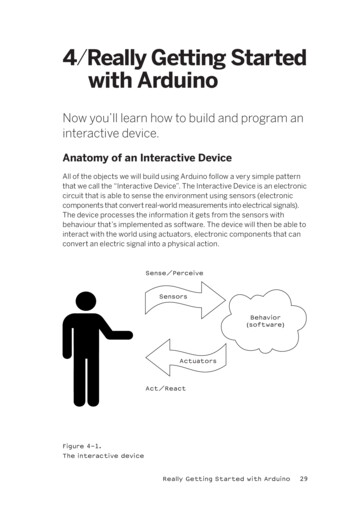
Yes, now the working directory is the special R directory that I created.You can set the working directory easily with RStudio: Session; Set Working DirectoryAs with SPSS, R uses data files and syntax files. Data files can be created in R, downloaded as Rdata files, or imported from SPSS, Excel, or many other formats. Syntax files can be saved forfuture use and reference. Let’s begin with some simple R syntax.To assign a value to a variable, it is standard practice in R to use the symbols - . For example,to assign the value of 4 to x, we give the command x - 4 to the R console prompt. x - 4(Nothing seemed to happen. However, now enter x and R will return the new value of x.) x[1] 4 Syntax FilesWhen you enter commands into the R console one line at a time, some results may be displayedimmediately. Previous commands can be found by using the up-arrow key, so they can be editedand resubmitted. However, it is often more efficient to create the commands in a separate syntaxfile that can be saved. To open a new R Script file in RStudio, click File, New File, and R Script,Enter. Many menu commands have keyboard equivalent commands – here Ctrl Shift N.This opens a new syntax window in the top-left pane. Now you can enter several lines of codeand run them all at once. The number sign (#) indicates a comment in R, and anything on a linefollowing # will not be evaluated by R. It is important to use comments to document your code.For illustration, I entered four lines of code with a lot of documentation in the syntax window:Notice that I used an equal sign rather than the - symbols. The equal sign could be confusing ina command like x y. Quiz: What would happen if we gave the command x y on step 5?Answer: R would assign the value of y to x, so both x and y would be equal to 3. To avoidambiguity, most R practitioners use the - symbols to assign values. Reverse assignment - also works.Getting Started with R and RStudio for Statistics4
You can highlight (left-mouse drag) commands and press the icon to run the current selection,the first box with a green arrow. You can hover over the icons to see what they do.Now in the R console we find the following:Yay! It worked. We could save this syntax file as an .R file with Ctrl-S or with the Save icon.PackagesPackages are collections of R resources that people have made for special purposes. Somepackages come automatically with R, and you can install others for your own purposes. You canfind a complete list of contributed packages at http://cran.r-project.org/web/packages/ . As ofDecember 14, 2014, the repository contained 6107 available packages. Packages need to beinstalled only once, but when you begin a new R session, you must load the installed packagesthat you will use in that session. Some packages, including package:stats, are loaded by default.library()search()# see all installed packages listed in the Source pane# see packages currently loaded, including the defaultsFind, Install, and Load the psych PackageIn the bottom-right panel of RStudio, select Packages; Click Install to open Install Packages;Repository (CRAN, CRANextra) is fine – you have the option of selecting a ZIP file but that isnot needed for normal size packages. In Packages, enter psych. The default library location isfine. Check the Install dependencies box. Click Install.The R console should show messages indicating that package ‘psych’ successfully unpacked.Now click the Packages tab in the bottom right pane, and you should find psych is included inthe User Library of installed packages.If you enter search() in the R console, you will see a list of loaded packages, but psych is notlisted. You can load psych by checking the box next to psych in the list of packages shownunder the Packages tab. Now when you enter search(), the list of loaded packages will include“package:psych”. An installed package (stored on your computer) must be loaded for R to use it.Getting Started with R and RStudio for Statistics5
You can click on psych in the Packages tab to find documentation for the psych package. Thepsych package includes code for things like scale construction and factor analysis.Create Data by Typing Data into RLet’s begin by entering data directly into R, and then see how to import files from otherprograms like Excel, SPSS, etc.Variables can be defined as individual values as we did in the Syntax Files section, like x 4.Data can also be entered as a string of scores, which we call a vector of scores. Suppose youhave the body weight for five people. You can collect these five scores into a vector with the c()command and call it Weight. ‘c’ stands for ‘collect’ or maybe ‘column’ vector. Weight c(185, 162, 118, 149, 149) # This is similar to a column of data in SPSS.Now if you simply enter Weight, the data will be listed (it is a good idea to check).You also can specify the height for these five people. Height c(72, 70, 65, 65, 63) # The height information is collected into a column vector.Enter Height to the prompt to see how Height is presented by R.Now you can use these data to compute the Body Mass Index (BMI)for each case. BMI Weight/(Height 2)*703 #You provide the name BMI and the formula.Enter BMI to the prompt to see the results.You can set up a standard matrix of data with variables in columns and cases in rows by defininga ‘data frame.’ One way to do this is to combine vector data for individual variables from a setof cases. Here you have data for five cases on each of three variables, which you can combineinto a standard 5x3 data file. You can name this data frame “BMIdata” or any other name.Getting Started with R and RStudio for Statistics6
Copy data from ExcelHere is an easy way to bring a small data set from Excel into R. The Excel file ‘Smoking andCancer.xlsx’ was created from data downloaded from the DASL collection, accessed throughhttp://wise.cgu.edu . l. The data set includescigarettes sold and rates of various types of cancer per 100,000 for DC and 43 states in 1960.Hold down the left mouse button and highlight the portion of the data set you wish to copy fromExcel, including labels; right-click and select ‘copy’ to put the information into your clipboard.You can also use Ctrl-c when material is highlighted to place it into your clipboard.With the Excel material in the clipboard, you can define a new data frame to be ‘smoking’ andtell R that the headers (variable names) are included in the data file with header TRUE.Mac users may need to install andload the package Kmisc and then usethe following syntax: smoking read.cb (header T)For more information, #14547293Variable names, attaching and detaching filesGreat – the data set was read into R successfully. Now you might think that you could refer to avariable by name to use that variable. Let’s ask to see a list of the states.Nuts! R can’t find State. Why not? R can haveseveral data files open at the same time, so there ispotential ambiguity regarding which data set we are referring to.You can specify a variable that you want by including the name of the data set with the variablename: DataSet VariableName.Getting Started with R and RStudio for Statistics7
Now you can see which states are actually in the data set. Hmm – we are missing PA but wehave PE? There is much more exploring to do at another time.If you are working with one specific data set, you can avoid the need to name the data set eachtime you refer to a variable, by ‘attaching’ the data set to the search path.Now the simplecommand Stateworks as expectedWhen you are finished using an attached data set, be sure to detach it. Ifyou don’t use the detach command, you may have more than one copy ofa file installed. Many experienced R users avoid the attach command.You can see all of the installed packages and data sets with the command search() .A data file can be edited by entering edit(filename)Leave the editor by clicking the X at the top right, and edits are saved.Import delimited files, e.g., Comma Separated Variables (CSV), or tab delimitedA delimited file uses a character such as a comma to separate successive data values. A genericcommand to read such files is as follows:Myfile read.delim(“DataFileName.txt”, header TRUE, sep “”)This command will create a file called Myfile by importing data from a file calledDataFileName.txt. It will read the first line of data as a header that contains variable names. Thesep command identifies the separator between variables. The command sep “” indicates whitespace separates variables, either blanks or tabs.sep “\t” indicates tab separators, sep “,” for comma separated variables, etc.Here is an important trick for importing files. Rather than providing the full name for the fileenclosed in quotes, you can ask RStudio to open a window that will allow you to simply selectthe file that you want. The command is file.choose()To demonstrate, I created a small text file called TabDelDemo.txt with three variables (Y, X1,and X2) where the numbers are separated by tabs, and it ends with an ‘Enter’ key press.When the first command was executed, RStudioopened Windows Explorer, so I could searchthrough my directories to find the fileTabDelDemo.txt and simply select it.Getting Started with R and RStudio for Statistics8
If you enter the full name manually, there is a pitfall to avoid – R misinterprets backward slashes(\) in file names. You can avoid the problem by replacing backward slashes with forward slashes(/) or double backslashes (\\). This is a bit annoying. Let me demonstrate what happens if wedon’t deal with the slashes.The first error was because R was confused by “\U”. When I replaced “\U” with “\\U” then Rstopped at the next occurrence of a single back slash, “\D”. When I replaced all \ with \\, it ranwith no error message.To check that the table was read correctly, I entered the name of the table( Tabs), and then Rdisplayed the table in all of its glory.Note that I could have replaced all of the back slashes ( \ ) with forward slashes ( / ) instead.Import a .dat fileHowell provided a data file on average course evaluations for 50 courses, along with informationon various characteristics of each course. This file is saved in .dat format, Tab15-1.dat. We canread this table into R using the read.table command. To learn more about this command, you canenter help(read.table) or ?read.table. Help files vary in usefulness.If you copy the Tab15-1.dat file into your active R directory, you can refer to the file with itsname alone. Else, you need to include the full address for the file as I have done here. I locatedthe file and right-clicked it, selected Properties, and copied the file location and added the filename. I named the file CourseEval and changed the backslashes (\) to forward slashes (/).I could have used the file.choose() command instead of the file name (that is a lot easier).CourseEval omputer/Tab151.dat",header FALSE)When I entered the command CourseEval, R listed 50 cases followed by rows of NA for cases51 through 397. NA indicates ‘not available’ which means missing.There are at least two ways to fix this. First, when I openedthe original .dat file and highlighted down the file, I saw thatthe file includes a lot of blank lines at the end. You couldsimply delete those blank fields, save the edited file, and reimport into R. That is what I would recommend – there is noreason to have all those blank fields in the file.Getting Started with R and RStudio for Statistics9
A second approach is to deal with the problem byusing R. You can ask R to retain only a subset ofthe cases with the command subset(file.name,condition). Here you could ask R to save only thesubset of cases where the value on V1 is greaterthan zero.Now when we enter the command CourseEval, the data file is shown for only 50 cases.The .dat file did not provide names for our variables, so R just called them V1, V2, etc. You canask R to add names for the variables. The variables, in order, are Overall overall quality oflectures, Teach teaching skills of instructor, Exam quality of exams, Knowledge perceivedknowledge of instructor, Grade expected grade, and Enroll number of students in the class.You can see a list of all variable names with the command names(myfilename).Mac users can convert .dat files created by Windows by going into Terminal and typing:cat name of file you can’t read col -b new name of fileFor more mport a Text File Using RStudioRStudio has a handywizard for importing textfiles. In the upper rightpane, select theEnvironment tab, clickImport Dataset. Select“From Text File ” andbrowse to find the textfile you wish to import.For illustration, Iselected Tab15-1.datfrom Howell, which Rcalls Tab15.1. You canchange the name if youwish by highlighting andrenaming.Getting Started with R and RStudio for Statistics10
Import an Excel file using RStudioFor illustration, I will use a tiny file thatTabachnick and Fidell (5th ed., p. 617) usedto demonstrate factor analysis.Create a simple Excel data file with 5columns and 6 rows including a header rowwith labels, as shown here.**Save this Excel file as SkiersCSV.csv using the Save as type: CSV (Comma SeparatedVariables) or ‘comma delimited’ (comma separated variables).In RStudio, top-right panel, select Import Dataset, From Text File , select SkiersCSV , open.You will see the input file and also the Data Frame file as it is used in R. Check Yes for Heading,Separator is Comma, Decimal is Period, Quote is Double quote (“), click Import.The data file will appear in the top-left panel of RStudio.Verify that R is ready to use the file by entering SkiersCSVYou can edit the data file by entering edit(SkiersCSV) [Click X to exit; edits are retained]Import an SPSS .SAV fileIn most cases importing from .txt will be easier. However, reading an SPSS table into R allowsthe data frame to gain the attribute variable.labels, which provides a description of variablenames in a manner similar to the actual SPSS file.To read in an SPSS file, you need to load the foreign package. The foreign package is a defaultpackage in R, but for whatever reason, the package is not automatically included in a user’slibrary. Thus, there is no need to install the package, but you do need to load the package. Thefile.choose() command instead of the file name works with read.spss, too.The warning messages can be ignored. Note that when I used the full location name for the SPSSdata file, I needed to change the single back slashes to double back slashes.Getting Started with R and RStudio for Statistics11
The “View” command asks RStudio to show the data file in the top-left pane, so we can verifythat the data were loaded appropriately. (Note that “View” is capitalized.) For more informationon the data file, use the command attributes(filename).Basic Data Analysis CommandsHere we will demonstrate some basic commands using the smoking data set. Is there arelationship between number of cigarettes sold and lung cancer rates in these states?I’ll create a new syntax file by clicking File, New File, R Script. This opens a blank screen in theupper left pane. attach(smoking) #Allow naming variables without file nameWhen the syntax file is run, most results appear in the console, butthe boxplot appears in the bottom-right pane of RStudio. Notice thatthe box plot shows two outliers.An important next step would be to track down those two outlier cases to see what is going on.(They are NV and DC, places where many nonresidents buy cigarettes, so the per capita sales isinflated. This suggests that sales may be underreportedin other states, especially neighboring states.)There is a strong correlation between number corofcigarettes sold and lung cancer rates across these states.Let’s take a look at the plot.Those two outliers appear to affect the correlation. Let’ssee what you get when those two cases are removed.Getting Started with R and RStudio for Statistics12
Selecting a subset of data for analysisYou can remove the two outliers by creating a new data set that is a subset of the original data setwhere Cigarettes is less than 35. I called the reduced data set smoking42 (42 cases remain). smoking42 subset(smoking, Cigarettes 35) #Creates a new data set with outliers removed detach(smoking) #Good idea to keep only one file attached at a time attach(smoking42) # We need to tell R to use the new data set – R will give some warnings.The correlation is now a bit larger. The plot appears in thebottom right pane of RStudio when you open the Plot tab.The tests of statistical significance are not reported automatically.R is an introvert, and will answer when asked, but won’t volunteer much.# Another way to select a subset of data for further analyses newdata olddata[, 2:12] #selects all rows and columns 2 through 12[1:40,] would select all columns for the first 40 rows.Summary functionThe summary() function generates information about variables, data sets, models, etc. For asingle variable,summary(variablename) generates a5-number summary plus mean.The summary() function can be applied to a data file, as summary(smoking42) to request thefive number summary for all variables in the active file (not shown here).Regressionlm(Y X) creates alinear model predictinglung cancer rates (Y)from Cigarette sales(X); I named themodel Regression1.There is no outputuntil you ask for it.When summary() isapplied to a regressionmodel, we are giveninformation about theresiduals along with asummary of the modeland statistical tests.Getting Started with R and RStudio for Statistics13
Describe FunctionAnother useful function to describe numeric data is the describe() function.Note that “se” at the end is the standard error of the mean, not the standard error for kurtosis.Also, note that statistics are provided for the non-numeric string variable State. R apparentlycoded State with sequential numbers 1 to 44 (with two missing) and treated those numbers as avariable.Graphing using ggplot2R comes with a basic graphs function called plot() which is helpful, but somewhat functionallyand aesthetically limited compared to the graphing capabilities in the the ggplot2 package. Theggplot2 package was developed by Hadley Wickham and is based on Tufte’s graphingrecommendations and Wilkinson’s (2005) grammar of graphics. The functions in the ggplot2package can take some time to learn, but the main concept behind ggplot2 is that a graph is aseries of layers with each layer composed of some geometric element that can be aestheticallymodified.The ggplot2 package needs to be both installed into your library and loaded for use.In RStudio, bottom-right pane, click Install, and in the Packages slot enter ggplot2, clickInstall. It will take a few seconds to install. Now click the Packages tab and check the boxnext to ggplot2 to load it.Building a graph layer by layer requires creating an object that stores the plot using the ggplot()function. The most basic arguments for the ggplot() function are specifying the data set and thevariables used for the x- and y-axes. In general, the function aes() is a way to specify theaesthetic modifications of your graph for each element layer, of which the plot object is the firstlayer. The aes() function as an argument allows you to specify the x- and y-axes.You can change the relative size of the X and Y axes by changing the window size for Plots inRStudio (stretch or shrink the entire RStudio display in one direction or the other).ggplot2 offers many sophisticated options, only a tiny bit is shown here.[The following example uses an earlier version of the smoking file where the variable Cigaretteswas called Cig.]Getting Started with R and RStudio for Statistics14
First create a plot object.# create plot object.my.plot.object ggplot(smoking, aes(Cigarettes, Lung))Next add a layer specifying which type of graph you would like to return. In this case, let’s makea scatter plot; the function geom point() can be used to add points to your plot object.Suppose you would like to identify only the outliers withtheir state names.# create scatter plot in which only outliers are labeled.my.outliers.plot my.plot.object geom point(data subset(smoking, Cigarettes 35)) geom text(data subset(smoking, Cigarettes 35), aes(label State))my.outliers.plotTo save the graph, use the “export” button in the plotwindow of R-Studio or write the instructions at thecommand line:ggsave(“filename”)You can explore applications of ggplot by using help(ggplot2), or use Google, YouTube, R code for many graph applicationshttps://www.stat.auckland.ac.nz/ paul/RG2e/CorrelationsIs the relationship between cigarettes sold and lung cancer rates statistically significant?R offers several built-in options for computing correlations: cor(), cor.test(), and rcorr().Here is an example using cor.test() using the full names for variables. If smoking42 is attached, Icould use the short names of the variables: cor.test(Cigarettes, Lung) .Getting Started with R and RStudio for Statistics15
Let’s compute the matrix of correlations between all variables (except State)The table appears in the top-left pane:The correlations indicate that the number of cigarettes sold per capita show a positive linearrelationship with per capita rates of bladder cancer, lung cancer, and kidney cancer, but a nearzero correlation with leukemia. We can test the correlation between Cigarettes and Leukemiawith cor.test(); the 95% confidence interval for that correlation ranges from -.40 to .21.Missing dataTips for dealing with missing data from http://www.statmethods.net/input/missingdata.html# recode 99 to missing for variable v1# select rows where v1 is equal to 99, and recode 99 to NAmydata v1[mydata v1 99] - NA# create a new dataset without missing datanewdata - na.omit(mydata)# compute and show the total number of missing cases for a single variablesum(is.na(mydata v1))# view percentage of missing cases for a single variable# if a case is missing, is.na() is equal to 1 (i.e., TRUE)# if not missing, is.na() is equal to 0mean(is.na(mydata v1))*100Getting Started with R and RStudio for Statistics16
Managing rows or columns from a data frameIt is very easy to select or remove whole rows and columns from the data set. Let’s assume weare working with a data frame named mydata:# select a single row, e.g. row 2newdata - mydata[2,]# select multiple rows, e.g. rows 2, 4, and 6newdata - mydata[c(2,4,6),]# select a sequence of rows, e.g. rows 2 through 4Newdata - mydata[c(2:4),]# remove a single row, e.g. row 2newdata - mydata[-2,]# remove several rows, e.g. rows 2, 4, and 6newdata - mydata[-c(2, 4, 6),]# remove a sequence of rows, e.g. rows 2 through 4Newdata - mydata[-c(2:4),]# select a single column, e.g. column 2newdata - mydata[,2]# select multiple columns, e.g. columns 2, 4, and 6newdata - mydata[,c(2, 4, 6)]# select a sequence of rows, e.g. rows 2 through 4Newdata - mydata[,c(2:4)]# remove a single column, e.g. column 2newdata - mydata[,-2]# remove multiple columns, e.g. columns 2, 4, and 6newdata - mydata[,-c(2, 4, 6)]# remove a sequence of rows, e.g. rows 2 through 4Newdata - mydata[,-c(2:4)]The subset() function is also useful. UCLA has a very nice tutorial on the subset() function here:http://www.ats.ucla.edu/stat/r/faq/subset R.htm.Getting Started with R and RStudio for Statistics17
Multiple RegressionHow well can we predict cigarettes sold using all four of the cancer measures? The linear modellm() function is used to fit linear models. We can call the model anything we
Getting Started with R and RStudio for Statistics 5 You can highlight (left-mouse drag) commands and press the icon to run the current selection, the first box with a green arrow. You can