Transcription
National Aeronautics and Space AdministrationGoddard Space Flight CenterGreenbelt, Maryland 20771 USACloud Aerosol Transport System (CATS)Data Management SystemData Products CatalogRelease 7.0: L1B Version 3.00, L2O version 3.00
Cloud Aerosol Transport System (CATS)Data Management SystemData Products CatalogRelease 7.0Primary Authors:Stephen P. Palm, Dennis L. Hlavka, Patrick Selmer, Rebecca PaulyScience Systems and Applications Inc. (SSAI)NASA Goddard Space Flight Center, Code 612Oct. 01, 2018ii
iii
Cloud Aerosol Transport System (CATS)Data Management SystemData Products CatalogRelease 7.0Oct. 01, 2018SUBMITTED BY:Stephen P. PalmDateCATS Data ManagerAPPROVED BY:John E. YorksDateCATS Science LeadMatthew J. McGillDateCATS Principal Investigatoriv
Document Revision RecordThe Document Revision Record below contains information pertaining to approved documentchanges. The table lists the date the change is issued, the Document Change Request (DCR)number, a short description of the revision, and the revised sections.Table 0: Document Revision RecordIssue ber1.03.06.07.0Description of the RevisionInitial Data ReleaseThird L1 Release, First L2 ReleaseSixth Release, L1 & L2OSeventh Release, L1B & L2OvSectionAffectedAllAll2All
Table of ContentsDOCUMENT REVISION RECORDVACRONYMSVISYMBOLS, SI UNITSVII1.0 INTRODUCTION11.1 CATS DEFINITIONS1.2 CATS RAW DATA DESCRIPTION1.3 CATS DATA MANAGEMENT STRUCTURE4882.0 ARCHIVAL DATA PRODUCTS102.1 LIDAR LEVEL 1A DATA PRODUCT2.2 LIDAR LEVEL 1B DATA PRODUCT2.2 LIDAR LEVEL 2 OPERATIONAL LAYER DP2.4 LIDAR LEVEL 2 OPERATIONAL PROFILE DP2.5 LIDAR LEVEL 2 OPERATIONAL NEAR REAL TIME1013213342APPENDIX A: ISS PAYLOAD BROADCAST ANCILLARY DATA45vi
AcronymsASL, CNRTOPSPOICSTD3WLPL-UAD 16CTRSAbove Mean Sea LevelCATS Automated Processing SystemCloud Aerosol Transport SystemCloud Physics LidarDevelopment (e.g. Product)Data Management SystemGlobal Modeling and Assimilation OfficeGoddard Space Flight CenterHierarchical Data FormatHigh Spectral Resolution LidarInternational Space StationLevel 0 (e.g. data)Level 1 (e.g. data)Level 2 (e.g. data)Level 3 (e.g. data)Marshall Space Flight CenterNear Real TimeOperational (e.g. Product), Operations (e.g. activity)MSFC Payload Operations Integration CenterStandard (e.g. Product)Three WavelengthDataset 16 of the ISS Payload Unique Ancillary DataConventional Terrestrial Reference Systemvii
Symbols, SI Unitsuadeg CJKkmmmbmradµradmsnmPaper, %s, secsrVWµmastronomical unitdegreedegree CelsiusJoulekelvinkilometermetermillibarmilli radiansmicro adianvoltwattmicron, micrometerData Type AbbreviationsCharFloat 32Float 64Int 8Int 16Int 32MBUInt 8UInt 16UInt 32Character, 8 bits or 1 byteFloating Point, 32 bits or 4 bytesFloating Point, 64 bits or 8 bytesInteger, 8 bits or 1 byteInteger, 16 bits or 2 bytesInteger, 32 bits or 4 bytesMBytes, megabytes, or bytes/1024Unsigned Integer, 8 bits or 1 byteUnsigned Integer, 16 bits or 2 bytesUnsigned Integer, 32 bits or 4 bytes2viii
1.0 IntroductionThe Cloud-Aerosol Transport System (CATS) is a lidar remote sensing instrument that providedrange-resolved profile measurements of atmospheric aerosols and clouds from February 2015through October 2018. The instrument was located on the Japanese Experiment Module –Exposed Facility (JEM-EF) on the International Space Station (ISS). Data from CATS is used toderive properties of cloud/aerosol layers including: layer height, layer thickness, backscatter,optical depth, extinction, and depolarization-based discrimination of particle type. The ISS orbitis a 51-degree inclination orbit at an altitude of about 405 km. This orbit provides morecomprehensive coverage of the tropics and mid-latitudes than sun-synchronous orbiting sensors,with nearly a three-day repeat cycle. CATS is intended to operate on-orbit for up to three years.The CATS payload was designed to provide a combination of long-term operational science, inspace technology demonstration, and technology risk reduction for future Earth Sciencemissions.The measurements of atmospheric clouds and aerosols provided by the CATS payload are usedfor three main science objectives, which include:1. Extend Lidar Climate Observations Provide measurements of cloud and aerosol profiles similar to CALIPSO, fillingthe potential data gap if CALIPSO were to cease operation before another spacebased lidar mission begins. Create continuity in the global lidar record by collaborating with CALIPSO tocreate similar data products. Provide measurements at various local times to promote studies of diurnalchanges in clouds and aerosols.2. Provide Observational Data to Improve Operational Modeling Programs Improve model performance through assimilation of near-real-time data products,utilizing the near-instantaneous data download capabilities of the ISS Improve Air Quality forecasts and hazard warning by providing the verticaldistribution of aerosols in near-real-time. Advance aerosol typing accuracy from space-based lidar using the newcapabilities of the CATS instrument (spectral depolarization, 355 nm, etc.)3. Advance technology in support of future space-based lidar mission development Demonstrate HSRL retrieval of aerosol extinction from space and provideobservational data at 355 nm for Aerosols, Clouds, Ecosystems (ACE) missiondevelopment Laser Technology Demonstration/Risk Reduction: high repetition rate, injectionseeding (HSRL), and wavelength tripling Exhibit the utility of photon-counting detection and high rep-rate lidar systems forfuture cloud and aerosol missions.1
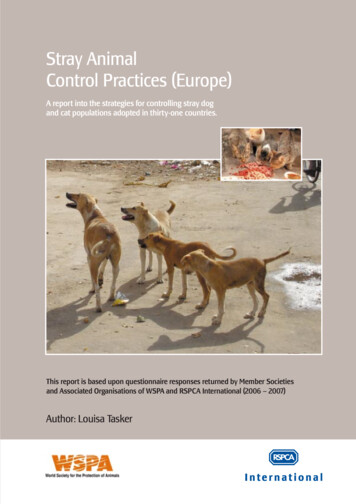
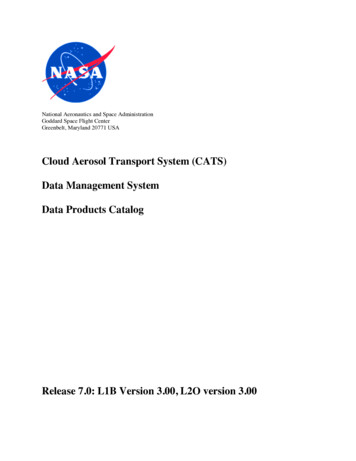
To meet these three science goals, CATS operated in two different modes using fourinstantaneous fields of view (IFOV) as shown in Figure 1.1: Mode 7.1: Multi-beam backscatter detection at 1064 and 532 nm, with depolarizationmeasurement at both wavelengths. The laser output is split into two transmit beams, oneaimed 0.5º to the left and one 0.5º to the right, effectively making two tracks separated by7 km ( 4.3 mi) at Earth’s surface. This operational mode was only used until 21 March2015 due to a failure in laser 1 electronics. Mode 7.2: Demonstration of HSRL aerosol measurements. This mode was designed touse the injection-seeded laser operating at 1064 and 532 nm to demonstrate a highspectral resolution measurement using the 532-nm wavelength. However, this mode waslimited to 1064 nm backscatter and depolarization ratio because of issues with stabilizingthe frequency of laser 2 prevent collection of science quality HSRL data.Mode 7.1: Multi-BeamBackscatter: 532, 1064 nmDepolarization: 532, 1064 nmL2 Products: 532, 1064 nm-0.5oMode 7.2: Laser 2Backscatter: 532, 1064 nmDepolarization: 1064 nmL2 Products: 1064 nm 0.5o415 km415 km14.38 mdiameter14.38 mdiameterRFOVLFOV7 kmFFOVSemi-continuous operation:Feb. 10 – Mar. 21 (2015)Semi-continuous operation:25 Mar. 2015 – 30 Oct. 2017Figure 1.1 CATS two main Science Modes for operation, with details of each mode’s capabilities and operationaltimeline.The Cloud-Aerosol Transport System (CATS) payload was based on existing instrumentationbuilt and operated on the high-altitude NASA ER-2 aircraft, including the Cloud Physics Lidar(CPL, McGill et al. 2002) and the Airborne Cloud-Aerosol Transport System (ACATS, Yorks etal. 2014). The instrument consisted of two high repetition rate (4-5 kHz), low energy (1-2 mJ)Nd:YVO4 lasers operating at three wavelengths (1064, 532, and 355 nm), a receiver subsystemwith a 60 cm beryllium telescope that has a 110 microradian field of view, photon-countingdetectors, and a data system to provide timing of the return photon events. More details on theCATS instrument design can be found in the CATS Algorithm Theoretical Basis Document.2
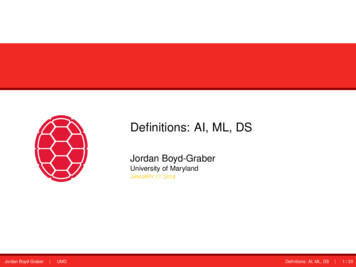
The CATS Data Products Catalog (DPC) describes the CATS Automated Processing System(CAPS) and data management structure used to convert the CATS raw data into scientific dataproducts. The DPC is intended to provide an overview of the data products that are used orproduced by the Data Management System. The GSFC ICAPS processes, archives, anddisseminates the CATS data products in Hierarchical Data Format (HDF) to the scientificcommunity.The data products generated from the CATS measurements are produced according to a protocolthat is similar to that established by NASA’s Earth Observing System (EOS), but are notrequired to meet any specific protocol. The CATS data product levels are defined as follows: Level 0: reconstructed, unprocessed instrument data at raw resolutions (i.e., thedownlinked raw photon counts from the CATS instrument). Any and all communicationsartifacts (e.g. synchronization of packets, communications headers, duplicate or missingdata) are removed in the L0 process.Level 1A: Level 0 data that is time-referenced, geo-located, corrected for detectornonlinearity and instrument artifacts, normalized to laser energy, and annotated withancillary information. The CATS Level 1A data (relative normalized backscatter) is aninternal product only and is not distributed.Level 1B: Level 1A data that have been calibrated, annotated with ancillarymeteorological data, and processed to sensor units. The CATS Level 1B data (attenuatedtotal backscatter and depolarization ratio) is archived as Level 1 data.Level 2: Geophysical parameters derived from Level 1 data, such as the vertical featuremask, profiles of cloud and aerosol properties (i.e. extinction, particle backscatter), andlayer-integrated parameters (i.e. lidar ratio, optical depth). There will be two CATS Level2 products:o CATS Heritage L2: L1B files that are run through the CALIPSO L2 algorithmsto provide continuity in the algorithms used for the lidar climate record.o CATS Operational L2: L1B files that are run through the new operational CATSL2 algorithms, which will include new capabilities that correspond to newinstrument technology.Figure 1.2 demonstrates the CATS command/control and data communications structure.Functionally, there are five elements that make up the command/control and datacommunications structure: 1) CATS, 2) ISS, 3) the Marshall Space Flight Center (MSFC)Payload Integration Center (POIC), and the 4) CAPS Trek and 5) CAPS Science workstations.The POIC serves as the command and communications link between CAPS and CATS on theISS. CATS receives instrument commands initiated from CAPS Trek to the POIC via a VPNethernet connection. The commands are then transmitted from the POIC to the ISS over TDRS,and from the ISS to CATS using the 1553 communications circuit. In addition, CATS receiveshousekeeping and telemetry data from ISS via 1553. Housekeeping data includes time andposition information from dataset 16 of the ISS Payload Unique Ancillary Data. The CATS rawscience data (and alignment data) are transmitted from CATS to the ISS using the JEM-EF HighRate Data Link (HRDL). The science data are then transmitted to the POIC over TDRS, and thento CAPS Trek via VPN ethernet, and finally passed through via LAN to the CAPS Scienceworkstation for archival and Level 0, 1, and 2 processing. CATS command and data3
communications utilize the Consultative Committee for Space Data Systems (CCSDS) format.The command and science data represent the core of the CCSDS information packets transmittedto/from CATS, with various header information added at both POIC and ISS stages. Thus, theterm raw data refers to the CCSDS packets containing core science data and headers appliedbetween CATS, ISS, and the POIC. The final CCSDS raw data transmitted to CAPS Trek fromthe POIC, and passed unaltered to CAPS Science workstation for archival are referred to asLevel 0 data. It is not expected that raw science data transmitted from CATS is the same formatas Level 0 data archived by CAPS.Figure 1.2. CATS Command/Control and Data Communications Structure.1.1 CATS DefinitionsRaw DataRefers to the data collected onboard the ISS by CATS, as well as ancillary time and position datacollected by CATS during operations such as the ISS Broadcast Ancillary Data (BAD). Ancillarydata are added to the science data collected by CATS. The term raw data will be used to refer toany CCSDS data file or packet within CATS, CATS to the ISS, and ISS to POIC. During thistransfer process it is expected that various CCSDS headers and file/packet formatting will occurto the core science data being transmitted, and these will all be referred to as “raw data” withinthis document.BAD4
Refers to the ISS Broadcast Ancillary Data (BAD). It contains time and position informationrequired for science and alignment processing. Thus, any reference to BAD refers to time and/orposition information.Level 0, L0 DataRefers to the data files/packets sent from the POIC to the CAPS Trek workstation. It is expectedthat all final ISS/POIC related CCSDS formatting will be completed by this stage. Level 0files/packets will be passed, unaltered, from CAPS Trek to the CAPS Science workstation forarchival and Level 1 processing.HeaderRefers to metadata and/or diagnostic information contained in both raw data files and Level 0, 1,and 2 data files.Data Mode or ModeRefers to the operational CATS mode during collection of scientific raw data and other activities.The mode is a programmable setting via the CAPS Trek workstation, and will be included in theraw data header. Only one mode will be active at any given time. Science and Alignment modesutilize high rate data link (HRDL) on JEM-EF. Other modes transmit data via 1553 interface onJEM-EF. Mode 1 (Off)o CATS is off. No power to instrument or heaters, cover door closed.Mode 2 (Survival)o Survival heaters powered, cover door closed, and instrument off.Mode 3 (Safe)o Instrument primary power applied at JEM-EF interface. Only DSEM andoperational heaters are functional. Instrument housekeeping telemetry is collectedand transmitted via 1553 interface. Fluid cooling loop is not active. Cover doorclosed.Mode 4 (Standby 1)o Fluid cooling loop is active. Laser 1 OR Laser 2 primary power converter isenabled to allow monitoring of laser housekeeping telemetry. Detectors powered.Cover door closed.Mode 5 (Standby 2)o Fluid cooling loop is active. Cover door open. Laser 1 OR Laser 2 diode driversupply enabled.Mode 6 (Laser Alignment)o Boresight calibration for the various science modes.Mode 7 (Science Mode)o The three primary science modes of the CATS instrument are described in section1.0 and Figure 1.1.Field Of View (FOV), Instantaneous Field Of View (IFOV)The FOV is defined as the angular area of the atmosphere and surface scene viewed by CATS ina given mode. CATS utilizes a telescope with a full 16 mrad FOV, but is configured with four5
different IFOV orientations to accommodate each mode and the mission science goals. TheIFOV of each orientation described below is 115 µrad. LFOV (Left IFOV)o This refers to the FOV oriented 8 mrad to the left off nadir of the X direction ofthe ISS. It is off track, tilted 8 mrad left of nadir.RFOV (Right IFOV)o This refers to the FOV oriented 8 mrad to the right off nadir of the X direction ofthe ISS. It is off track, tilted 8 mrad right of nadir.FFOV (Fore IFOV)o This refers to the FOV oriented 8 mrad forward of the ISS along the X direction.It is along track, but tilted 8 mrad forward from nadir.AFOV (Aft IFOV)o This refers to the FOV oriented 8 mrad aft of the ISS along the X direction. It isalong track, but tilted 8 mrad aft from nadir.Range BinRefers to the vertical resolution of the raw data and corresponding data frame, e.g. 60 m. Rangebin resolution is synonymous with “vertical resolution” of the CATS data.Profile, RecordA collection of range bins stacked vertically beginning at the height defined by Top Bin Altitude(see below) and continuing for a distance defined by the Data Frame. A profile refers to oneinstance of data collection at time X that is stored in the raw data file (and eventual Level 0 file).The phrase record refers to the header and the 12 channels of profile data corresponding to timeX and current mode of operation. The record/profile temporal intervals are determined by thetemporal resolution (0.05 secs), and the granule defines the number of profiles in a data file.Number Shots SummedRefers to the number of laser shot profiles summed to produce a single profile/record with atemporal resolution of 0.05 secs. Since the CATS lasers are high rep-rate, they actually measurea profile at 5000 Hz (laser 1) or 4000 Hz (laser 2). However due to data size constraints, theseraw profiles cannot be archived aboard the ISS and transmitted to the CATS work station atGSFC. Thus 250 of these raw profiles in mode 7.1 are summed together to produce a singleprofile with a temporal resolution of 0.05 secs that is reported in the CATS data products. Formodes 7.2 and 7.3, 200 profiles are summed together.Data FrameRefers to a two-dimensional array defining the along track and vertical resolution and extent ofthe data contained within each data file/packet. The data frame is set from 28 km to – 2 km aslwith 60 m range bins (vertical), and half an orbit with 0.05 sec along track temporal resolution(the latter would correspond to a 350 m horizontal resolution along track). The data frame isdetermined by the repetition frequency of the laser and the ISS altitude and the need to avoidpulse overlap within the atmospheric volume of interest (see discussion of this in section 1.0).The data frame is fixed at 30 km vertical for the CATS mission.6
Top Bin AltitudeRefers to the altitude (ASL) at which the CATS data begins (e.g. 28 km) for a specificprofile. This is derived using the onboard timing calculations required to adjust forchanges in the ISS position above the earth’s surface. NOTE: The bottom of the dataframe is fixed at -2 km.GranuleLevel 0 files are partitioned into either day or night “granule” files based on the z-component ofthe solar line-of-sight unit vector reported in the ISS Broadcast Ancillary Data (BAD) and thesolar background counts for the given profile. A new granule file is produced when both criteriaagree for a given profile and these granules are then labeled correspondingly as either a “day”file or “night” file. It should be noted that there are occasions when the 6-hour sorting window isnot large enough to fill in the data gaps caused by out-of-sequence data. In this scenario, twogranules may be produced, with 4.5 minutes between the start and end times of the granules,instead of one larger granule. For more details on the process of creating a granule, please see theCATS ATBD document.ChannelRefers to a profile of photon counts contained in the raw data with dimensions defined by therange bin and temporal resolution. Different modes will utilize a different number of channels.Thus the term channel is meaningful only when categorized: e.g. Mode 7.1, Parallel 1064nmdescribes one channel of data in the raw data file. Table 1.1 below shows the science modes (7.1– 7.3) and how they are related to the various CATS detector channels. For mode 7.1, 12channels of data are acquired across both IFOV orientations (channels 1 – 12). In mode 7.2(HSRL mode), 12 channels of data are acquired (channels 13 – 24), 10 of which are used for theHSRL measurement. In mode 7.3, laser 2 is used in 3 wavelength mode (3WL) to acquire 8channels of data (channels 25 – 31). Note also that some of the atmospheric measurements (forinstance the 532 parallel and perpendicular for mode 7.1 and 7.3) acquire 2 channels of data.This is because the return signal is split and sent to two separate SPCM detectors as a way toincrease the dynamic range. While multiple channels may be acquired for a given atmosphericmeasurement, it is actually the same measurement: those channels will be summed during theCAPS data processing (for modes 7.1 and 7.3).Table 1.1. The Science Modes and corresponding detector channel numbers for the listed CATSatmospheric measurement. Note total number of available channels is 32 and each channelrepresents a complete profile of data.ModeDescription106410645325323557.1Laser 1 RFOV (Multi-beam)125,63,4--7.1Laser 1 LFOV (Multi-beam)7811,129,10--7.2Laser 2 FFOV (HSRL)232413-22----7.3Laser 2 AFOV (355 nm)252627,28 29,3031ǁperpǁperptotVersionRefers to the major release of Level 1, and 2 data products. Version releases will occursporadically during the mission based on offline development efforts addressing bugs and7
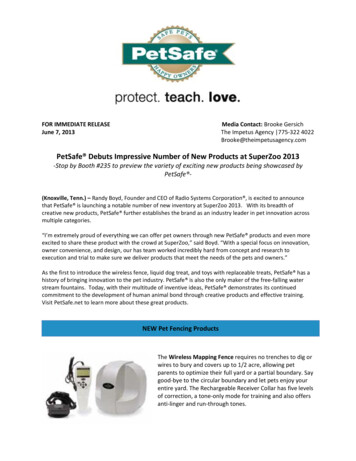
improvements to code/algorithms, and also significant changes to ancillary data. A versionrelease will occur when a significant number of development changes have occurred, and/orother programmatic decisions. The term version may also refer to instance of a particularprogram/algorithm in the CAPS code library. Thus, the format for CATS version numbers is:X.YY, where X refers to the product version release and X.YY is used to identifyprogram/algorithm versions (YY describes the program instance and X identifies which majorversion release it belongs to). Example: a program identified as V1.05 would be the 5 instanceof the program (program version), and it would be part of CATS major release 1. Level 1, 2 and3 data files will only use the X value.th1.2 CATS Raw Data DescriptionThis section describes the content and format of the raw science data. This section does notaddress the format of any added CCSDS headers or formatting occurring onboard the ISS orPOIC. It is expected that all the information required to process CATS science data are containedwithin the raw science data and not other CCSDS headers (which are considered of use to theISS project only). The raw science data include a series of records at time intervals set by theDFHR. Each record contains a header followed by 12 channels of data measured by CATS at thetime/position provided in the header. The header contains additional housekeeping informationrequired for CATS processing. Each channel of data includes photon counts for each range binfor the entire data frame. Detector channels are defined in section 1.1.1.3 CATS Data Management StructureThe CATS Automated Processing System (CAPS) converts the CATS instrument data intoscientific data products. A high-level view of the CAPS structure is illustrated in the Top LevelData Flow Diagram shown in Figure 1.3. The data flow diagram depicts the relationship betweenthe data products and the subsystems that produce them. Circles in the diagram representalgorithm processes called subsystems. Subsystems are a logical collection of algorithms, whichtogether convert input data products into output data products. Boxes with arrows entering acircle are input data sources for the subsystem, while boxes with arrows exiting the circles areoutput data products.8
Figure 1.3 CATS Top Level Data Flow DiagramThe CATS data product naming convention is defined as:[Investigation] [Level] [Day-NightID] [Version] sionInstance Mission Name (CATS-ISS) Product Level, e.g., L0, L1A, L1B, L2O, Product Identification, [D or N] VX-YY [e.g. V1-00] YYYY-MM-DDThh-mm-ssThh-mm-ssUTCAn example of this naming convention is:CATS-ISS L1B D-M7.1-V2-04.2015-02-28T22-36-40T23-24-25UTC.hdf59
2.0 Archival Data ProductsThis section describes the CATS data products, which are permanently archived at the GSFCCAPS. Each data product is a single file in HDF format. Each subsection contains a briefoverview of the purpose and content of the data product followed by one or more tables listingevery parameter contained in the product. The following data attributes are described in theoverview sections: Level – Data product levels are defined using EOS definitionsType – Data type (Science Archival, Level 0, Ancillary, or Engineering)Frequency – How often the product is received or producedTime interval Coveredo File – Time period covered within this fileSpatial resolutiono Record – Vertical and horizontal coverageFile Name(s) – The name of the data product (Listed with Production Strategy, Version,and1Additional tables contain the following attributes for each parameter: Parameter Name – Name of parameterData Type – Data type definition of the parameter valueUnits – Units of the parameter valueRange – Range of values for the parameter (Note: For many parameters, “Range”indicates the nominal range physically meaningful values. Some small fraction of valuesmay fall outside this range due to noise. Check the associated Uncertainty and QAparameters for guidance on data quality.)Elements/Record – elements per record for this parameterTotal file sizes also are provided.2.1 Lidar Level 1A Data ProductThe CATS Level 1A data is referred to as the Normalized Relative Backscatter (NRB) and is aninternal product only that is not distributed. The NRB data is Level 0 data that is geolocated,corrected for detector nonlinearity and the folding of molecular signal from the atmosphereabove, normalized to laser energy, and annotated with ancillary information. The ancillaryinformation included in the NRB data is the Broadcast Ancillary Data (BAD) from the ISS thatdescribes the environment in which a payload is operating. The BAD is sent at a rate of 10 Hzand includes the roll, pitch and yaw of the ISS, the quaternion, and the CTRS positioninformation. Since the CATS laser points off-nadir 0.5 degrees in any of the three science modes,10
and has multiple beams in Mode 7.1, the geolocation of the CATS laser beam is computed foreach FOV using the BAD and the CATS relative angles. More information on the algorithm todetermine the geolocation of each CATS FOV is provided in section 3.1.1. Once the data is geolocated, the raw photon counts are corrected for detector nonlinearity. The solar backgroundphoton counts is estimated by averaging the signal below the earth’s surface. All the productsreported in the CATS L1A data products are used as input to the CATS L1B data products. Inthe following table the L1A parameters are listed for all modes of operation.ParameterCreate DateL1A CreatorNumrecs (N)Operation ModeNumber ChannelsNumber Bins (M)Bin Wid KmHori Res SecsHori ExtentVert ExtentLaser Rep RateLaser AnglesUTC DATEUTC TIMEAltitude ISSLatitude ISSLongitude ISSLatitude FOVLongitude FOVRecord NumberDay Night FlagSurface TypeSurface ElevationHeight Top Bin (km)Laser EnergiesLaser Energy VariancesLaser Qflag355Laser Qflag532Laser Qflag1064NRB Perpendicular 532NRB Parallel 532NRB Perpendicular 1064NRB Parallel 1064NRB Total 355Background Perpendicular 532Background Parallel 532Background Variance Perpendicular 532Unitskms# shotskmShot s-1degkmdegdegdegdegIGBPmkmJPhotonPhotonPhotonType Dimen HDF tFloatFloatULongByteByteInt2Float4NNFile Creation DateFile CreatorNumber RecordsOperation ModeNumber ChannelsNumber BinsBin WidthHorizontal ResolutionNumber ShotsVertical ExtentLaser Rep RateLaser AnglesUTC DATE (yyyymmdd)UTC Time, fraction of N2,NNISS AltitudeISS LatitudeISS LongitudeFootprint LatitudeFootprint LongitudeRecord NumberAllAllAllAllAllAllNN2,N2,NDay Night FlagSurface TypeSurface ElevationHeight of Top Bin (0,*) is Left FOV, (1,*)RFOV for Mode 7.1 (0,*) for other modesLaser EnergiesLaser Energy VariancesLaser Energy Quality 355Laser Energy Quality 532Laser Energy Quality 1064NRB Perpendicular 532NRB Parallel 532NRB Perpendicular 1064NRB Parallel 1064NRB Total 355Background Perpendicular 532Background Parallel 532Background Variance Perpendicular ll2AllAll7.3AllAllAll
Background Variance Parallel 532Background Perpendicular 1064Background Parallel 1064Background Variance Parallel 1064Background Variance Perpendicular 1064Background Total 355Background Variance 355Saturated Bins355Saturated Bins532Saturated Bins1064Dead Time Correction ProfileHSRL Raw CountsHSRL BackgroundsCommanded Etalon GapActual Etalon GapCommanded Etalon CapacitanceActual Etalon CapacitanceCTRS PositionCTRS VelocityCTRS Position QualityCTRS Position TimePhotonFloat2#,NBackground Variance Parallel NBackground Perpendicular 1064Background Parallel 1064Background Variance Parallel 1064AllAllAllPhotonFloat2#,NBackground Variance Perpendicular NNBackground Total 355Background Variance 355Saturated Bins 355 (50 max)Saturated Bins 532 (50 max)Saturated Bins 1064 (50 max)Dead Time Correction ProfileHSRL Raw CountsHSRL Background CountsCommanded Etalon GapActual Etalon GapCommanded Etalon CapacitanceActual Etalon CapacitanceCTRS Position XYZCTRS Velocity XYZCTRS Position QualityCTRS Position Coarse llAll4,N7,N12,NNQuaternion DataBoresite Motor Step DataScience Data Error FlagSPCM Enable FlagsAllAllAllAllNNNNNNNR3,NCATS Fore FOV AngleCATS Aft FOV AngleCATS Right FOV AngleCATS Left FOV AngleISS Yaw AngleISS Pitch AngleISS Roll AngleAttenuated Molecular enuated Molecular Backscatter1064AllphotonphotonQuaternion DataBoresite Steps MotorScience Data Error FlagSPCM Enable FlagsFOV Angle ForeFOV Angle AftFOV Angle RightFOV Angle LeftYaw ISSPitch ISSRoll ISSAttenuated Molecular Backscatter532Attenuated Molecular Backscatter1064Km-1sr-1*Maxbins (M) can vary (500 for 60 m bins: default value)The 2 dimension is for Left and Right FOVs (Mode 7.1 only)1In mode 7.2, the NRB Perpendicular 532 array is all zeroes2In mode 7.2 the 10 HSRL channels are summed and stored in the
Acronyms _ ASL, AMSL Above Mean Sea Level CAPS CATS Automated Processing System . GSFC Goddard Space Flight Center HDF Hierarchical Data Format HSRL High Spectral Resolution Lidar ISS International Space Station L0 Level 0 (e.g. data) L1 Level 1 (e.g. data) L2 Level 2 (e.g. data) L3 Level 3 (e.g. data) MSFC Marshall Space Flight Center .