Transcription
Getting Started with HLM 5For WindowsUpdated: August 2012
Getting Started with HLM 5Table of ContentsSection 1: Overview . 31.1 About this Document . 31.2 Introduction to HLM . 31.3 Accessing HLM . 31.4 Getting Help with HLM . 3Section 2: Accessing Data in HLM. 42.1 File Format Requirements. 42.2 Creating the SSM File for HLM . 6Section 3: Introduction to Hierarchical Linear Models. 93.1 Levels of a Model . 93.2 Fixed and Random Effects . 103.3 Assumptions and Determining Sample Size . 11Section 4: Two-Level Models . 124.1 Level-1 Model. 124.2 Level-2 Model. 144.3 Output . 15Section 5: Examples of Two-Level Models . 205.1 Random Coefficients . 205.2 Intercept-as-Outcome Models . 225.3 Slopes-as-Outcomes Models . 245.4 Random Slopes and Intercepts . 26Section 6: The Hierarchical Generalized Linear Model . 286.1 Theoretical Background . 286.2 A Hierarchical Generalized Linear Model . 29References . 342The Department of Statistics and Data Sciences, The University of Texas at Austin
Getting Started with HLM 5Section 1: Overview1.1 About this DocumentThis document is designed to introduce you to the HLM 5 for Windows software. In order tomake use of this document, you should have a background in regression. A background inhierarchical or multilevel models is useful, but not necessary for understanding materials in thisdocument. While the primary use of the document is to familiarize you with the use of thesoftware, topics in hierarchical modeling are discussed in enough detail that you should be ableto implement the techniques described here in your own data analyses.This document makes use of some sample datasets that are available with the software, oravailable on the University of Texas Microsoft Windows terminal server. The primary datasetsare contained in the Examples directory in the HLM 5 directory.1.2 Introduction to HLMHLM stands for hierarchical linear models, which are a type of model used for analyzing data ina clustered or nested structure. An example of such data is students who are nested withinclassrooms, which are nested within schools; in this situation, we would expect that studentswithin a cluster, such as a classroom or school, would share some similarities due to theircommon environment. Hierarchical linear models are also known as multilevel models, randomcoefficient models, or random effects models. HLM can be used to analyze a variety of questionswith either categorical or continuous dependent variables.1.3 Accessing HLMYou may access HLM in one of three ways:1. License a copy from Scientific Software International for your own personal computer.2. Download the free student version of HLM from Scientific Software International foryour own personal computer. If your models are small, the free demonstration versionmay be sufficient to meet your needs. For larger models, you will need to purchase yourown copy of HLM or access the ITS shared copy of the software through the campusnetwork. The latter option is typically more cost effective, particularly if you decide toaccess the other software programs available on the server (e.g., SAS, SPSS, AMOS,etc.).1.4 Getting Help with HLMIf you are a member of UT-Austin, you can schedule an appointment with a statistical consultantor send e-mail to stat.consulting@austin.utexas.edu . See stat.utexas.edu/consulting/ for moredetails about consulting services, as well as answers to frequently asked questions abouthierarchical models, multilevel models, HLM and other topics. Non-UT and UT HLM users willfind the HLM site to be a useful resource.3The Department of Statistics and Data Sciences, The University of Texas at Austin
Getting Started with HLM 5Section 2: Accessing Data in HLM2.1 File Format RequirementsThere are two methods for entering data into HLM: (1) importing ASCII data, or (2) importingfiles from one of the following statistical software packages: SAS, SPSS, or SYSTAT. Thepresent example assumes that your data are saved in an SPSS format. If this not the case, you canconsult our tutorial “SPSS for Windows: Getting Started” to convert your ASCII or Exceldocument into an SPSS format.The first step to getting started with HLM is to create a SSM (sufficient statistics matrix) file,which is the file format that the HLM software uses. To create a file that can be used in HLM,you will first need a file for each level of your model. In the present example, a two-level modelis illustrated and consequently, level-1 and level-2 datasets are needed. A level-1 model, as thename suggests, contains data on level-1 units whereas level-2 models contain information onlevel-2 units. The level-1 units are typically subject-level units, such as individual students. Thelevel-2 units are typically units in which the level-1 units are nested, such as schools. If you haveentered your data into SPSS or another statistical software package and were not originallyanticipating using HLM, your data are likely to not be in these two separate files, so you willneed to create these two separate files from your original file. In addition, there are somerequirements that need to be met in order to use these files in HLM: Level-1 units should be grouped together by the ID of their level-2 unit's ID. ID variables should be in a string format. ID variables must not exceed 12 characters. ID variables should all be the same length. For example, if you had ID's between 1 and20,000, you should format the value 1 as 00001 so that it is the same length as the largestID value.As your data are not likely to meet the above requirements, you will probably need to make somemodifications to your data. These modifications can be done using a variety of statisticalsoftware packages. While you should use the package with which you are most familiar, a fewbrief suggestions are offered here for using SPSS to prepare your data. If you are using SAS orSYSTAT, the instructions below should provide some guidelines for general considerations forimporting data using these file formats.If your data are in a multivariate format, you will need to transform that data into a univariateformat. A multivariate format is a data structure where there is more than one dependent variableper unit in the rows of your dataset. For example, if you had a dataset on married couples whereyou had a single row for each couple that contained each member of the couple's maritalsatisfaction score, this would be a multivariate format, as there is more than one dependentvariable per row. In this situation, you would want to modify the dataset so that there is only asingle dependent variable per row, which would mean that each member of the couple's scorewould be in a separate row. For an example of how to transform your data into a univariateformat, see SPSS FAQ: Converting SPSS multivariate repeated measures data to univariate4The Department of Statistics and Data Sciences, The University of Texas at Austin
Getting Started with HLM 5format.The next step is to sort your data on the basis of their level-2 ID. For instructions on how to dothis, see the Sorting Cases section of our “SPSS for Windows: Getting Started” document. Next,you will need to convert your ID variables to a string format. There are general instructions onhow to change the format of a variable in Creating and Defining Data section of the abovementioned document. That document illustrates the use of the Variable Type dialog box; tochange the variable format, select the String option in the dialog box shown in that section of thedocument. If your ID variables are not all the same length, the next requirement is to make all ofthem the same length by placing leading zeros on values that are less that maximum length. Thefollowing SPSS syntax can be modified to perform this operation (if you have any questionsabout how to execute SPSS syntax, examine the Syntax section of the "SPSS for Windows: DataManipulation and Advanced Topics" document):IF (LENGTH(RTRIM(sch id)) 3) sch id LPAD(RTRIM(sch id),3,'0') .EXECUTE .The code above is designed to make all ID variables three characters in length. By understandingthis example, you can make your ID variable any length that you like. The first step to modifyingthe above syntax is to replace all instances of the example variable, sch id, with the name ofyour SPSS variable. The first part of the IF statement, IF (LENGTH(RTRIM(sch id)) 3),evaluates the length of the variable with trailing spaces deleted. There are two functions used inthis statement: the LENGTH and the RTRIM functions. The RTRIM function removes anytrailing space characters from the variable values. This is important because although a variablemay only have one digit, if the maximum length of the variable is three, there will be twoadditional spaces following the character, making it three characters long although it may appearto be only one character in length. The other function used in the IF statement is the LENGTHfunction, which returns the number of characters of the variable (in the present example it is thenumber of characters stripped of trailing spaces). When the condition in the IF statement is true,the second part of the statement is executed. For example, when the value of sch id is 12, whichis less than three characters in length, the condition in the first line is true because the value 12,is 2 characters in length; thus, the second part of the statement is executed. The second part ofthe statement, sch id LPAD(RTRIM(sch id),3,'0'), uses the LPAD function to concatenatezeros on the sch id variable which is again striped of any trailing blank with the RTRIMfunction. The LPAD function has three arguments: (1) the variable name, which, in this case isthe sch id, is stripped of trailing spaces, (2) the length of the new variable which should be themaximum length of the ID variable, and (3) the character that is to be concatenated to the IDvariable, which is a single zero in this example.After you have created your ID variable, the next step is to create a new file for each of the levelsin your analysis. You can use your complete data file as it is for the level-1 dataset, but will needto aggregate data for higher levels of the model. This can be done with the AGGREGATEprocedure in SPSS that is documented under the heading, Aggregating Data in the "SPSS forWindows: Data Manipulation and Advanced Topics" document. There are two types of variablesdescribed in this document: break and aggregate variables. The break variable(s) is the variablethat identifies the unit of analysis for that level of the model. For example, if your second-levelID variable is for schools, then this is your break variable. The aggregate variables(s) are anyother variables that you wish to include in your file in a summarized form. For example, if one ofyour variables is the socioeconomic status of students, you may wish to create an aggregated5The Department of Statistics and Data Sciences, The University of Texas at Austin
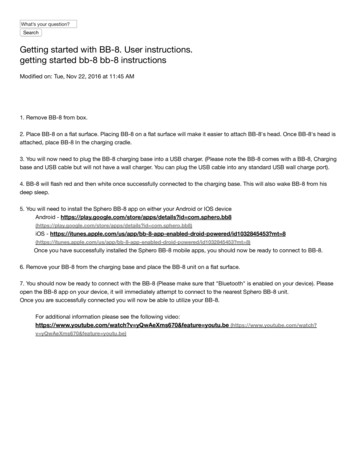
Getting Started with HLM 5version of this variable that is the average socioeconomic status for each school.2.2 Creating the SSM File for HLMTo create the SSM file, go to the File menu and select the following option:FileSSM.New.Stat package inputDoing so will produce this dialog box:This dialog box gives you the option of creating one of the four file types that can be used inHLM. Each of the four file types is associated with a model type: (1) HLM2 is a two-levelhierarchical linear model, (2) HLM3 is a three-level hierarchical linear model, (3) HMLM is ahierarchical multivariate linear model, and (4) HMLM2 is a multilevel, multivariate linearmodel. The present example uses a two-level model, and thus, the HLM2 option is theappropriate choice. After selecting this option, click OK to produce the following dialog box:6The Department of Statistics and Data Sciences, The University of Texas at Austin
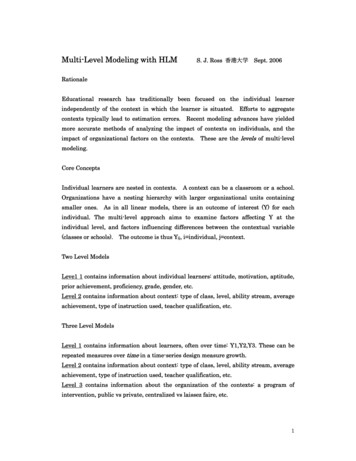
Getting Started with HLM 5The present example creates an SSM file out of two SPSS files that are available with the HLMsoftware. The level-1 file is HSB1.SAV and the level-2 file is HSB2.SAV. Both are located in theChapter2 subdirectory in the Examples subdirectory of the HLM5 directory. The first step forimporting files is to specify your level-1 and level-2 datasets. HLM can construct an SSM fileout of first and second level datasets that are stored in one of several file formats, includingSPSS, SYSTAT, and SAS 5 transport files, in addition to ASCII files. Start by selecting the filetype of the files you are importing in the Input File Type box. After you have specified the filetype, click the Browse button in the section labeled Level-1 Specification and select your level-1dataset. Next, repeat this for the level-2 dataset by clicking the Browse button in the Level-2Specification section.After you have specified your datasets, you need to identify the variables that will be included inyour SSM file. Click Choose Variables, which will produce the following dialog box:7The Department of Statistics and Data Sciences, The University of Texas at Austin
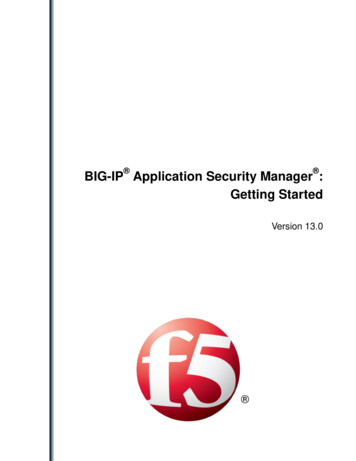
Getting Started with HLM 5The two columns of check boxes next to the variable names are used to select the variables youwish to include in your SSM file. Only one ID variable should be specified. The ID variable isused to match units in the level-1 file with their level-2 units. In the above example, the variableID is the ID of the school rather than the ID for individual students. The school ID is the unit ofanalysis for the second level, and is used to link students with a particular school. After selectingthe appropriate ID variable, choose any other variables that you wish to include in your SSM fileby clicking the in SSM box to the right of the variable name. The same process is repeated for thelevel-2 model.To complete the process, you need to create a response file, which is a file that contains theinformation you have entered in the dialog boxes to create the SSM file. Create the response fileby clicking on the Save Response File button and assigning the file a name. You also need toassign a name to the SSM file by typing its name in the SSM File Name box. To verify that yourSSM file contains the data you intended it to contain, click Check Stats. This will open a textfile that contains statistics for the variables you have included in your SSM file. Finally, clickMake SSM to create the SSM file. You can click Done to begin data analysis using HLM(although you will first be warned to check the .STS file which can be done by clicking CheckStats, and you will have to click Done a second time before you enter the HLM analysisenvironment).8The Department of Statistics and Data Sciences, The University of Texas at Austin
Getting Started with HLM 5Section 3: Introduction to Hierarchical Linear Models3.1 Levels of a ModelHierarchical linear models derive their name because they are designed to analyze data in whichlower level units of analysis are nested in higher-level units of analysis. For example, studentsare nested within classrooms, which are nested within schools. While experimenters are often notinterested in the effects of a particular classroom or school when they are examining the effectsof a classroom intervention, these units potentially have an effect on the outcome of the studythat should be accounted for in a statistical model. While designed experiments cancounterbalance to control for the effect of variables in which the experimenter is not interested, itis not possible to counterbalance in studies conducted in naturalistic settings. For example, it isnot possible to have one classroom situated within one school for half of the experiment andwithin the other school for the other half of the experiment; thus, the effect of a particularclassroom cannot be counterbalanced. Hierarchical linear models are useful in these situationswhere the traditional experimental design cannot be used in its most ideal form.Although it may be apparent why one would be concerned with the effects of variables such asclassrooms and schools, it is likely not apparent why a special type of model is necessary. Whynot just control for these variables by including them as predictors in a regression equation? Onthe surface, entering variables such as classroom and school in a regression equation appears tobe a good solution: by entering these variables, a model can be constructed in which only theunique effect attributable to the classroom intervention is being measured. However, the keydeficiency with this approach is that every student is nested within a particular classroom andeach classroom is nested within a particular school, a situation that cannot be modeled withstandard regression techniques. By treating students as independent, differences between schoolscan potentially be obscured. For example, the relationship between family income and gradesmay be different in public schools, where a wider range of socioeconomics is represented, ascompared to private schools where all students are likely to minimally be of a fairly affluentsocioeconomic status. In contrast to regression models, multilevel
consult our tutorial “SPSS for Windows: Getting Started” to convert your ASCII or Excel document into an SPSS format. The first step to getting started with HLM is to create a SSM (sufficient statistics matrix) file, which is the file format that the HLM