Transcription
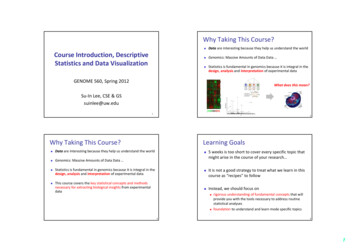
Why Taking This Course?Course Introduction, DescriptiveStatistics and Data Visualization Data are interesting because they help us understand the world Genomics: Massive Amounts of Data Data Statistics is fundamental in genomics because it is integral in thedesign, analysis and interpretation of experimental dataGENOME 560, Spring 2012What does this mean?Su‐In Lee, CSE & GSsuinlee@uw.edu12Why Taking This Course? Data are interesting because they help us understand the world Genomics: Massive Amounts of Data Data Statistics is fundamental in genomics because it is integral in thedesign, analysis and interpretation of experimental data This course covers the key statistical concepts and methodsnecessary for extracting biological insights from experimentaldataLearning Goals 5 weeks is too short to cover every specific topic thatmight arise in the course of your research It is not a good strategy to treat what we learn in thiscourse as “recipes” to follow Instead, we should focus on 3rigorous understanding of fundamental concepts that willprovide you with the tools necessary to address routinestatistical analysesfoundation to understand and learn mode specific topics41
Course Schedule Books and ResourcesSyllabus: DateTopicMay 1Descriptive Statistics and Data VisualizationMay 3Random Variables and Probability TheoriesMay 8Probability DistributionsMay 10Parameter EstimationMay 15Regression MethodsMay 17Hypothesis testing I – t‐test, confidence intervalMay 22Hypothesis testing II – ANOVAMay 24Hypothesis testing III – Analysis of Categorical DataMay 29Bootstrapping, cross validation and permutation testsMay 31Assessing significance in high dimensional experimentsCourse website No required text Good on‐line resources Special topics that may be discussed in class include Bayesian networks,Expectation Maximization (EM) algorithm, principal component analysishttp://www.math.wm.edu/ du/ stark/SticiGui/Text/toc.htmSome good books if you ever have some extra : 60/ Probability and Statistics for Engineering and the Scientists 6th Ed. Jay L.Devore (2004). Duxbury press, Thompson‐Brooks/Cole.Statistical Inference. Casella, G. and Berger, R. L. (1990). Wadsworth,Belmont, CA.Probabilistic Graphical Models: Principles and Techniques. Koller, D. andFriedman, N. (2009). MIT Press.Grading: 5 problem sets (20% each)5Class Meetings What is R?Class meets twice a week 6 The R statistical programming language is a free opensource package based on the S language developed by BellLabs May statistical functions are already built inTue/Thu 9‐10:20am @ Foege S110Each class will last for 80 minutes and be primarilylecture based Other forms of learning and interactions will beincluded Contributed packages expand the functionality to cuttingedge research We will often interrupt lectures to work on problems insmall groups as well as work through statistical analysesusing R (please bring a laptop with R installed!) Amazing graphics Widely used in genetics, genomics, computational biology782
R Resources Windows, Mac and Linux binaries available athttp://www.r‐project.orgLecture 1: Descriptive Statisticsand Data VisualizationExtensive resources at the above web‐site, inparticular 09OutlineWhy Descriptive/Graphical Summary? What is descriptive statistics and exploratory dataanalysis? Before making inferences from data, it is essential toexamine all your variables Basic numeral summaries of data Why? Basic graphical summaries of data To listen to the data: Basic operations in R (If time permits) How to use R for calculatingdescriptive statistics and making graphs 11to catch mistakesto see patterns in the datato find violations of statistical assumptionsto generate hypotheses and because if you don’t, you will have trouble later123
Types of Data Categorical Dimensionality of Data SetsBinary: 2 categoriesNominal: more categoriesOrdinal: order mattersE.g. gender, ethnicity, disease state, genotypes, etcContinuous (or Quantitative) Numeric values that can be ordered sequentially, and thatdo not naturally fall into discrete ranges.E.g. weight, number of seconds it takes to perform a task,gene expression levels, etc Univariate: Measurement made on one variable persubject Bivariate: Measurement made on two variables persubject Multivariate: Measurement made on many variablesper subject13Numerical Summaries of Data Central tendency measures. They are computed togive a “center” around which the measurements inthe data are distributed. Variation or variability measures. They describe“data spread” or how far away the measurements arefrom the center. Relative standing measures. They describe therelative position of specific measurements in the data14Central Tendency Measures: Mean 15To calculate the mean of a set of observations, addtheir value and divide by the number of observations:164
Central Tendency Measures: Median Median: the exact middle value Calculation: Which Measure Is Best?If there are an odd number of observations, find the middlevalueIf there are an even number of observations, find themiddle two values and average them Mean is best for symmetric distributions withoutoutliers Median is useful for skewed distributions or data withoutliersExample:Some data:Age of participants: 17 19 21 22 23 23 23 38Median (22 23)/2 22.517Scale: Variance 18Why Squared Deviations?Average of squared deviation of values from themean Squares eliminate the negativesAbsolute values do not have nice mathematicalproperties Result: 19Increasing contribution to the variance as you go fartherfrom the mean205
Why Divide By (n‐1), not n ?Why Divide By (n‐1), not n ?True meanTrue meanEmpirical mean Empirical meanYou compute the difference between each observation andthe mean of all n observations.You don’t know the true mean of the population; all youknow is the mean of your samples (empirical mean)Except for the rare cases where the sample mean happensto equal the population mean, the data will be closer to thesample mean than it will be to the true population mean.So the numerator will probably be a bit smaller (and can’t belarger) than what it would be if you used the true mean.Biased estimator of the population varianceVariance is somewhat arbitrary What does it mean to have a variance of 10.8? Or 2.2?Or 1459.092? Or 0.000001? Nothing. But if you could “standardize” that value,you could talk about any variance (i.e. deviation) inequivalent terms Standard deviations are simply the square root of thevariance To make up for this divide by (n‐1) rather than n.Unbiased estimator of the population varianceIf you knew the sample mean, and all but one of thevalues, you could calculate what that last value must be.Statisticians say there are n‐1 degrees of freedom.21Scale: Standard Deviation 22Scale: Standard Deviation 23Most commonly used measure of variationShows variation about the meanHas the same units as the original data246
Interesting Theoretical Result Often We Can Do BetterRegardless of how the data are distributed, a certainpercentage of values must fall within k standarddeviations from the mean For many lists of observations, especially if theirhistogram is bell‐shaped Roughly 68% of the observations in the list lie within 1 σ(standard deviation) of the average95% of the observations lie within 2σ of the average25Scale: Quartiles and IQR26Percentiles (aka Quantiles) The first quartile, Q1, is the value for which 25% of theobservations are smaller and 75% are larger Q2 is the same as the median (50% are smaller, 50%are larger) In general the nth percentile is a value such that n% ofthe observations fall at or below of itQ1 25th percentileMedian 50th percentileQ2 75th percentileOnly 25% of the observations are greater than the Q327287
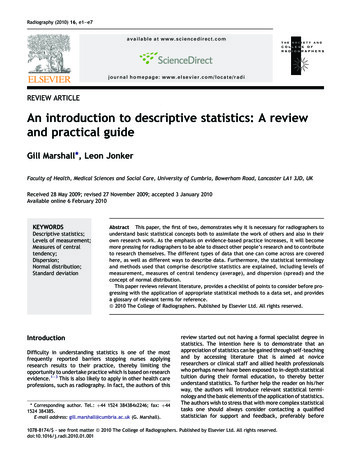
Graphical Summaries of Data Univariate Data Histograms and bar plots What is the difference between a histogram and bar plot?Dimensionality of data matters Univariate: Measurement made on one variable per subject Multivariate: Measurement made on many variables persubjectBar plot: Used for categorical variables to show frequency or proportion ineach categoryTranslate the data from frequency tables into a pictorialpresentation Histogram: Used to visualize distribution (shape, center, range, variation) ofcontinuous variables“Bin size” is important29Effect of Bin Size on Histogram 30More on HistogramsSimulated 1,000 N(0,1) and 500 N(1,1) 31What’s the difference between a frequency histogramand a density histogram?328
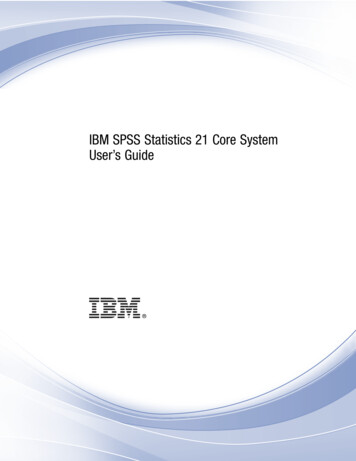
Box PlotsMultivariate Data Clustering Organize variables into clustersDescriptive, not inferentialMany approaches“Clusters” always producedData reduction approaches Reduce n‐dimensional dataset into much smaller numberFinds a new (smaller) set of variables that retains most ofthe information in the total sampleEffective way to visualize multivariate data33How to Make a Bad Graph Example 1The aim of good data graphics: 34Display data accurately and clearlySome rules for displaying data badly: Display as little information as possibleObscure what you do show (with chart junk)Use pseudo‐3d and color gratuitouslyMake a pie chart (preferably in color and 3d)Use a poorly chosen scale35369
Example 2Example 337Example 438Goals of Our R Tutorial Today39 Installing R Using R as a fancy calculator Data structures: scalars, vectors, data frames, matrices Reading in data from a file Subsetting and extracting data Writing and executing simple R scripts4010
Probabilities Event Variable XXP(S)P(S) P(S)log logProbabilities Probabilities of mutually independent events are summedPr(a die comes up 2 or 3) ProbabilityStatistical independence Joint probability Pr(comes up 2) Pr(comes up 3) 1/ 6 1/ 6 1/ 3 Probabilities of independent events are multiplied to getthe joint probabilityPr(one die comes up 2 and the other one comes up 3) Pr(first one comes up 2) Pr(second one comes up 3) 1/ 6 1/ 6 1/ 3 Conditional probabilities are the joint probability dividedby the probability of the event that they are conditionedon:P(D S) P(D S )P( S) d 4142Goals of Our R Tutorial TodayP ( D S ) P ( D S , ) P ( S ) d 43 Installing R Using R as a fancy calculator Data structures: scalars, vectors, data frames, matrices Reading in data from a file Subsetting and extracting data Writing and executing simple R scripts4411
Some Jargon Units: the basic objects on which the experiment isdone Variable: a measured characteristic of a unit Treatment: any specific experimental conditionapplied to the units. A treatment can be acombination of specific values (called levels) of eachexperimental factor4512
2 Course Schedule Syllabus: Special topics that may be discussed in class include Belmont,Bayesian networks, Expectation Maximization (EM) algorithm, principal component analys