Transcription
Radiography (2010) 16, e1ee7available at www.sciencedirect.comjournal homepage: www.elsevier.com/locate/radiREVIEW ARTICLEAn introduction to descriptive statistics: A reviewand practical guideGill Marshall*, Leon JonkerFaculty of Health, Medical Sciences and Social Care, University of Cumbria, Bowerham Road, Lancaster LA1 3JD, UKReceived 28 May 2009; revised 27 November 2009; accepted 3 January 2010Available online 6 February 2010KEYWORDSDescriptive statistics;Levels of measurement;Measures of centraltendency;Dispersion;Normal distribution;Standard deviationAbstract This paper, the first of two, demonstrates why it is necessary for radiographers tounderstand basic statistical concepts both to assimilate the work of others and also in theirown research work. As the emphasis on evidence-based practice increases, it will becomemore pressing for radiographers to be able to dissect other people’s research and to contributeto research themselves. The different types of data that one can come across are coveredhere, as well as different ways to describe data. Furthermore, the statistical terminologyand methods used that comprise descriptive statistics are explained, including levels ofmeasurement, measures of central tendency (average), and dispersion (spread) and theconcept of normal distribution.This paper reviews relevant literature, provides a checklist of points to consider before progressing with the application of appropriate statistical methods to a data set, and providesa glossary of relevant terms for reference.ª 2010 The College of Radiographers. Published by Elsevier Ltd. All rights reserved.IntroductionDifficulty in understanding statistics is one of the mostfrequently reported barriers stopping nurses applyingresearch results to their practice, thereby limiting theopportunity to undertake practice which is based on researchevidence.1e3 This is also likely to apply in other health careprofessions, such as radiography. In fact, the authors of this* Corresponding author. Tel.: þ44 1524 384384x2246; fax: þ441524 384385.E-mail address: gill.marshall@cumbria.ac.uk (G. Marshall).review started out not having a formal specialist degree instatistics. The intention here is to demonstrate that anappreciation of statistics can be gained through self-teachingand by accessing literature that is aimed at noviceresearchers or clinical staff and allied health professionalswho perhaps never have been exposed to in-depth statisticaltuition during their formal education, to thereby betterunderstand statistics. To further help the reader on his/herway, the authors will introduce relevant statistical terminology and the basic elements of the application of statistics.The authors wish to stress that with more complex statisticaltasks one should always consider contacting a qualifiedstatistician for support and feedback, preferably before1078-8174/ - see front matter ª 2010 The College of Radiographers. Published by Elsevier Ltd. All rights reserved.doi:10.1016/j.radi.2010.01.001
e2starting data collection to ensure that the data to be gathered is appropriate.Statistics in radiographyThe measurement of parameters in medical care is one ofthe first points for facilitation of quality improvement.4Whilst it is certainly not necessary for radiographers to befull qualified statisticians, a working knowledge of statisticsis desirable in order to be able to assess and understand theimplications of research for radiographers to evolve theirpractice. Furthermore, if a radiographer is undertakinga research project, he/she must be statistically literate tointeract with other researchers and statisticians and in orderto ensure a project has the best methodological designwhich may include selecting appropriate statistical methodology which will test a predetermined hypothesis; moreover, this test should then be undertaken appropriately.1The quality of statistics education provided to studentswhilst they are on a course or taking a degree is reported inthe literature to be inadequate. Furthermore, studentssoon forget what has been taught to them, particularly if itis not applied.5,6 These two scenarios form a barrier to theunderstanding of research articles. Informing someone onhow to read and dissect statistics is found to be mosteffective when the statistical concepts are taught first,before commencing the teaching of ‘‘how to undertake’’the statistics.7 As radiography strives to become anautonomous profession it must ‘‘carve out a knowledgebase that is dynamic and forward thinking’’8 and thisclearly needs cognisance of statistics read by radiographersin articles or applied to their own studies. It is claimed that‘‘today’s medicine is only as good as the research fifteenyears ago’’, showing the considerable time taken betweenthe findings of research being reported and them filteringinto clinical practice.6 Although the aim of evidence-basedpractice is to narrow the theoryepractice gap throughevidence from research informing practice, it appears thatthe research is perhaps sometimes not presented in a waywhich is user-friendly and comprehensible to practitioners,who consequently will not or cannot apply it to their dailypractice.9 It is thus incumbent on researchers to thinkabout their audience, when publishing, so that their resultsare clinically relevant and meaningful.In a study by Welch and Gabbe in 1996, 32% of thearticles were either devoid of statistics or claimed significance in the results without the use of statistics.9 A readerwith only a knowledge of descriptive statistics will onlytypically understand 44.5% of the data in articles, whilstthose with a knowledge of common statistical tests willincrease the access rate of understanding data produced inarticles to 80.5%.9Types of dataStatistics are used to demonstrate the meaning of the data,and are based on numbers, e.g. the patient’s heart rate, orassigned numbers to qualitative attributes such as eyecolour. Statistics can be used descriptively to illustrate thecharacteristics of a group of observations i.e. the raw data;this is called descriptive statistics.10 In statistical terms,G. Marshall, L. Jonkerthere are different levels of measurement for scoringvariables. There are two main categories:- Categorical data- Continuous dataCategorical data can be divided further into four subcategories:- Binary dataIn such instances, only two outcomes or measurementsare possible. For instance, if the patients’ survival isrecorded there can only be two outcomes e survival ordeath. Another example is whether or not a radiologicalreport has been filled in correctly. Such data is usuallysummarised using proportions or odds.- Nominal dataWhilst this is the least robust type of data for categorising data into mutually exclusive categories, withouthierarchical ranking, this is nonetheless a much used andvaluable type of data. An example could be blood groups,i.e. O, A, B, AB, or distinguishing groups of professions e.g.radiographers, radiologists and nurses. Both binary dataand nominal data can be represented or stored by allocating numbers to categories (radiographers Z 1, radiologists Z 2 and nurses Z 3, where the numbers have nonumerical significance).11 With this data the measure ofcentral tendency is the category with the most cases,known as the mode.- Ordinal dataHere the data has a clear order or hierarchy but not ona calibrated scale e.g. strongly agree, agree etc., from a socalled Likert scale with a statement provided.12 Anexample is the level of pain caused by mammography e.g.no pain, mild discomfort, moderate pain, severe pain. Thecategories are mutually exclusive and, as above, thenumeric values attributed to the categories are not absolute measurements but they do order the data. In ordinaldata, the measure of central tendency is called the medianand the category which is the middle of the rank-ordereddescription is thus referred to as the median.Binary, nominal and ordinal scales are considereddiscrete variables because the data is classified intodiscrete non-overlapping variables.13- Interval/ratio dataThis is the strongest type of data, with ratio data beingstronger data than interval data, as ratio data has a truezero value, whilst interval data does not.14 Such data isachieved by the use of a calibrated scale to provide quantitative measurements e.g. density readings from a densitometer, weight in kilograms, or blood pressure. Such datacan be plotted into a histogram. Ratio or interval data maybe summarised by the mean or the median (as a measure ofcentral tendency) depending on the distribution. To
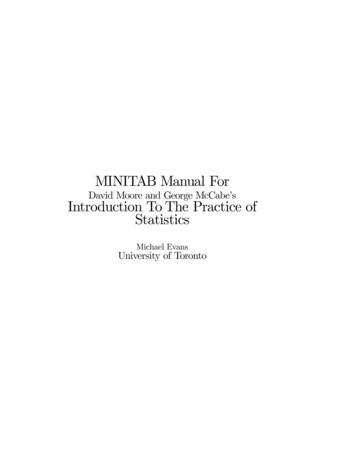
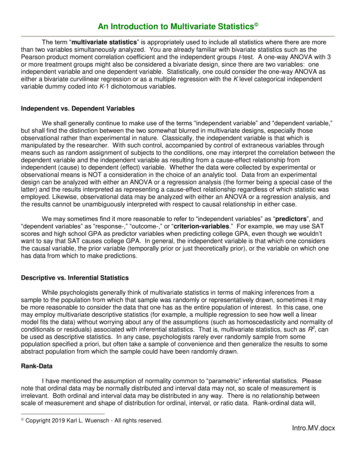
An introduction to descriptive statisticsillustrate the point, an example of interval data would bean IQ test score. Ratios of these measurements cannot beapplied e an IQ of 140 in subject 1 versus 70 in subject 2does not mean subject 1 is twice as clever as subject 2. Onthe other hand, examples of ratio data show that they allhave a constant scale which includes a zero e.g. twohundred metres is twice as long as one hundred metres.Such data can be plotted into a histogram and the midpointof the curve will again be the measure of central tendency.If a variable is normally distributed (i.e. it producesa symmetrical bell curve) the mean, median and the modevalue will be approximately equal. If the researcher is goingon to undertake inferential statistics i.e. tests that allowthe researcher to draw inferences from the data (coveredin a subsequent article) it must be decided whether thedata is normally distributed. If it is then the mean andstandard deviation will suffice as summary statistics. If thedata is not normally distributed then the five order statistics are used i.e. minimum, first quartile, median, thirdquartile and maximum. The range and the inter-quartilerange can easily be derived from these but are not usuallyused explicitly as summary statistics. The outcome oftesting this will determine whether the researcher can useparametric statistics or non-parametric statistics. Forinterval/ratio data from a continuous scale the range,inter-quartile range and standard deviation are used toreport the spread or width of the data. Data from intervalor ratio scales are described as continuous data and thusprovides continuous variables because the data representsan underlying continuum where there are potentially aninfinite number of values.Distribution of dataThis article focuses on the statistical methodology that canbe applied to descriptively define the data. These methodsare numerical procedures or graphical techniques e.g. barcharts, histograms, frequency polygons and pie charts, usedto organise, present and describe the characteristics ofa sample e.g. they provide a summary measures of thecharacteristics. Descriptive statistics seek to describe themidpoint of a spread of scores, called the measure ofcentral tendency, and the spread of scores which is calledthe dispersion, of which variance is an example.14 In orderto understand this, it is necessary to consider the levels ofmeasurement, because certain (subsequent) tests onlywork with appropriate levels of measurement. If measurements are taken from a large random sample e.g. of theweight of adult patients having contrast enhanced CT anda frequency polygon is plotted of the results, it is likelya bell shaped curve is produced which shows that thevariables of a sample are normally distributed. This bellshape is called a normal or Gaussian distribution (SeeFigure 1). The word ‘normal’ here means that the datacomplies with a distribution pattern that mathematicallyallows parametric statistical tests to be applied.A hypothetical measurement of an artery of 100patients, presented through a histogram, with Gaussian bellcurve highlighting the normal distribution pattern.In radiography normal distribution of measurements maybe seen when plotting the sizes and volumes of certaine3Figure 1Example of data with a normal distribution.anatomical structures, such as the eyeball, optic nerve or asshown in Figure 1, vascular structures. Generally speaking,the measurements for such structures do not differ muchbetween people. However, often a normal distribution is notachieved; outliers can be common which will give the bellcurve a ‘tail’ at either the left hand or right hand side.Examples here would be a histogram of patients’ weight,where the distribution curve would be skewed towardsa higher weight (the curve would be described as positivelyskewed) e see also Figure 2.The same data as represented in the histograms ofFigure 1 is summarised.If data does not exhibit a normal distribution, forexample when there are some outliers, the presentation ofdata can be altered to reach a normal distribution. Acommon mathematical procedure to carry out is transforming data logarithmically; it does not change the actualdata but it does the way it is distributed on a graph andthereby facilitates analysis of the data as if it were normally distributed. If normalisation is not possible, appropriate non-parametric tests should be applied to the data.Non-parametric tests take into account the fact that thedata is skewed or has various outliers and are thereforemore conservative. The statisticians Altman and Blandillustrate these points very clearly in a series of shortarticles that they have published over the years in theBritish Medical Journal.15e18Standard deviation is a measure of how spread out thedata is, the variance of it. The narrower the standarddeviation the closer to the midpoint of the data all resultswill be.17 Without quoting the mathematical formulabehind it, the standard deviation allows for expressingvariance using the same units as those used for the observations or measurements. Generally speaking approximately 2/3 of all observations or measurements lie withinone standard deviation of the mean (the top of the distribution graph in Figure 1), and 95% lie within two standarddeviations of the mean. The inter-quartile range isbecoming more common in reporting of descriptive statistics from continuous data. This statistic represents themiddle 50% of the sample showing its dispersion, and is notinfluenced by outliers.18 Table 1 contains examples of thestandard deviation for the two example data sets as well as
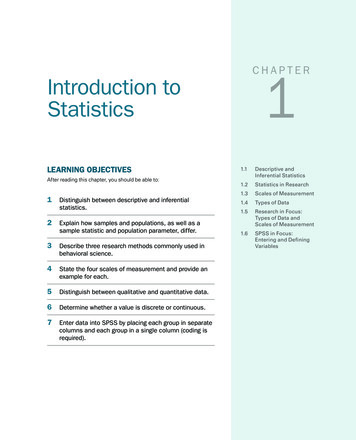
e4G. Marshall, L. JonkerBAFigure 2 Examples of data with normal and skewed distribution. These are distributions of hypothetical data for 60 patientsconcerning the volume of an eyeball with normal distribution (A) and bodyweight with negatively skewed distribution (B),respectively.the inter-quartile range. From the standard deviationparticularly it can be concluded that for the bodyweightdata more measurement points lie further away from themean.ACollection and presentation of dataIt is essential to clarify the appropriate type of data neededto answer the research question at the design stage ofa research project, so it can be gathered. The level ofmeasurement needs to be identified, allowing identificationof the statistical procedure to be used and decision makingon the sample size. Descriptive statistics are the easiest toundertake and interpret and they are a useful way tosummarise data and provide a description of the sample.Figure 3 provides another example of how to summarisedata; in this instance the hypothetical ratio between twomeasurements of the diameter of the bronchial andpulmonary arteries for 100 patients. Box plots allow a clearoverview of the characteristics of a data set, as shown inFigure 3. The box represents the 25th and 75th percentilevalues, whereas the bar inside the box represents the 50thpercentile (median). The ‘whiskers’ attached to the boxrepresent the lowest and highest values (the range) of thedata, bar extreme outliers or extreme values.Ultimately, descriptive statistics cannot be used todemonstrate causal analysis which requires the use ofinferential statistics, which allow us to generalise froma sample to a larger population. Data analysis can be takenone step further by inferring from the sample groupTable 1data.BDescriptive statistics of two example sets ofMeanMedianStandard deviation(% of mean)Inter-quartile range(25%e75%)Volume (cm3)Weight (kg)5.505.500.27 (5%)76.7573.0013.34 (17%)5.38e5.6067.25e83.00Figure 3 Presentation of the ratio between bronchial andpulmonary artery diameters in histogram (A) and box plot (B)format.
An introduction to descriptive statisticsgeneralisations that can be applied to a wider populationwhich is called inferential statistics e these are considered inour second article.The understanding of statistics is not just important tothe researcher but readers of research output (manuscripts, reports, theses) need to be cognisant of the level atwhich variables are measured, the statistical tests used andthey must be aware that statistical procedural error byresearchers is not uncommon.9 Typically this error is not inthe calculation of the test result, which nowadays is rarelyundertaken by hand but using statistical packages such asExcel, Minitab, Supastat, and the comprehensive andcommonly used SPSS (Statistical Package for SocialScience), but in the test selection. Some of the abovementioned statistical packages can be freely downloaded,albeit in some cases just for a limited period.Checklist for understanding and applying descriptivestatistics: Regarding your data do you just want to describe andsummarise it?o If so only descriptive statistics will suffice. What measure of central tendency is appropriate to thedata? Are your variables discrete or continuous? Is your data nominal, ordinal or ratio/interval data?o Once you have completed descriptive statistics, canmore information be drawn out of the data?o If so consider the use of inferential statistics whichallows drawing conclusions from the data.ConclusionStatistics provide a way of describing collected numericaldata that can be assimilated by readers, allowing theresearch outcome to be used for evidence-based practiceand thereby narrowing the theoryepractice gap. Descriptive statistics (which in certain cases can be labelled‘explorative statistics’) is perfectly suited for collating andsummarising quantitative data. It allows a radiographer togain an insight in, for example, potential trends in thedemographics of certain patient groups or to detect certaintrends in treatment outcomes through observationalstudies. Such observations can then be used as a startingpoint to further investigate the reasons behind thesecharacteristics and trends. The next step will then be toapply inferential statistics to allow drawing conclusionsapplicable to a larger group than the sample used togenerate the data. Statistics can be difficult to apply andunderstand, especially to those without experience. It isessential that the type of data collected and its analysis orrepresentation is appropriate, so that the research questioncan be answered meaningfully and so that information canbe obtained from the collected data. It is important toconsider what type of data will be collected and presentedas soon as the research question is identified.AcknowledgementI would like to thank Sue Griffiths for her proof reading ofthis article.e5References1. Rickard C. Statistics for clinical nursing practice: an introduction. Australian Critical Care: Official Journal of theConfederation of Australian Critical Care Nurses 2008;21:216e9.2. Justham D, Timmons S. An evaluation of using a web-basedstatistics test to teach statistics to post-registration nursingstudents. Nurse Education Today 2005;25:156e63.3. Davidoff F, Haynes B, Sackett D, Smith R. Evidence-basedmedicine: what it is and what it isn’t. British Medical Journal1996;312:71e2.4. Allison JJ, Calhoun JW, Wall TC, Spettell CM, Fargason Jr CA,Weissman NW, et al. Optimal reporting of health care processmeasures: inferential statistics as help or hindrance. ManagedCare Quarterly 2000;8:1e10.5. Reznick RK, Dawson-Saunders E, Folse JR. A rationale forteaching of statistics to surgical resident
An introduction to descriptive statistics: A review and practical guide Gill Marshall*, Leon Jonker Faculty of Health, Medical Sciences and Social Care, University of Cumbria, Bowerham Road, Lancaster LA1 3JD, UK Received 28 May 2009; revised 27 November 2009; accepted 3 January 2010 Availabl