Transcription
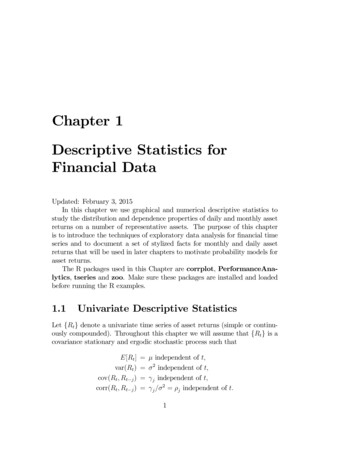
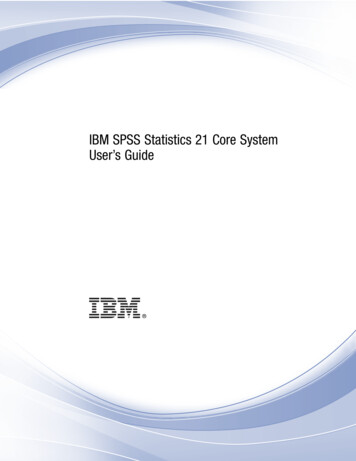
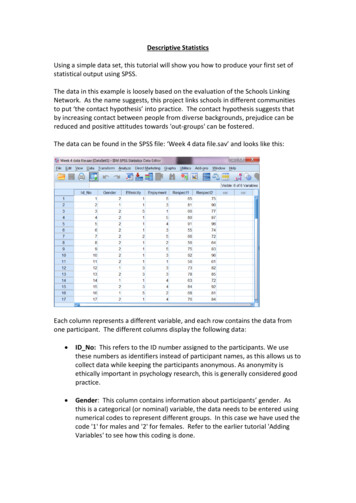
Descriptive StatisticsUsing a simple data set, this tutorial will show you how to produce your first set ofstatistical output using SPSS.The data in this example is loosely based on the evaluation of the Schools LinkingNetwork. As the name suggests, this project links schools in different communitiesto put ‘the contact hypothesis’ into practice. The contact hypothesis suggests thatby increasing contact between people from diverse backgrounds, prejudice can bereduced and positive attitudes towards 'out-groups' can be fostered.The data can be found in the SPSS file: ‘Week 4 data file.sav’ and looks like this:Each column represents a different variable, and each row contains the data fromone participant. The different columns display the following data: ID No: This refers to the ID number assigned to the participants. We usethese numbers as identifiers instead of participant names, as this allows us tocollect data while keeping the participants anonymous. As anonymity isethically important in psychology research, this is generally considered goodpractice. Gender: This column contains information about participants’ gender. Asthis is a categorical (or nominal) variable, the data needs to be entered usingnumerical codes to represent different groups. In this case we have used thecode '1' for males and '2' for females. Refer to the earlier tutorial 'AddingVariables' to see how this coding is done.
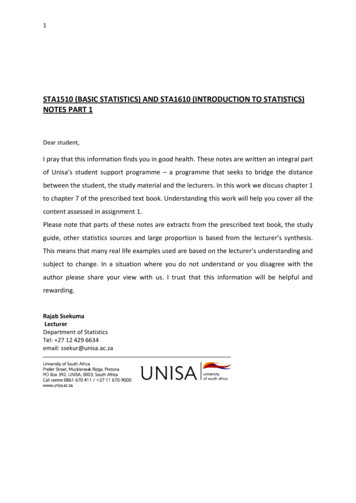
Ethnicity: This column contains information about participants’ ethnicity.Like gender, this is a categorical (or nominal) variable, as participants belongto different groups or categories. Each category is coded with a number, andthis number is used to represent each ethnic group. Enjoyment: This variable measures pupil’s enjoyment of meeting newpeople through the Linking School Network on a scale of 1-5 (where 1 didnot enjoy at all and 5 really enjoyed). As this is a single scale with 5 orderedcategories to choose from, it’s an ordinal variable. Respect1: The Linking School Network aims to reduce prejudice betweendifferent groups. To assess this, a questionnaire that measures participants’respect for the rights of others was given to students both before and aftertheir participation in the program. This variable represents their respect forothers before the intervention. As this is measured using a standardisedquestionnaire, this in an interval variable. Respect2: Following Respect1, this variable represents participants’ respectfor others after the intervention. Again, this in an interval variable.Now you have had a chance to explore what the different variables are, you need away to inspect and summarise the data, so you can get a better idea of any patternsthat may exist within it. You can do this by looking at descriptive statistics for thedata.To obtain descriptive statistics you first need to CLICK on the Analyze menu, selectthe Descriptive Statistics option, and then the Descriptives sub-option.The following Descriptives dialog box should now open:It has the names of your variables in thepane on the left hand side; and anempty pane on the right hand sidelabelled Variable(s). To tell SPSS whichvariables you want summary scores for,you need to move the variables from theleft pane to the right. This process isquite common for many of the analysesyou will undertake using SPSS.
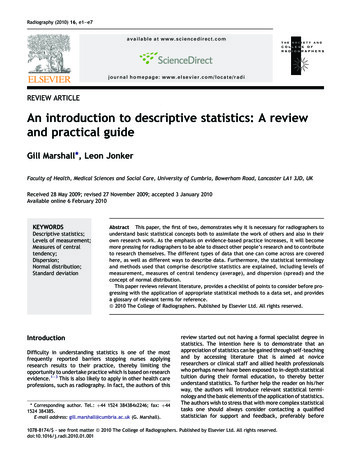
When producing descriptive statistics, you only want to do so for interval and ordinalvariables. It doesn’t make sense to ask SPSS to produce means and standarddeviations for categorical (or nominal) data.Interval variables are represented by a ruler symbolchart ; and categorical by the three circles .; ordinal variables by a barHolding down the CTRL key on your keyboard, select your three variables of interest(Enjoyment, Respect1 and Respect2) and move them across to the right-hand paneusing the blue arrow button in the centre of the dialog box.Once you have selected all of the variables you want to explore, click the Options button to select and/or change the statistics SPSS will display.This opens another dialog box up. Here you can seewhich descriptive statistics are displayed by default,and change them if you wish.For the purpose of this tutorial, let's add the Rangeitem to our output. To do this, CLICK on the check boxto the left of this option, so the box becomes ticked.To save any changes you have made, click on theContinue button.Note: if you click Cancel the Range will no longer beselected and so this descriptive statistic will not bedisplayed in your SPSS Output.This will return you back to your Descriptivesdialog box, where you need to CLICK on theOK button to display your statistics.
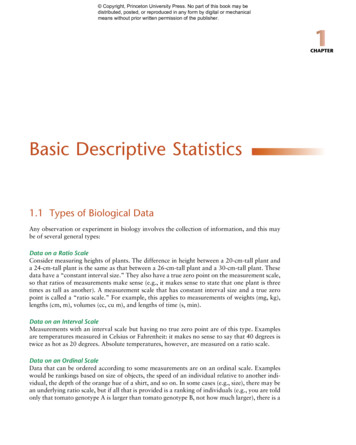
Once you have told SPSS which statistics you would like to see, the program displaysthem in a separate Output window like this one:The Descriptive Statistics table displays all of the information that you haverequested. The left-most column tells you which row relates to which variable. Thefull Variable Labels (rather than abbreviated Variable Names) are displayed bydefault here. ‘Valid N (listwise)’ is a label for the number of ‘valid’ cases in thedataset. The rest of the columns represent the following: N: 'N' stands for ‘number of participants’. This column simply tells you howmany participants you have data for for each variable (excluding missingdata). ‘Valid N (listwise)’ displays the number of participants who you havedata for on all measures. Range: This column measures the spread of the scores obtained. Essentiallythe range is the difference between the lowest and the highest value. Minimum: This refers to the lower end of the range. In the minimum columnis the lowest score of the variable in each row. Maximum: This refers to the upper end of the range. In the maximumcolumn is the highest score of the variable in each row. Mean: The Mean column shows the mathematical average for each of thevariables. This is the sum of the scores divided by the number of scores (theN). Std. Deviation: This column displays the Standard Deviation for each variable.This refers to the spread of the scores around the mean, and represents howmuch variation you have in the data. The larger the values relative to themeans, the more dispersed the scores are.
When carrying out research you should always report the means and standarddeviations of your variables, as it gives instant meaning to your data. They areusually reported to 2 decimal places.In this case, looking at the table you could say: On average pupil’s seemed to enjoy the Linking Schools Project, with a meanEnjoyment score of 3.74 (SD 1.14). In addition, participant’s Respect scores before taking part in the projectappeared lower (mean 71.10; SD 13.60) than afterwards (mean 79.44;SD 11.70).Now you have been shown how to enter data and produce descriptive statistics, whydon’t you try creating your own data set and calculating the means, standarddeviations and other descriptive statistics? Or download the data file used in thistutorial (Week 4 data file.sav) and see if you can produce the same output yourself.There are also a number of other ways you can produce summary statistics for yourvariables. For example, you can use the following menu options: Analyse - Descriptive Statistics - Frequencies Analyse - Descriptive Statistics - Explore Why not explore these options and see what output you can produce?Practicing using SPSS yourself will help to increase your confidence with using theprogram and analysing statistics, so we really do recommend that you takeadvantage of any opportunities for practice that are available!
Once you have told SPSS which statistics you would like to see, the program displays them in a separate Output window like this one: The Descriptive Statistics table displays all of the information that you have requested. The left-most column tells you which row relates to which variable. The