Transcription
Exploratory Data Analysis Course NotesXing SuContentsPrinciple of Analytic Graphics . . . . . . . . . . . . . . . . . . . . . . . . . . . . . . . . . . . . . .3Exploratory Graphs (examples) . . . . . . . . . . . . . . . . . . . . . . . . . . . . . . . . . . . . . .4One Dimension Summary of Data. . . . . . . . . . . . . . . . . . . . . . . . . . . . . . . . .4Two Dimensional Summaries . . . . . . . . . . . . . . . . . . . . . . . . . . . . . . . . . . . .4Process of Making a Plot/Considerations. . . . . . . . . . . . . . . . . . . . . . . . . . . . .7Base Plotting . . . . . . . . . . . . . . . . . . . . . . . . . . . . . . . . . . . . . . . . . . . . . . . .7Base Graphics Functions and Parameters . . . . . . . . . . . . . . . . . . . . . . . . . . . . .7Base Plot Example . . . . . . . . . . . . . . . . . . . . . . . . . . . . . . . . . . . . . . . . . .8Multiple Plot Example . . . . . . . . . . . . . . . . . . . . . . . . . . . . . . . . . . . . . . . .9Graphics Device . . . . . . . . . . . . . . . . . . . . . . . . . . . . . . . . . . . . . . . . . . . . . .11lattice Plotting System . . . . . . . . . . . . . . . . . . . . . . . . . . . . . . . . . . . . . . . . .13lattice Functions and Parameters . . . . . . . . . . . . . . . . . . . . . . . . . . . . . . . . .13lattice Example . . . . . . . . . . . . . . . . . . . . . . . . . . . . . . . . . . . . . . . . . . .14ggplot2 Plotting System . . . . . . . . . . . . . . . . . . . . . . . . . . . . . . . . . . . . . . . . .15ggplot2 Functions and Parameters . . . . . . . . . . . . . . . . . . . . . . . . . . . . . . . . .15ggplot2 Comprehensive Example . . . . . . . . . . . . . . . . . . . . . . . . . . . . . . . . . .20Hierarchical Clustering . . . . . . . . . . . . . . . . . . . . . . . . . . . . . . . . . . . . . . . . . . .22Procedure for Constructing Hierarchical Clusters (hclust function) . . . . . . . . . . . . . . .22Approaches for Merging Points/Clusters . . . . . . . . . . . . . . . . . . . . . . . . . . . . . .22Characteristics of Hierarchical Clustering Algorithms . . . . . . . . . . . . . . . . . . . . . . .23hclust Function and Example . . . . . . . . . . . . . . . . . . . . . . . . . . . . . . . . . . .23myplcclust Function and Example . . . . . . . . . . . . . . . . . . . . . . . . . . . . . . . . .24heatmap Function and Example . . . . . . . . . . . . . . . . . . . . . . . . . . . . . . . . . . .25image Function and Example . . . . . . . . . . . . . . . . . . . . . . . . . . . . . . . . . . . .25K-means Clustering . . . . . . . . . . . . . . . . . . . . . . . . . . . . . . . . . . . . . . . . . . . .27Procedure for Constructing K-means Clusters (kmeans function) . . . . . . . . . . . . . . . .27Characteristics of K-means Clustering Algorithms. . . . . . . . . . . . . . . . . . . . . . . .28. . . . . . . . . . . . . . . . . . . . . . . . . . . . . . . . . . . . . . . . . . .29Singular Value Decomposition (SVD) . . . . . . . . . . . . . . . . . . . . . . . . . . . . . . . .30Principal Components Analysis (PCA) . . . . . . . . . . . . . . . . . . . . . . . . . . . . . . .30SVD and PCA Example . . . . . . . . . . . . . . . . . . . . . . . . . . . . . . . . . . . . . . .30Dimension Reduction1
Create Approximations/Data Compression. . . . . . . . . . . . . . . . . . . . . . . . . . . .35Color Packages in R Plots . . . . . . . . . . . . . . . . . . . . . . . . . . . . . . . . . . . . . . . . .37grDevices Package . . . . . . . . . . . . . . . . . . . . . . . . . . . . . . . . . . . . . . . . . .37RColorBrewer Package . . . . . . . . . . . . . . . . . . . . . . . . . . . . . . . . . . . . . . . .38Case Study: Human Activity Tracking with Smart Phones . . . . . . . . . . . . . . . . . . . . . . .41Case Study: Fine Particle Pollution in the U.S. from 1999 to 2012 . . . . . . . . . . . . . . . . . .492
Principle of Analytic Graphics Principle 1: Show Comparisons– always comparative (compared to what)– randomized trial - compare control group to test group– evidence for a hypothesis is always relative to another competing hypothesis Principle 2: Show causality/mechanism/explanation/systematic structure– form hypothesis to evidence showing a relationship (causal framework, why something happened) Principle 3: Show multivariate data– more than 2 variables because the real world is multivariate– show as much data on a plot as you can– example slightly negative relationship between pollution and mortality– when split up by season, the relationships are all positive season confounding variable3
Principle 4: Integration of evidence– use as many modes of evidence/displaying evidence as possible (modes of data presentation)– integrate words/numbers/images/diagrams (information rich)– analysis should drive the tool Principle 5: Describe/document evidence with appropriate labels/scales/sources– add credibility to that data graphic Principle 6: Content is the most important– analytical presentations ultimately stand/fall depending on quality/relevance/integrity of contentExploratory Graphs (examples) Purpose: understand data properties, find pattern in data, suggest modeling strategies, debug Characteristics: made quickly, large number produced, gain personal understanding, appearancesand presentation are aren’t as importantOne Dimension Summary of Data summary(data) returns min, 1st quartile, median, mean, 3rd quartile, max boxplot(data, col “blue”) produces a box with middles 50% highlighted in the specified color – whiskers 1.58IQR/ n IQR interquartile range, Q3 - Q1– box 25%, median, 75% histograms(data, col “green”) produces a histogram with specified breaks and color– breaks 100 the higher the number is the smaller/narrower the histogram columns are rug(data) density plot, add a strip under the histogram indicating location of each data point barplot(data, col wheat) produces a bar graph, usually for categorical data Overlaying Features abline(h/v 12) overlays horizontal/vertical line at specified location– col “red” specifies color– lwd 4 line width– lty 2 line typeTwo Dimensional Summaries multiple/overlay 1D plots (using lattice/ggplot2) box plots: boxplot(pm25 region, data pollution, col “red”)4
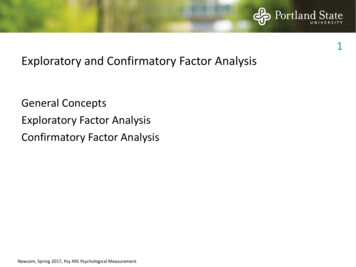
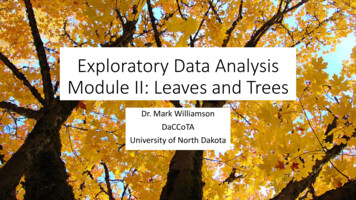
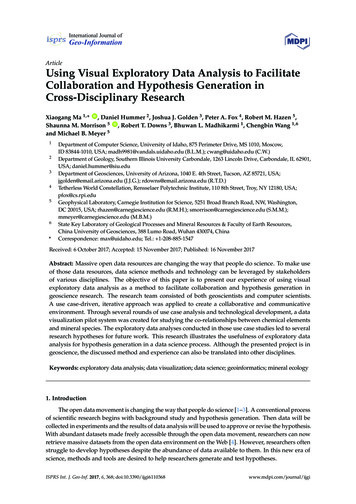
histogram:– par(mfrow c(2, 1), mar c(4, 4, 2, 1)) set margin– hist(subset(pollution, region "east") pm25, col "green") first histogram– hist(subset(pollution, region "west") pm25, col "green") second histogram scatterplot– with(pollution, plot(latitude, pm25, col region))– abline(h 12, lwd 2, lty 2) plots horizontal dotted line– plot(jitter(child, 4) parent, galton) spreads out data points at the same position tosimulate measurement error/make high frequency more visibble5
62 66 70 74jitter(child, 4)6466687072parent multiple scatter plots– par(mfrow c(1, 2), mar c(5, 4, 2, 1)) sets margins– with(subset(pollution, region "west"), plot(latitude, pm25, main "West")) left scatterplot– with(subset(pollution, region "east"), plot(latitude, pm25, main "East")) right scatterplot6
Process of Making a Plot/Considerations where will plot be made? screen or file?how will plot be used? viewing on screen/web browser/print/presentation?large amount of data vs few points?need to be able to dynamically resize?plotting system: base, lattice, ggplot2?Base Plotting blank canvas, “artist’s palette”, start with plot functionannotations - text, lines, points, axisconvenient, but cannot go back when started (need to plan ahead)everything need to be manually set carefully to be able to achieve the desired effect (margins)core plotting/graphics engine in R encapsulated in the following– graphics: plotting functions for vase graphing system (plot, hist, boxplot, text)– grDevices: contains all the code implementing the various graphics devices (x11, PDF, PostScript,PNG, etc) Two phase: initialize, annotate calling plot(x, y) or hist(x) will launch a graphics device and draw a plot on device– if no argument specified, default called– parameters documented in “?par”– Note: it is some times necessary to convert column/variable to factor to make plotting easier airquality - transform(airquality, Month factor(month))Base Graphics Functions and Parameters arguments– pch: plotting symbol (default open circle)– lty: line type (default is solid)7
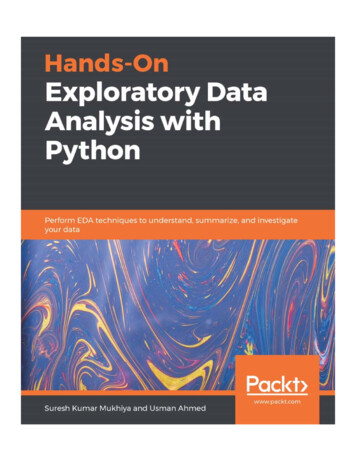
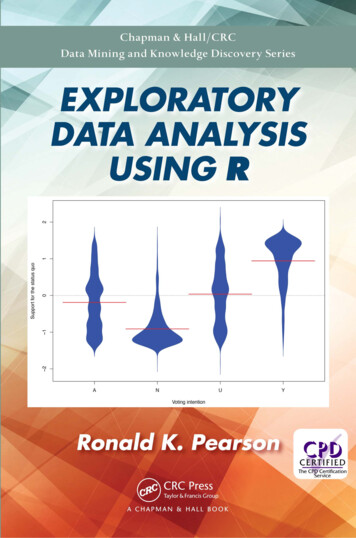
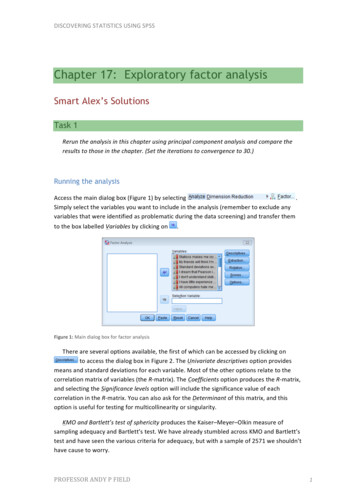
0 blank, 1 solid (default), 2 dashed, 3 dotted, 4 dotdash, 5 longdash, 6 twodash––––lwd: line width (integer)col: plotting color (number string or hexcode, colors() returns vector of colors)xlab, ylab: x-y label character stringscex: numerical value giving the amount by which plotting text/symbols should be magnifiedrelative to the default cex 0.15 * variable: plot size as an additional variable par() function specifies global graphics parameters, affects all plots in an R session (can be overridden)–––––––las: orientation of axis labelsbg: background colormar: margin size (order bottom left top right)oma: outer margin size (default 0 for all sides)mfrow: number of plots per row, column (plots are filled row-wise)mfcol: number of plots per row, column (plots are filled column-wise)can verify all above parameters by calling par("parameter") plotting functions––––––lines: adds liens to a plot, given a vector of x values and corresponding vector of y valuespoints: adds a point to the plottext: add text labels to a plot using specified x,y coordinatestitle: add annotations to x,y axis labels, title, subtitles, outer marginmtext: add arbitrary text to margins (inner or outer) of plotaxis: specify axis ticksBase Plot Examplelibrary(datasets)# type “n” sets up the plot and does not fill it with datawith(airquality, plot(Wind, Ozone, main "Ozone and Wind in# subsets of data are plotted here using different colorswith(subset(airquality, Month 5), points(Wind, Ozone, colwith(subset(airquality, Month ! 5), points(Wind, Ozone, collegend("topright", pch 1, col c("blue", "red"), legend model - lm(Ozone Wind, airquality)# regression line is produced hereabline(model, lwd 2)8New York City", type "n")) "blue")) "red"))c("May", "Other Months"))
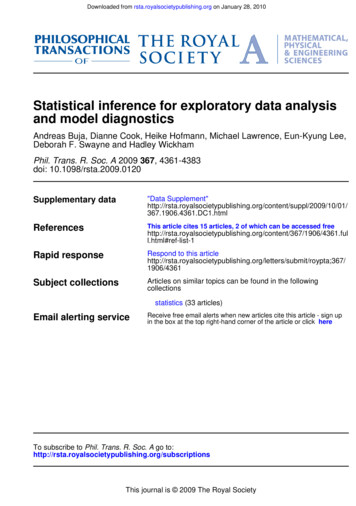
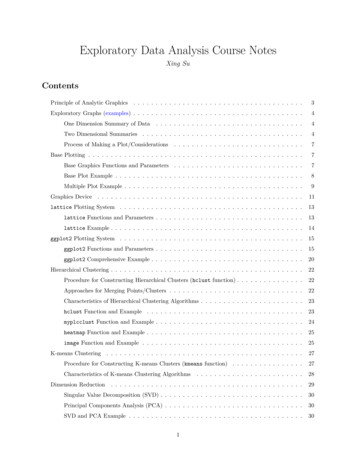
Ozone and Wind in New York City100050Ozone150MayOther Months5101520WindMultiple Plot Example Note: typing example(points) in R will launch a demo of base plotting system and may provide somehelpful tips on graphing# this expression sets up a plot with 1 row 3 columns, sets the margin and outer marginspar(mfrow c(1, 3), mar c(4, 4, 2, 1), oma c(0, 0, 2, 0))with(airquality, {# here three plots are filled in with their respective titlesplot(Wind, Ozone, main "Ozone and Wind")plot(Solar.R, Ozone, main "Ozone and Solar Radiation")plot(Temp, Ozone, main "Ozone and Temperature")# this adds a line of text in the outer margin*mtext("Ozone and Weather in New York City", outer TRUE)})9
Ozone and Weather in New York City510Wind1520100150Ozone and Temperature050Ozone100050Ozone100500Ozone150Ozone and Solar Radiation150Ozone and Wind0 50150Solar.R10250607080Temp90
Graphics Device A graphics device is something where you can make a plot appear––––window on screen (screen device) quick visualizations and exploratory analysispdf (file device) plots that may be printed out or incorporated in to documentPNG/JPEG (file device) plots that may be printed out or incorporated in to documentscalable vector graphics (SVG) When a plot is created in R, it has to be sent to a graphics device Most common is screen device– quartz() on Mac, windows() on Windows, x11() on Unix/Linux– ?Devices lists devices found Plot creation– screen device call plot/xplot/qplot plot appears on screen device annotate as necessary use– file devices explicitly call graphics device plotting function to make plot (write to file) annotate asnecessary explicitly close graphics device with dev.off() Graphics File Devices– Vector Formats (good for line drawings/plots w/ solid colors, a modest number of points) pdf: useful for line type graphics, resizes well, usually portable, not efficient if too many points svg: XML based scalable vector graphics, support animation and interactivity, web based win.metafile: Windows metafile format postscript: older format, resizes well, usually portable, can create encapsulated postscriptfile, Windows often don’t have postscript viewer (postscript predecessor of PDF)– Bitmap Formats (good for plots w/ large number of points, natural scenes/webbased plots) png: Portable Network Graphics, good for line drawings/image with solid colors, uses losslesscompression, most web browsers read this natively, good for plotting a lot of data points, doesnot resize well JPEG: good for photographs/natural scenes/gradient colors, size efficient, uses lossy compression, good for plotting many points, does not resize well, can be read by almost anycomputer/browser, not great for line drawings (aliasing on edges) tiff: common bitmap format supports lossless compression bmp: native Windows bitmapped format Multiple Open Graphics Devices–––––possible to open multiple graphics devices (screen, file, or both)plotting occurs only one device at a timedev.cur() returns the currently active deviceevery open graphics device is assigned an integer 2dev.set( integer ) change the active graphics device integer number associated withthe graphics device you want to switch to Copying plots––––dev.copy() copy a plot from one device to anotherdev.copy2pdf() specifically for copying to PDF filesNote: copying a plot is not an exact operation, so the result may not be identical to the originalexample11
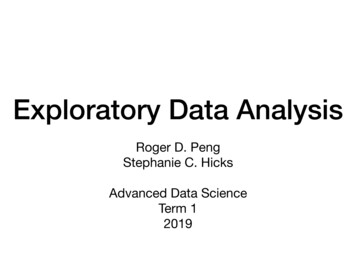
## Create plot on screen devicewith(faithful, plot(eruptions, waiting))## Add a main titletitle(main "Old Faithful Geyser data")7050waiting90Old Faithful Geyser data1.52.53.5eruptions## Copy my plot to a PNG filedev.copy(png, file "geyserplot.png")## Don't forget to close the PNG device!dev.off()124.5
lattice Plotting System library(lattice) load lattice system implemented using the lattice and grid packages– lattice package contains code for producing Trellis graphics (independent from base graphicssystem)– grid package implements the graphing system; lattice build on top of grid all plotting and annotation is done with single function call– margins/spacing/labels set automatically for entire plot, good for putting multiple on the screen– good for conditioning plots examining same plots over different conditions how y changes vs xacross different levels of z– panel functions can be specified/customized to modify the subplots lattice graphics functions return an object of class “trellis”, where as base graphics functions plot datadirectly to graphics device– print methods for lattice functions actually plots the data on graphics device– trellis objects are auto-printed– trellis.par.set() can be used to set global graphic parameters for all trellis objects hard to annotate, awkward to specify entire plot in one function call cannot add to plot once created, panel/subscript functions hard to preparelattice Functions and Parameters Funtions–––––––xyplot() main function for creating scatterplotsbwplot() box and whiskers plots (box plots)histogram() histogramsstripplot() box plot with actual pointsdotplot() plot dots on “violin strings”splom() scatterplot matrix (like pairs() in base plotting system)levelplot()/contourplot() plotting image data Arguments for xyplot(y x f * g, data, layout, panel)– default blue open circles for data points– formula notation is used here ( ) left hand side is the y-axis variable, and the right hand side isthe x-axis variable– f/g conditioning/categorical variables (optional) basically creates multi-panelled plots (for different factor levels) * indicates interaction between two variables intuitively, the xyplot displays a graph between x and y for every level of f and g– data the data frame/list from which the variables should be looked up if nothing is passed, the parent frame is used (searching for variables in the workspace) if no other arguments are passed, defaults will be used– layout specifies how the different plots will appear layout c(5, 1) produces 5 subplots in a horizontal fashion padding/spacing/margin automatically set– [optional] panel function can be added to control what is plotted inside each panel of the plot13
panel functions receive x/y coordinates of the data points in their panel (along with anyadditional arguments) ?panel.xyplot brings up documentation for the panel functions Note: no base plot functions can be used for lattice plotslattice Examplelibrary(lattice)set.seed(10)x - rnorm(100)f - rep(0:1, each 50)y - x f - f * x rnorm(100, sd 0.5)f - factor(f, labels c("Group 1", "Group 2"))## Plot with 2 panels with custom panel functionxyplot(y x f, panel function(x, y, .) {# call the default panel function for xyplotpanel.xyplot(x, y, .)# adds a horizontal line at the medianpanel.abline(h median(y), lty 2)# overlays a simple linear regression linepanel.lmline(x, y, col 2)}) 2Group 11y0 1 2 100Group 22 2 112x1412
ggplot2 Plotting System library(ggplot2) loads ggplot2 package implementation of Grammar of Graphics by Leland Wilkinson, written by Hadley Wickham (createdRStudio)“In brief, the grammar tells us that a statistical graphic is a mapping from data to aestheticattributes (color, shape, size) of geometric objects (points, lines, bars). The plot may also containstatistical transformations of the data and is drawn on a specific coordinate system” grammar graphics plot, splits the different between base and lattice systems automatically sets spacings/text/tiles but also allows annotations to be added default makes a lot of choices, but still customizableggplot2 Functions and Parameters basic components of a ggplot2 graphic–––––––data frame source of dataaesthetic mappings how data are mappped to color/size (x vs y)geoms geometric objects like points/lines/shapes to put on pagefacets conditional plots using factor variables/multiple panelsstats statistical transformations like binning/quantiles/smoothingscales scale aesthetic map uses (i.e. male red, female blue)coordinate system system in which data are plotted qplot(x, y, data , color, geom) quick plot, analogous to base system’s plot() function– default style: gray background, white gridlines, x and y labels automatic, and solid black circlesfor data points– data always comes from data frame (in unspecified, function will look for data in workspace)– plots are made up of aesthetics (size, shape, color) and geoms (points, lines)– Note: capable of producing quick graphics, but difficult to customize in detail factor variables: important for graphing subsets of data they should be labelled with specificinformation, and not just 1, 2, 3– color factor1 use the factor variable to display subsets of data in different colors on thesame plot (legend automatically generated)– shape factor2 use the factor variable to display subsets of data in different shapes on thesame plot (legend automatically generated)– examplelibrary(ggplot2)qplot(displ, hwy, data mpg, color drv, shape drv)15
40hwydrv430fr20234567displ adding statistics: geom c("points", "smooth") add a smoother/“low S”– “points” plots the data themselves, “smooth” plots a smooth mean line in blue with an area of95% confidence interval shaded in dark gray– method "lm" additional argument method can be specified to create different lines/confidenceintervals lm linear regression– exampleqplot(displ, hwy, data mpg, geom c("point", "smooth"), method "lm")hwy40302010234567displ histograms: if only one value is specified, a histogram is produced– fill factor1 can be used to fill the histogram with different colors for the subsets (legendautomatically generated)– example16
qplot(hwy, data mpg, fill drv)30countdrv420fr10010203040hwy facets: similar to panels in lattice, split data according to factor variables– facets rows columns produce different subplots by factor variables specified(rows/columns)– "." indicates there are no addition row or column– facets . columns creates 1 by col subplots– facets row . creates row row by 1 subplots– labels get generated automatically based on factor variable values– exampleqplot(displ, hwy, data mpg, facets . drv)4frhwy4030202 3 4 5 6 7 2 3 4 5 6 7 2 3 4 5 6 7displqplot(hwy, data mpg, facets drv ., binwidth 2)17
fcount4302010030201003020100r10203040hwy density smooth: smooths the histograms into a line tracing its shape– geom "density" replaces the default scatterplot with density smooth curve– example ggplot()– built up in layers/modularly (similar to base plotting system) data overlay summary metadata/annotation– g - ggplot(data, aes(var1, var2)) initiates call to ggplot and specifies the data frame that will be usedaes(var1, var2) specifies aesthetic mapping, or var1 x variable, and var2 y variablesummary(g) displays summary of ggplot objectprint(g) returns error (“no layer on plot”) which means the plot does know how to drawthe data yet– g geom point() takes information from g object and produces scatter plot– geom smooth() adds low S mean curve with confidence interval18
method "lm" changes the smooth curve to be linear regression size 4, linetype 3 can be specified to change the size/style of the line se FALSE turns off confidence interval– facet grid(row col) splits data into subplots by factor variables (see facets from qplot()) conditioning on continous variables is possible through cutting/making a new categoricalvariable cutPts - quantiles(df cVar, seq(0, 1, length 4), na.rm TRUE) creates quantiles where the continuous variable will be cut· seq(0, 1, length 4) creates 4 quantile points· na.rm TRUE removes all NA values df newFactor - cut(df cVar, cutPts) creates new categorical/factor variable by usingthe cutpoints· creates n-1 ranges from n points in this case 3– annotations: xlab(), ylab(), labs(), ggtitle() for labels and titles· labs(x expression("log " * PM[2.5]), y "Nocturnal") specifies x and y labels· expression() used to produce mathematical expressions geom functions many options to modify theme() for global changes in presentation· example: theme(legend.position "none") two standard themes defined: theme gray() and theme bw() base family "Times" changes font to Times– aesthetics geom point(color, size, alpha) specifies how the points are supposed to be plottedon the graph (style)· Note: this translates to geom line()/other forms of plots· color "steelblue" specifies color of the data points· aes(color var1) wrapping color argument this way allows a factor variable to beassigned to the data points, thus subsetting it with different colors based on factor variablevalues· size 4 specifies size of the data points· alpha 0.5 specifies transparency of the data points example19
– axis limits ylim(-3, 3) limits the range of y variable to a specific range· Note: ggplot will exclude (not plot) points that fall outside of this range (outliers),potentially leaving gaps in plot coord cartesian(ylim(-3, 3)) this will limit the visible range but plot all points ofthe dataggplot2 Comprehensive Example# initiates ggplotg - ggplot(maacs, aes(logpm25, NocturnalSympt))g geom point(alpha 1/3) facet wrap(bmicat no2dec, nrow 2, ncol 4) geom smooth(method "lm", se FALSE, col "steelblue") theme bw(base family "Avenir", base size 10) labs(x expression("log " * PM[2.5]) labs(y "Nocturnal Symptoms”) labs(title "MAACS Cohort”)20#####adds pointsmake panelsadds smootherchange themeadd labels
21
Hierarchical Clustering useful for visualizing high dimensional data, organizes things that are close into groups agglomerative approach (most common) — bottom up1.2.3.4.start with datafind closest pairs, put them together (create “super point” and remove original data)find the next closestrepeat yields a tree showing order of merging (dendrogram)– requires merging approach: how to merge two pointsdistance metric: calculating distancep between two pointscontinuous - Euclidean distance (A1 A2 )2 (B1 B2 )2 · · · (Z1 Z2 )2continuous - correlation similarity how correlated two data points arebinary - Manhattan distance (“city block distance”) A1 A2 B1 B2 · · · Z1 Z2 Procedure for Constructing Hierarchical Clusters (hclust function)1. calculate all pair wise distances between all points to see which points are closest together dist(data.frame(x x, y y) returns pair wise distances for all of the (x,y) coordinates Note: dist() function uses Euclidean distance by default2. group two closest points from the calculated distances and merge them to a single point3. find the next two closest points and merge them, and repeat4. order of clustering is shown in the dendrogramApproaches for Merging Points/Clusters the approach is specified in the argument method "complete" or "average" in hclust() function average linkage taking average of the x and y coordinates for both points/clusters (center of masseffectively)22
complete linkage to measure distance of two clusters, take the two points in the clusters that arethe furthest apart Note: two approaches may produce different results so it’s a good idea to use both approaches to validateresultsCharacteristics of Hierarchical Clustering Algorithms clustering result/plot maybe unstable––––changing few points/outliers could lead to large changeschange different distance metrics to see how sensitive the clustering ischange merging strategyscaling of variables could affect the clustering (if one unit/measurement is much larger thananother) deterministic running the hclust function with same parameters and the same data will producethe same plot determining how many clusters there are (where to cut) may not always be clear primarily used for exploratory data analysis, to see over all pattern in data if there is any at allhclust Function and Example hh - hclust(dist(dataFrame)) function produces a hierarchical cluster object based on pair wisedistances from a data frame of x and y values– dist() defaults to Euclidean, calculates the distance/similaritybetween two observations; whenpapplied to a data frame, the function applies the (A1 A2 )2 (B1 B2 )2 . (Z1 Z2 )2formula to every pair of rows of data to construct a matrix of distances between the roes order of the hierarchical cluster is derived from the distance– plot(hh) plots the dendrogram– automatically sorts column and row according to cluster– names(hh) returns all parameters of the hclust object hh order returns the order of the rows/clusters from the dendrogram hh dist.method returns method for calculating distance/similarity Note: dendrogram that gets generated DOES NOT show how many clusters there are, so cutting(at 2.0 level for example) must be done to determine number of clusters — must be a convenient andsensible point hclust Exampleset.seed(1234)x - rnorm(12,mean rep(1:3,each 4),sd 0.2)y - rnorm(12,mean rep(c(1,2,1),each 4),sd 0.2)dataFrame - data.frame(x x,y y)distxy - dist(dataFrame)hClustering - hclust(distxy)plot(hClustering)23
1.57562314101191280.0HeightCluster Dendrogramdistxyhclust (*, "complete")myplcclust Function and Example Note: myplcclust a function to plot hclust objects in color (clusters labeled 1 2 3 etc.), but mustknow how many clusters there are initiallymyplclust - function(hclust, lab hclust labels,lab.col rep(1, length(hclust labels)), hang 0.1, .) {## modifiction of plclust for plotting hclust objects *in colour*! Copyright## Eva KF Chan 2009 Arguments: hclust: hclust object lab: a character vector## of labels of the leaves of the tree lab.col: colour for the labels;## NA default device foreground colour hang: as in hclust & plclust Side## effect: A display of hierarchical cluster with coloured leaf labels.y - rep(hclust height, 2)x - as.numeric(hclust merge)y - y[which(x 0)]x - x[which(x 0)]x - abs(x)y - y[order(x)]x - x[order(x)]plot(hclust, labels FALSE, hang hang, .)text(x x, y y[hclust order] - (max(hclust height) * hang), labels lab[hclust order],col lab.col[hclust order], srt 90, adj c(1, 0.5), xpd NA, .)}# exampledataFrame - data.frame(x x, y y)distxy - dist(dataFrame)hClustering - hclust(distxy)myplclust(hClustering, lab rep(1:3, each 4), lab.col rep(1:3, each 4))24
2222111133330.0 1.0 2.0HeightCluster Dendrogramdistxyhclust (*, "complete")heatmap Function and Example heatmap(data.matrix) function similar to image(t(x))– good for visualizing high-dimension matrix data, runs hierarchical analysis on rows and columnsof table– yellow high value, red low value– Note: the input must be a numeric matrix, so as.matrix(data.frame) can be used to convert ifnecessary exampleset.seed(12345)data - matrix(rnorm(400), nrow age Function and Example image(x, y, t(dataMatrix)[, nrow(dataMatrix):1]) produces similar color grid plot as theheatmap() without the dendrograms25
– t(dataMatrix)[, nrow(dataMatrix)] t(dataMatrix) transpose of dataMatrix, this is such that the plot will be displayed in thesame fashion as the matrix (rows as values on the y axis and columns as values on the x axis)· example 40 x 10 matrix will have graph the 10 columns as x values and 40 rows as yvalues [, nrow(dataMatrix)] subsets the data frame in reverse column order; when combinedwith the t() function, it reorders the rows of data from 40 to 1, such that the data from thematrix
Exploratory Data Analysis Course Notes Xing Su Contents PrincipleofAnalyticGraphics. . . . . . . . . .