Transcription
Downloaded from rsta.royalsocietypublishing.org on January 28, 2010Statistical inference for exploratory data analysisand model diagnosticsAndreas Buja, Dianne Cook, Heike Hofmann, Michael Lawrence, Eun-Kyung Lee,Deborah F. Swayne and Hadley WickhamPhil. Trans. R. Soc. A 2009 367, 4361-4383doi: 10.1098/rsta.2009.0120Supplementary data"Data erencesThis article cites 15 articles, 2 of which can be accessed freeRapid responseRespond to this ers/submit/roypta;367/1906/4361Subject collectionsArticles on similar topics can be found in the 1statistics (33 articles)Email alerting serviceReceive free email alerts when new articles cite this article - sign upin the box at the top right-hand corner of the article or click hereTo subscribe to Phil. Trans. R. Soc. A go tionsThis journal is 2009 The Royal Society
Downloaded from rsta.royalsocietypublishing.org on January 28, 2010Phil. Trans. R. Soc. A (2009) 367, 4361–4383doi:10.1098/rsta.2009.0120Statistical inference for exploratory dataanalysis and model diagnosticsBY ANDREAS BUJA1 , DIANNE COOK2, *, HEIKE HOFMANN2 ,MICHAEL LAWRENCE3 , EUN-KYUNG LEE4 , DEBORAH F. SWAYNE5AND HADLEY WICKHAM61 WhartonSchool, University of Pennsylvania, Philadelphia, PA 19104, USAof Statistics, Iowa State University, Ames, IA 50011-1210, USA3 Fred Hutchinson Cancer Research Center, 1100 Fairview Avenue, Seattle,WA 98109, USA4 Department of Statistics, EWHA Womans University, 11-1 Daehyun-Dong,Seodaemun-Gu, Seoul 120-750, Korea5 Statistics Research Department, AT&T Laboratories, 180 Park Avenue,Florham Park, NJ 07932-1049, USA6 Department of Statistics, Rice University, Houston, TX 77005-1827, USA2 DepartmentWe propose to furnish visual statistical methods with an inferential framework andprotocol, modelled on confirmatory statistical testing. In this framework, plots take onthe role of test statistics, and human cognition the role of statistical tests. Statisticalsignificance of ‘discoveries’ is measured by having the human viewer compare the plotof the real dataset with collections of plots of simulated datasets. A simple but rigorousprotocol that provides inferential validity is modelled after the ‘lineup’ popular fromcriminal legal procedures. Another protocol modelled after the ‘Rorschach’ inkblot test,well known from (pop-)psychology, will help analysts acclimatize to random variabilitybefore being exposed to the plot of the real data. The proposed protocols will beuseful for exploratory data analysis, with reference datasets simulated by using a nullassumption that structure is absent. The framework is also useful for model diagnosticsin which case reference datasets are simulated from the model in question. This latterpoint follows up on previous proposals. Adopting the protocols will mean an adjustmentin working procedures for data analysts, adding more rigour, and teachers mightfind that incorporating these protocols into the curriculum improves their students’statistical thinking.Keywords: permutation tests; rotation tests; statistical graphics; visual data mining;simulation; cognitive perception*Author for correspondence (dicook@iastate.edu).Electronic supplementary material is available at http://dx.doi.org/10.1098/rsta.2009.0120 or viahttp://rsta.royalsocietypublishing.org.One contribution of 11 to a Theme Issue ‘Statistical challenges of high-dimensional data’.4361This journal is 2009 The Royal Society
Downloaded from rsta.royalsocietypublishing.org on January 28, 20104362A. Buja et al.1. IntroductionExploratory data analysis (EDA) and model diagnostics (MD) are two dataanalytic activities that rely primarily on visual displays and only secondarily onnumeric summaries. EDA, as championed by Tukey (1965), is the free-wheelingsearch for structure that allows data to inform and even to surprise us. MD, whichwe understand here in a narrow sense, is the open-ended search for structure notcaptured by the fitted model (setting aside the diagnostics issues of identifiabilityand influence). Roughly speaking, we may associate EDA with what we do toraw data before we fit a complex model and MD with what we do to transformeddata after we fit a model. (Initial data analysis (IDA) as described in Chatfield(1995), where the assumptions required by the model fitting are checked visually,is considered a part of, or synonymous with, EDA.) We are interested here inboth EDA and MD, insofar as they draw heavily on graphical displays.EDA, more so than MD, has sometimes received an ambivalent response.When seen positively, it is cast as an exciting part of statistics that has to dowith ‘discovery’ and ‘detective work’; when seen negatively, EDA is cast as thepart of statistics that results in unsecured findings at best, and in the overor misinterpretation of data at worst. Either way, EDA seems to be lackingsomething: discoveries need to be confirmed and over-interpretations of dataneed to be prevented. Universal adoption of EDA in statistical analyses mayhave suffered as a consequence. Strictly speaking, graphical approaches to MDdeserve a similarly ambivalent response. While professional statisticians mayresolve their ambivalence by resorting to formal tests against specific modelviolations, they still experience the full perplexity that graphical displays cancause when teaching, for example, residual plots to student novices. Students’countless questions combined with their tendencies to over-interpret plots impresson us the fact that reading plots requires calibration. But calibrating inferentialmachinery for plots is lacking and this fact casts an air of subjectivity on their use.The mirror image of EDA’s and MD’s inferential failings is confirmatorystatistics’ potential failure to find the obvious. When subordinating commonsense to rigid testing protocols for the sake of valid inference, confirmatorydata analysis risks using tests and confidence intervals in assumed models thatshould never have been fitted, when EDA before, or MD after, fitting could haverevealed that the approach to the data is flawed and the structure of the datarequired altogether different methods. The danger of blind confirmatory statisticsis therefore ‘missed discovery’. This term refers to a type of failure that shouldnot be confused with either ‘false discovery’ or ‘false non-discovery’, terms nowoften used as synonyms for ‘Type I error’ and ‘Type II error’. These confirmatorynotions refer to trade-offs in deciding between pre-specified null hypothesesand alternative hypotheses. By contrast, ‘missed discovery’ refers to a state ofblindness in which the data analyst is not even aware that alternative structurein the data is waiting to be discovered, either in addition or in contradiction topresent ‘findings’. Statistics therefore needs EDA and MD because only they canforce unexpected discoveries on data analysts.It would be an oversimplification, though, if statistics were seen exclusivelyin terms of a dichotomy between the exploratory and the confirmatory. Someparts of statistics form a mix. For example, most methods for non-parametricmodelling and model selection are algorithmic forms of data exploration, but somePhil. Trans. R. Soc. A (2009)
Downloaded from rsta.royalsocietypublishing.org on January 28, 2010Statistical inference for graphics4363are given asymptotic guarantees of finding the ‘truth’ under certain conditions,or they are endowed with confidence bands that have asymptotically correctcoverage. Coming from the opposite end, confirmatory statistics has becomeavailable to ever larger parts of statistics due to inferential methods that accountfor multiplicity, i.e. for simultaneous inference for large or even infinite numbersof parameters. Multiplicity problems will stalk any attempt to wrap confirmatorystatistics around EDA and MD, including our attempt to come to grips with theinferential problems posed by visual discovery.The tools of confirmatory statistics have so far been applied only to featuresin data that have been captured algorithmically and quantitatively and our goalis therefore to extend confirmatory statistics to features in data that have beendiscovered visually, such as the surprise discovery of structure in a scatterplot(EDA), or the unanticipated discovery of model defects in residual plots (MD).Making this goal attainable requires a re-orientation of existing concepts whilestaying close to their original intent and purpose. It consists of identifying theanalogues, or adapted meanings, of the concepts of (i) test statistics, (ii) tests,(iii) null distribution, and (iv) significance levels and p-values. Beyond a oneto-one mapping between the traditional and the proposed frameworks, inferencefor visual discovery will also require considerations of multiplicity due to theopen-ended nature of potential discoveries.To inject valid confirmatory inference into visual discovery, the practice needsto be supplemented with the simple device of duplicating each step on simulateddatasets. In EDA, we draw datasets from simple generic null hypotheses; in MD,we draw them from the model under consideration. To establish full confirmatoryvalidity, there is a need to follow rigorous protocols, reminiscent of those practisedin clinical trials. This additional effort may not be too intrusive in the lightof the inferential knowledge acquired, the sharpened intuitions and the greaterclarity achieved.Inference for visual discovery has a pre-history dating back half a century.A precursor much ahead of its time, both for EDA and MD, is Scott et al. (1954).Using astronomical observations, they attempted to evaluate newly proposedspatial models for galaxy distributions (Neyman et al. 1953), by posing thefollowing question: ‘If one actually distributed the cluster centres in space andthen placed the galaxies in the clusters exactly as prescribed by the model,would the resulting picture on the photographic plate look anything like thaton an actual plate ?’ In a Herculean effort, they proceeded to generate asynthetic 6 6 ‘plate’ by choosing reasonable parameter values for the model,sampling from it, adjusting for ‘limiting magnitude’ and ‘random ‘errors’ ofcounting’, and comparing the resulting ‘plate’ of about 2700 fictitious galaxieswith a processed version of the actual plate, whose foreground objects had beeneliminated. This was done at a time when sampling from a model involvedworking with published tables of random numbers, and plotting meant drawingby hand—the effort spent on a single instance of visual evidence is stunning!The hard work was of course done by ‘computers’, consisting of an office withthree female assistants whose work was acknowledged as requiring ‘a tremendousamount of care and attention’. (The plots, real and synthetic, are reproduced inBrillinger’s 2005 Neyman lecture (Brillinger 2008), albeit with undue attributionsto Neyman. Scott et al. (1954) acknowledge Neyman only ‘for his continuedinterest and for friendly discussions’.) Much later, when computer-generatedPhil. Trans. R. Soc. A (2009)
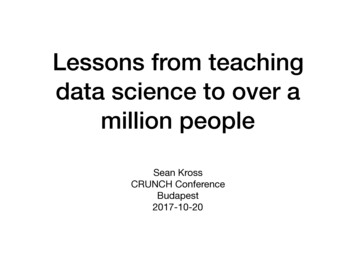
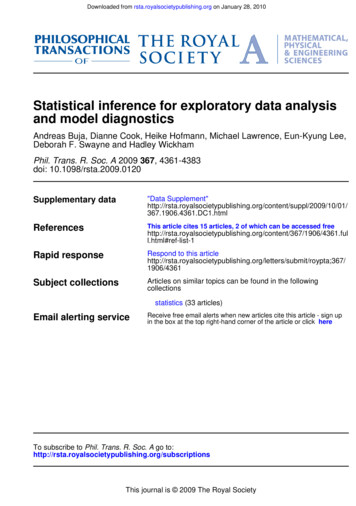
Downloaded from rsta.royalsocietypublishing.org on January 28, 20104364A. Buja et al.for real dataset ymultiple quantitative testingvisual discoverynull hypothesisnull hypothesisplot of y: visible features10collection of test statistics:864210 20 30 40 50tests: any rejections?for whichhuman viewer: anydiscoveries? What kind?Figure 1. Depiction of the parallelism between multiple quantitative testing and visual discovery.Potential features of data that can be visible in the plot are thought of as a stylized collection oftest statistics. The actually observed features in a plot (the ‘discoveries’) correspond to the teststatistics that result in rejection.plotting and sampling started to make headway into data analytic practice, thereare more examples, and also several voices urging analysts to gauge their sense forrandomness by looking at plots of random data. Daniel (1976) has 40 pages of nullplots in his book on statistics applied to industrial experiments. Diaconis (1983)describes ‘magical thinking’ as the natural human tendency to over-interpretrandom visual stimuli. Davison & Hinkley (1997) in their book on bootstrapmethods (§4.2.4) recommend overlaying lines corresponding to quantiles fromrandom samples, of the same size as the data, to normal probability plots.The practice was implemented in an early visualization system, Dataviewer, anddescribed in Buja et al. (1988; in the ‘Informal Statistical Inference’ section),some of which was revisited in the XGobi system (Swayne et al. 1992; Bujaet al. 1996, 1999). Recently, it is Bayesians who have systematized the idea ofMD as visualizing datasets simulated from statistical models (Gelman 2004 andreferences therein). In spatial statistics, Brillinger (2008) can be cited for talksthat keep alive the idea of ‘synthetic plots’, plots of data simulated from a complexmodel. In a related tenor are the ideas of Davies (2008), which are discussedfurther in §5. Also relevant to this paper is the discussion, comparison or evenrecommendation of good practice of visual methods for data analysis, for whichthere exists a rich literature (e.g. Tufte 1983; Cleveland 1993; Buja et al. 1996;Card et al. 1999; Wilkinson 1999; Chen et al. 2007).In §2, we first outline the parallelism between established tests of quantitativefeatures and proposed inference for qualitative discovery. In §3, we briefly mentionapproaches to reference distributions from which ‘null datasets’ can be sampled(with further details deferred to the electronic supplementary material). We thendiscuss protocols that specify how simulated null datasets are to be used toattain inferential validity (§§4 and 5). In the remaining sections, we illustrateour preferred protocol with several practical examples.Phil. Trans. R. Soc. A (2009)
Downloaded from rsta.royalsocietypublishing.org on January 28, 2010Statistical inference for graphics43652. Discoveries as rejections of null hypothesesHere, we outline a parallelism between quantitative testing and visual discovery.The steps are depicted in figure 1. The initial step is to take seriouslythe colloquial identification of the term ‘discovery’ with ‘rejection of a nullhypothesis’. This is entirely natural for MD, where the model constitutes thenull hypothesis, and any model defect found with diagnostics can be interpretedas rejection of the model in the sense of statistical testing. It requires someelaboration for EDA, because data analysts may not usually think of theirdiscoveries as rejections of null hypotheses. The ‘discovery’ of skewness, forexample, in univariate distributions can be taken as a rejection of symmetryor normality, and the discovery of an association can be taken as the rejectionof independence. Such null hypotheses help sharpen the understanding of a‘discovery’, because they provide a canvas of unstructured data situations uponwhich to judge the discovered structure.In EDA, the same null hypothesis can be rejected for many reasons, i.e.in favour of many possible alternatives. For example, the null assumption ofindependence between two variables can be rejected by the discovery of linear,nonlinear but smooth, discontinuous or clustered association. Similarly, in MDthe fitted model can be rejected for many reasons; in standard linear models,such reasons may be nonlinearities, skew residual distributions, heterogeneouserror variances or lurking variables. In the parallelism, this can be interpreted tobe that many ‘discoveries’ can be contrasted against a background provided bythe same null hypothesis.One arrives quickly at a critical divergence between quantitative testing andvisual discovery: quantitative testing requires the explicit prior specification of theintended ‘discoveries’; by contrast, the range of visual discoveries in EDA and MDis not pre-specified explicitly. This difference is critical because the absence of priorspecification is commonly interpreted as invalidating any inferences as post hocfallacies. This interpretation is correct if what is criticized is the naive tailoringof a quantitative statistical test to a previously made qualitative discovery onthe same data, as when the discovery of two clusters is ‘confirmed’ with a posthoc two-sample test. We address this by stylizing the set of discoverable featuresin a plot as a collection of test statistics, call them T (i) (y) (i I ), where y is thedataset and I is as yet a nebulous set of all possible features. Each test statisticT (i) (y) measures the degree of presence of a feature in the data to which thehuman viewer of the plot may respond. This collection of discoverable features,and thus, test statistics, is (i) potentially very large and (ii) not pre-specified.Of these two issues, the second is the more disconcerting because it appears tobe fatal for statistical inference.A way to address pre-specification, for a given type of plot, would beto form a list as comprehensive as possible of discoverable features and toformalize them in terms of test statistics. Such an approach has indeed beenattempted for scatterplots by Tukey & Tukey (1985) who coined the term‘scagnostics’; more recently Wilkinson et al. (2005) revived the idea with alist of features that includes ‘outlying’, ‘skewed’, ‘clumpy’, ‘sparse’, ‘striated’,‘convex’, ‘skinny’, ‘stringy’ and ‘monotonic’. Although these were not framedas formal test statistics, they are defined quantitatively and could be used assuch under any null distribution that does not have these features. Yet, anyPhil. Trans. R. Soc. A (2009)
Downloaded from rsta.royalsocietypublishing.org on January 28, 20104366A. Buja et al.such list of features cannot substitute for the wealth and surprises latent in realplots. Thus, while cumulative attempts at pre-specifying discoverable featuresare worthwhile endeavours, they will never be complete. Finally, because fewdata analysts will be willing to forego plots in favour of scagnostics (which infairness was not the intention of either group of authors), the problem of lackof pre-specification of discoverable features in plots remains as important andopen as ever.Our attempt at cutting the Gordian Knot of prior specification is by proposingthat there is no need for pre-specification of discoverable features. This can be seenby taking a closer look at what happens when data analysts hit on discoveriesbased on plots: they not only register the occurrence of discoveries, but alsodescribe their nature, e.g. the nature of the observed association in a scatterplotof two variables. Thus data analysts reveal what features they respond to andhence, in stylized language, which of the test statistics T (i) (y) (i I ) resulted inrejection. In summary, among the tests that we assume to correspond to thepossible discoveries but which we are unable to completely pre-specify, those thatresult in discovery/rejection will be known.The next question we need to address concerns the calibration of the discoveryprocess or, in terms of testing theory, the control of Type I error. In quantitativemultiple testing, one has two extreme options: for marginal or one-at-a-timeType I error control, choose the thresholds c (i) such that P(T (i) (y) c (i) y H0 ) α for all i I ; for family-wise or simultaneous Type I error control,raise the thresholds so that P(there exists i I : T (i) (y) c (i) y H0 ) α. Falsediscovery rate control is an intermediate option. Pursuing the parallelism betweenquantitative testing and visual discovery further, we ask whether the practiceof EDA and MD has an equivalent of Type I error control. Do data analystscalibrate their declarations of discovery? Do they gauge their discoveries toguarantee a low rate of spurious detection? They usually declare discoveriesby relying on past experience and trusting their judgement. In clear-cut casesof strong structure, dispensing with explicit calibration is not a problem,but in borderline cases there is a need to calibrate visual detection withoutresorting to the pseudo-calibration of post hoc quantitative tests tailored tothe discovery.We argue in favour of a protocol that attacks the problem at the level ofplots as well as data analysts’ reactions to plots. We propose to consider dataanalysts as black boxes whose inputs are plots of data and whose outputs aredeclarations of discoveries and the specifics thereof. To calibrate the discoveryprocess, simultaneously for all discoverable features T (i) (i I ), the process isapplied to ‘null datasets’ drawn from the null hypothesis, in addition to the realdataset. In this manner, we learn the performance of the discovery process whenthere is nothing to discover, which is the analogue of a null distribution. We alsoescape the post hoc fallacy because we avoid the retroactive calibration of justthe feature T (io ) that the data analyst considers as discovered. In essence, wecalibrate the family-wise Type I error rate for the whole family of discoverablefeatures T (i) (i I ), even though we may be unable to completely enumerate thisfamily. If data analysts find structure of any kind in the ‘null plots’, they willtell, and we can (i) tally the occurrences of spurious discoveries/rejections, andmore specifically we can (ii) learn the most frequent types of features T (i) thatget spuriously discovered.Phil. Trans. R. Soc. A (2009)
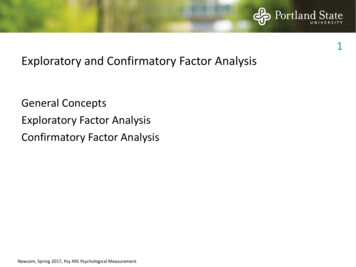
Downloaded from rsta.royalsocietypublishing.org on January 28, 20104367Statistical inference for graphicssimulation-based testingquantitativevisual108real values of test statistics: T(i) (y)plot of real dataset y64210 20 30 40 50108null values of test statistics: T(i) (y*1)plot of null dataset y*164210 20 30 40 5010null values of test statistics:T(i) (y*2)plot of null datasety*2864210 20 30 40 501086null values of test statistics: T(i) (y*R)plot of null dataset y*R4210 20 30 40 50Figure 2. Depiction of simulation-based testing.3. Reference distributions, null datasets and null plotsIn visual inference, the analogue of a collection of test statistics is a plot of thedata. Accordingly, we introduce the concept of a ‘null distribution of plots’ asthe analogue of the null distribution of test statistics. This refers conceptually tothe infinite collection of plots of ‘null datasets’ sampled from H0 . In practice, wesample a finite number (R, say) of null datasets y 1 , y 2 , . . . , y R and generate agallery of R ‘null plots’ (see figure 2 for a schematic depiction).The question that arises next is what ‘sampling from H0 ’ means becausethe null hypothesis H0 rarely consists of a single distribution. Instead, H0 isusually ‘composite’, i.e. a collection of distributions indexed by the so-called‘nuisance parameters’. Fortunately, the problem of reducing composite nullhypotheses to single ‘reference distributions’ has found several solutions instatistical theory, and three principles that can be applied are (i) conditioning,(ii) plug-in, and (iii) posterior inference. Expressed as sampling schemes,they are:(i) conditional sampling given a statistic that is minimal sufficient under H0 ,(ii) parametric bootstrap sampling whereby nuisance parameters areestimated under H0 , and(iii) Bayesian posterior predictive sampling.Phil. Trans. R. Soc. A (2009)
Downloaded from rsta.royalsocietypublishing.org on January 28, 20104368A. Buja et al.Of these approaches, the first is the least general but when it applies it yields anexact theory. It does apply to the examples used in this paper: null hypotheses ofindependence in EDA, and of normal linear models in MD. The resulting referencedistributions are, respectively:EDA: permutation distributions, whereby the observed values are subjected torandom permutations within variables or blocks of variables; andMD: ‘residual rotation distributions’, whereby random vectors are sampled inresidual space with length to match the observed residual vector.Of the two, the former are well known from the theory of permutation tests,but the latter are lesser known and were apparently explicitly introduced onlyrecently in a theory of ‘rotation tests’ by Langsrud (2005). When H0 consistsof a more complex model where reduction with a minimal sufficient statistic isunavailable, parametric bootstrap sampling or posterior predictive sampling willgenerally be available. More details on these topics can be found in the electronicsupplementary material. We next discuss two protocols for the inferential use ofnull plots based on null datasets drawn from reference distributions according toany of the above principles.4. Protocol 1: ‘the Rorschach’We call the first protocol ‘the Rorschach’, after the test that has subjects interpretinkblots, because the purpose is to measure a data analyst’s tendency to overinterpret plots in which there is no or only spurious structure. The measure isthe family-wise Type I error rate of discovery, and the method is to expose the‘discovery black box’, meaning the data analyst, to a number of null plots andtabulate the proportion of discoveries which are by construction spurious. It yieldsresults that are specific to the particular data analyst and context of data analysis.Different data analysts would be expected to have different rates of discovery, evenin the same data analysis situation. The protocol will bring a level of objectivityto the subjective and cultural factors that influence individual performance.The Rorschach lends itself to cognitive experimentation. While reminiscent ofthe controversial Rorschach inkblot test, the goal would not be to probe individualanalysts’ subconscious, but to learn about factors that affect their tendency tosee structure when in fact there is none. This protocol estimates the effectivefamily-wise Type I error rate but does not control it at a desired level.Producing a rigorous protocol requires a division of labour between a protocoladministrator and the data analyst, whereby the administrator (i) generates thenull plots to which the data analyst is exposed and (ii) decides what contextualprior information the data analyst is permitted to have. In particular, the dataanalyst should be left in uncertainty as to whether or not the plot of the real datawill appear among the null plots; otherwise, knowing that all plots are null plots,the data analyst’s mind would be biased and prone to complacency. Neither theadministrator nor the data analyst should have seen the plot of the real dataso as not to bias the process by leaking information that can only be gleanedfrom the data. To ensure protective ignorance of all parties, the administratormight programme the series of null plots in such a way that the plot of the realdata is inserted with known probability in a random location. In this manner, thePhil. Trans. R. Soc. A (2009)
Downloaded from rsta.royalsocietypublishing.org on January 28, 2010Statistical inference for graphics4369administrator would not know whether or not the data analyst encountered thereal data, while the data analyst would be kept alert because of the possibilityof encountering the real data. With careful handling, the data analyst can inprinciple self-administer the protocol and resort to a separation of roles with anexternally recruited data analyst only in the case of inadvertent exposure to theplot of the real data.While the details of the protocol may seem excessive at first, it should bekept in mind that the rigour of today’s clinical trials may seem excessive to theuntrained mind as well, and yet in clinical trials this rigour is accepted and heavilyguarded. Data analysts in rigorous clinical trials may actually be best equipped towork with the proposed protocol because they already adhere to strict protocolsin other contexts. Teaching environments may also be entirely natural for theproposed protocol. Teachers of statistics can put themselves in the role of theadministrator, while the students act as data analysts. Such teaching practice ofthe protocol would be likely to efficiently develop the students’ understanding ofthe nature of structure and of randomness.In the practice of data analysis, a toned-down version of the protocol maybe used as a self-teaching tool to help data analysts gain a sense for spuriousstructure in datasets of a given size in a given context. The goal of the trainingis to allow data analysts to informally improve their family-wise error rate anddevelop an awareness of the features they are most likely to spuriously detect.The training is of course biased by the analysts’ knowledge that they are lookingexclusively at null plots. In practice, however, the need for looking at some nullplots is often felt only after having looked at the plot of the real data and havingfound merely weak structure. Even in this event, the practice of looking at nullplots is useful for gauging one’s senses, though not valid in an inferential sense.Implementing this protocol would effectively mean inserting an initial layer intoa data analysis—before the plot of the real data is revealed a series of null plotsis shown.5. Protocol 2: ‘the lineup’We call the second protocol ‘the lineup’, after the ‘police lineup’ of criminalinvestigations (‘identity parade’ in British English), because it asks the witness toidentify the plot of the real data from among a set of decoys, the null plots, underthe veil of ignorance. The result is an inferentially valid p-value. The protocolconsists of generating, say, 19 null plots, inserting the plot of the real data ina random location among the null plots and asking the human viewer to singleout one of the 20 plots as most different from the others. If the viewer choosesthe plot of the real data, then the discovery can be assigned a p-value of 0.05( 1/20)—under the assumption that the
Exploratory data analysis (EDA) and model diagnostics (MD) are two data analytic activities that rely primarily on visual displays and only secondarily on numeric summaries. EDA, as championed by Tukey (1965), is the free-wheeling search for structure that allows d