Transcription
International Journal ofGeo-InformationArticleUsing Visual Exploratory Data Analysis to FacilitateCollaboration and Hypothesis Generation inCross-Disciplinary ResearchXiaogang Ma 1, * ID , Daniel Hummer 2 , Joshua J. Golden 3 , Peter A. Fox 4 , Robert M. Hazen 5 ,Shaunna M. Morrison 5 ID , Robert T. Downs 3 , Bhuwan L. Madhikarmi 1 , Chengbin Wang 1,6and Michael B. Meyer 5123456*Department of Computer Science, University of Idaho, 875 Perimeter Drive, MS 1010, Moscow,ID 83844-1010, USA; madh9981@vandals.uidaho.edu (B.L.M.); cwang@uidaho.edu (C.W.)Department of Geology, Southern Illinois University Carbondale, 1263 Lincoln Drive, Carbondale, IL 62901,USA; daniel.hummer@siu.eduDepartment of Geosciences, University of Arizona, 1040 E. 4th Street, Tucson, AZ 85721, USA;jgolden@email.arizona.edu (J.J.G.); rdowns@email.arizona.edu (R.T.D.)Tetherless World Constellation, Rensselaer Polytechnic Institute, 110 8th Street, Troy, NY 12180, USA;pfox@cs.rpi.eduGeophysical Laboratory, Carnegie Institution for Science, 5251 Broad Branch Road, NW, Washington,DC 20015, USA; rhazen@carnegiescience.edu (R.M.H.); smorrison@carnegiescience.edu (S.M.M.);mmeyer@carnegiescience.edu (M.B.M.)State Key Laboratory of Geological Processes and Mineral Resources & Faculty of Earth Resources,China University of Geosciences, 388 Lumo Road, Wuhan 430074, ChinaCorrespondence: max@uidaho.edu; Tel.: 1-208-885-1547Received: 6 October 2017; Accepted: 15 November 2017; Published: 16 November 2017Abstract: Massive open data resources are changing the way that people do science. To make useof those data resources, data science methods and technology can be leveraged by stakeholdersof various disciplines. The objective of this paper is to present our experience of using visualexploratory data analysis as a method to facilitate collaboration and hypothesis generation ingeoscience research. The research team consisted of both geoscientists and computer scientists.A use case-driven, iterative approach was applied to create a collaborative and communicativeenvironment. Through several rounds of use case analysis and technological development, a datavisualization pilot system was created for studying the co-relationships between chemical elementsand mineral species. The exploratory data analyses conducted in those use case studies led to severalresearch hypotheses for future work. This research illustrates the usefulness of exploratory dataanalysis for hypothesis generation in a data science process. Although the presented project is ingeoscience, the discussed method and experience can also be translated into other disciplines.Keywords: exploratory data analysis; data visualization; data science; geoinformatics; mineral ecology1. IntroductionThe open data movement is changing the way that people do science [1–3]. A conventional processof scientific research begins with background study and hypothesis generation. Then data will becollected in experiments and the results of data analysis will be used to approve or revise the hypothesis.With abundant datasets made freely accessible through the open data movement, researchers can nowretrieve massive datasets from the open data environment on the Web [4]. However, researchers oftenstruggle to develop hypotheses despite the abundance of data available to them. In this new era ofscience, methods and tools are desired to help researchers generate and test hypotheses.ISPRS Int. J. Geo-Inf. 2017, 6, 368; doi:10.3390/ijgi6110368www.mdpi.com/journal/ijgi
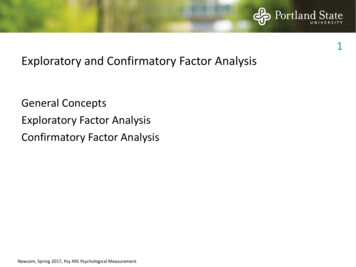
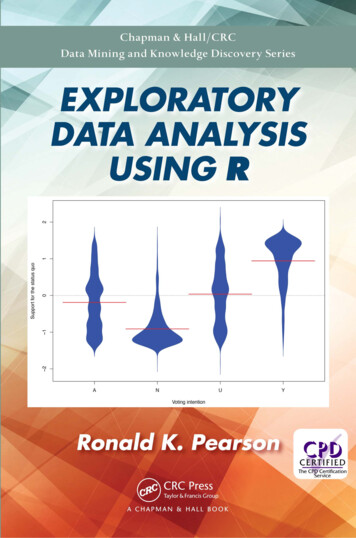
ISPRS Int. J. Geo-Inf. 2017, 6, 3682 of 11ISPRS Int. J. Geo-Inf. 2017, 6, 3682 of 11to them. In this new era of science, methods and tools are desired to help researchers generate andtest hypotheses.StudiesData sciencescience isis thethe studystudyStudies inin datadata sciencescience cancan provideprovide methodsmethods toto addressaddress thisthis challenge.challenge. a[5].Thetheoreticalfoundationsofdatascienceof the generalizable extraction of knowledge from data [5]. The theoretical foundations of data sciencehavethe disciplinesdisciplines ofof mathematics,mathematics, statistics,statistics, computercomputer science,science, andand moremore [6].[6].have strongstrong connectionsconnections toto taanalysis(EDA)isusedasastepforhypothesisIn the field of statistics, the method of exploratory data analysis (EDA) is used as a step for tatisticalhypothesistesting)[7,8].generation Inrecentyears, EDAbeensuggestedby data scientists[3] as an effectivefor pattern[7,8].In recentyears,hasEDAhasbeen suggestedby data scientists[3] as anstepeffectivestep recognitionfor s(Figure1).Theterm“exploratory”therecognition and hypothesis generation in a data science process (Figure 1). The term represents“exploratory”characteristicsthe method: TheEDAprocessis flexibleand theis anduncertain,so itiscanbe usedrepresents the ofcharacteristicsof themethod:TheEDA processis resultflexiblethe elievedtobepresentorabsent[9].so it can be used to search for characteristics that are believed to be present or absent [9].Figure(adapted fromfrom [3]).[3]).Figure 1.1. KeyKey stepssteps inin aa datadata sciencescience processprocess (adaptedThe data science process featured in EDA is comparable to the approach of data-drivenThe data science process featured in EDA is comparable to the approach of data-driven abductiveabductive discovery [10–12]. Abduction is defined as the formation of a plausible explanation for andiscovery [10–12]. Abduction is defined as the formation of a plausible explanation for an observedobserved phenomenon [13]. Charles S. Peirce (1839–1914) viewed abduction as the first stage ofphenomenon [13]. Charles S. Peirce (1839–1914) viewed abduction as the first stage of scientificscientific reasoning, i.e., to create a hypothesis [14]. Following abduction, deduction is carried out toreasoning, i.e., to create a hypothesis [14]. Following abduction, deduction is carried out to refine therefine the hypothesis based on other plausible premises and to determine the specific evidencehypothesis based on other plausible premises and to determine the specific evidence needed to supportneeded to support the hypothesis. Finally, induction is used to extrapolate a general rule or principlethe hypothesis. Finally, induction is used to extrapolate a general rule or principle from the findings.from the findings. Abduction and deduction are a part of the conceptual understanding of aAbduction and deduction are a part of the conceptual understanding of a phenomenon, and inductionphenomenon, and induction is the quantitative verification. Ho [10] used a short sentence tois the quantitative verification. Ho [10] used a short sentence to summarize the interactions among thesummarize the interactions among the three concepts: “Abduction creates, deduction explicates, andthree concepts: “Abduction creates, deduction explicates, and induction verifies”. This process fitsinduction verifies”. This process fits well with the two steps of EDA and CDA in the data sciencewell with the two steps of EDA and CDA in the data science process (Figure 1). For a domain-specificprocess (Figure 1). For a domain-specific study that aims to leverage abduction and the data sciencestudy that aims to leverage abduction and the data science process, Hazen’s summary [11] might alsoprocess, Hazen’s summary [11] might also be useful: deduction and induction are to discover whatbe useful: deduction and induction are to discover what we know we do not know, and abduction iswe know we do not know, and abduction is to discover what we do not know we do not know.to discover what we do not know we do not know.Data visualization is an efficient way to display the results of a data science process [15,16]. InData visualization is an efficient way to display the results of a data science process [15,16].recent years, researchers have also proposed that data visualization should be applied in each step ofIn recent years, researchers have also proposed that data visualization should be applied in eachthe data science process rather than only for the end product [17]. In EDA for statistics, datastep of the data science process rather than only for the end product [17]. In EDA for statistics,visualization is an essential part of quantitative datasets. Many visualization techniques have alreadydata visualization is an essential part of quantitative datasets. Many visualization techniques havebeen developed, such as scatter plots, box plots, histograms, stem-and-lead plots, and more. For EDAalready been developed, such as scatter plots, box plots, histograms, stem-and-lead plots, and more.in cross-disciplinary studies, other types of visualization techniques may also be applied, such asFor EDA in cross-disciplinary studies, other types of visualization techniques may also be applied,mind maps [18], conceptual maps [19], and workflow visualizations [20]. Through the usage of thosesuch as mind maps [18], conceptual maps [19], and workflow visualizations [20]. Through the usage ofvisualization techniques, researchers from different backgrounds can quickly obtain an overview ofthose visualization techniques, researchers from different backgrounds can quickly obtain an overviewthe subject under study, gain insights about the datasets, and discuss hypotheses for the focusedof the subject under study, gain insights about the datasets, and discuss hypotheses for the focusedwork of the next step [21,22].work of the next step [21,22].
ISPRS Int. J. Geo-Inf. 2017, 6, 3683 of 11The domain of Earth and space sciences, like other disciplines, faces opportunities raised by opendata, and requires methods and technologies to help transform massive amounts of data into meaningfulinformation [23,24]. The objective of this paper is to present our experience of applying visual EDAto facilitate cross-disciplinary research collaboration and hypothesis generation. A few use cases ofapplying a three-dimensional matrix to show co-relationships among chemical elements and mineralspecies will be used to demonstrate the collaborative process. The increasing complexity of datasetsand research discussions along with those use cases also reflects the effectiveness of this method forformulating hypotheses. The presented use cases are from studies of mineral evolution in the DeepTime Data Infrastructure (DTDI) [25], a research initiative that joins data science with geoscience andbioscience to study the co-evolution of Earth systems. The remainder of this paper is organized as follows:Section 2 describes the data sources of this study, the methods of visual EDA, and the design of a workflow;Section 3 presents a demonstration system that implements the designed workflow, and also demonstratesthe usefulness the system through a few focused use cases; Section 4 highlights several research topics inthe data science process and lists a few topics for future work; and, finally, Section 5 concludes the paper.2. Datasets and MethodsMore than 5000 mineral species have been discovered on Earth. Each mineral species is a naturalchemical compound characterized by a definite crystalline structure. Through the studies of chemistry,physical properties, crystal structure, and geographical distribution of those mineral species, the geosciencecommunity has built many reusable data resources. For example, the database of Raman spectroscopy,X-ray diffraction and chemistry of minerals (RRUFF) [26] aims at creating and sharing a complete set ofhigh-quality spectral data from well-characterized minerals. The collected data [27] provide a standard forstructural, spectroscopic, and chemical mineral identification, and can be used in studies of Earth and otherplanets. RRUFF also hosts a continually updated list of mineral names that are officially accepted by theInternational Mineralogical Association (IMA) and the detailed source information of those minerals [28].The website of the IMA mineral list [29] provides an interactive user interface that allows users to searchthe list and the source information in various ways and download for research uses. Another usefuldata resource is Mindat [30], a crowd-sourced website that collects and shares information about mineralspecies, their properties, and their geographic distribution on Earth.The abundant datasets about minerals and their properties have initiated new ideas and studiesin recent years. DTDI is an integrated program that leverages various existing data sources to discoverpatterns in the evolution of Earth’s environment, including the geosphere and biosphere. One of theumbrella research themes in DTDI is mineral evolution—the mineralogy of terrestrial planets and moonsevolves as a consequence of a range of physical, chemical, and biological processes that lead to theformation of new mineral species [31]. In the past few years, several new findings have been reported.One of them is the pattern of Large Number of Rare Events (LNRE) in the frequency distribution of mineralspecies [32]. By extrapolations from the LNRE model, researchers can predict how many new mineralspecies can be discovered at an assumed larger observation size. Going further from that work, studies onthe population probabilities of all mineral species have led to the characterization and comparison ofEarth-like planets [33,34].To leverage more studies with those open data mineral resources, we designed and developeda pilot system that can be used to support EDA in the multidisciplinary data science process (Figure 1)of the above-mentioned mineral evolution research. Our idea was to construct a three-dimensional(3D) matrix to visualize co-relationships among mineral-forming chemical elements and mineralspecies found on Earth. The three axes in this matrix, X, Y, and Z, were identical lists of arrangedchemical elements. A simple example was to list 30 key mineral-forming elements along each axis.This 30 30 30 3D matrix resulted in 27,000 cells, in which we could assign different values,such as the raw number of minerals in which elements X, Y, and Z co-exist. If each cell was renderedin a color according to the value of the number inside it, then the 3D matrix could reveal patterns inthe co-relationships among elements and minerals, such as clusters of high mineral species numbers
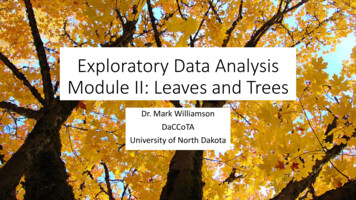
ISPRS Int. J. Geo-Inf. 2017, 6, 3684 of 11for the element triplets F-Si-O, Na-Si-O, Mg-Si-O, Al-Si-O, F-Al-O, Na-Al-O, and Mg-Al-O. We alsodeveloped functions to manipulate the matrix, so that a user could rotate the matrix, zoom in andout, select and highlight certain cubes or patterns, and slice one or more two-dimensional planesout from the matrix to see patterns of interest. Those detected patterns may lead to the formation ofresearch hypotheses for further works, such as why oxygen has the highest number of mineral speciesamong all mineral-forming elements. Such a visualization system is easy to understand and operatefor both geologists and data scientists. It lowers the barrier of communication between collaborators,and facilitate discussion on research topics.The multidisciplinary collaboration in DTDI follows the data science steps shown in Figure 1.The pilot system played an important role in the EDA step. Before carrying out EDA, data collectionand data pre-processing were conducted by DTDI team members who were familiar with the subject,structure, and format of datasets in RRUFF, the IMA mineral list, and Mindat. The resulting cleandata were well-organized in a sample structure, which saved a great deal of time for data scienceteam members when it came to loading and visualizing the data in the 3D matrix of the pilot system.A few meaningful visualization outputs from the EDA could be published as research results directly.The case studies in the next section will illustrate a few visualization outputs of this kind, such as theco-relations between primary and secondary cobalt minerals shown in Figure 5. Another relevantDTDI research of network analysis and visualization [35] also revealed a similar EDA approach butapplied different techniques. Those visualization results and recognized patterns were used in researchdiscussions and to support decision-making. Derived datasets could be published, shared, and reusedin other research (i.e., another round of the data science process).3. Implementation and Case StudiesThe team that conducted this research consisted of geoscience and computer science researchers withcomplementary academic backgrounds in minerology, paleontology, data management, data visualization,and data analysis. A use case-driven iterative approach [36,37] was applied throughout the whole work tofacilitate the interactions among team members. Several use case studies were conducted in this researchwith an iterative process. For computer scientists, this iterative approach helped refine the functions of thedeveloped pilot system because each use case had unique datasets and data visualization requirements.For geoscientists, the information revealed through the EDA of each use case was meaningful and ledto the discussion of more research topics. We used comma separated values (CSV) as the file format forthe dataset, and reused a JavaScript library three.js [38] to develop the visualization. The current pilotsystem was made accessible online [39]. The source code and datasets of the demo system were shared onGithub [40].Our first use case was the co-existence of key elements in minerals. The objective of this case studywas to examine the correlation between triplets of elements by counting the number of mineral speciesin which those three elements co-exist. By plotting the same list of 30 key mineral-forming elementsalong each axis of a 3D coordination system, we constructed a 30 30 30 matrix. We then referredto the RRUFF and the IMA mineral list to find the numbers of minerals in which elements X, Y, and Zcoexist, and filled those numbers into the corresponding 27,000 cells in the 3D matrix. Subsequently,we developed a color spectrum according to the range of the numbers in the matrix, and applied thespectrum to the matrix to render each cell with a color. Figure 2a shows an initial output from thefirst use case. Subsequently, the geoscientists team members offered suggestions on how to makethe visualization outputs easier to operate and more meaningful from the geoscience perspective.By using the developed functions, geoscientists could manipulate the 3D matrix, sliced out planes,conduct transformations, and observed the clustering patterns (Figure 2b–e). Through this use case,the basic visualization toolkits were set up. Although the clusters of high values in the matrix clearlydemonstrate there are more minerals for certain elements, the mineralogists in the research teamwanted a deeper view of the relationship. This led to the second use case.
ISPRS Int. J. Geo-Inf. 2017, 6, 3685 of 11ISPRS Int. J. Geo-Inf. 2017, 6, 3685 of 11(a)(b)(c)(d)(e)Figure 2. Pilot system for the exploratory data analysis of co-relationships among elements andFigure 2. Pilot system for the exploratory data analysis of co-relationships among elements and minerals.minerals. (a) An initial output by visualizing the raw mineral counts; (b) output after taking a(a) An initial output by visualizing the raw mineral counts; (b) output after taking a logarithmic calculationlogarithmic calculation of the mineral counts in each cell; (c) changes in the opacity of each cell basedof the mineral counts in each cell; (c) changes in the opacity of each cell based on the value of the mineralon the value of the mineral counts. The cell filled with solid red (lower right) has oxygen on all threecounts. The cell filled with solid red (lower right) has oxygen on all three axes. It has the highest mineralaxes. It has the highest mineral count, 4138, in the whole matrix; (d) sliced-out two-dimensional planescount,4138,in the whole(d)asliced-outtwo-dimensionalplanessee the onpatterns.Hereandit showsto seethe patterns.Herematrix;it showsplane for oxygen,i.e., oxygenis thetoelementthe Z-axis;(e)a and(e)changingthedistancebetweencellschanging the distance between cells along one or more axes to see patterns in a two- or onealongone or moreaxes to see patterns in a two- or one-dimensional waswasaasmallsmallresearchresearch topictopic initiatedoutputof objectiveobjectiveasas thethe firstfirst useelementsin inmineraluseusecase.It Ithaduse casecase atasets.InIn thethe firstfirst usewasthethemineralspecies,butwithuse case,case, lacedbyoneinwhichthecellvaluesrepresentedcounts. In the second use case, the dataset was replaced by one in which the cell values representedfraction of minerals containing an element on the Z-axis that also contain both X- and Y-axes. Athethefractionof minerals containing an element on the Z-axis that also contain both X- and Y-axes.new function developed in the pilot system was to show attributes of a matrix cell when the cursorA new function developed in the pilot system was to show attributes of a matrix cell when the cursor
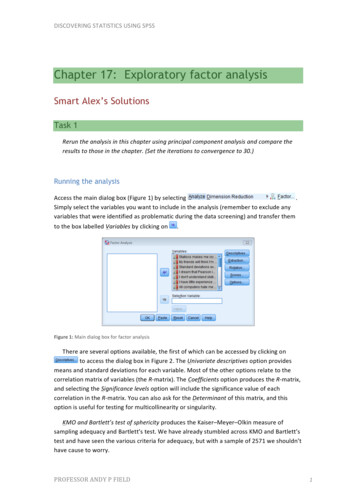
ISPRS Int. J. Geo-Inf. 2017, 6, 3686 of 11ISPRS Int. J. Geo-Inf. 2017, 6, 3686 of 11is placed over it. In Figure 3, the plane of oxygen is sliced out such that oxygen is the Z element for allis placed over it. In Figure 3, the plane of oxygen is sliced out such that oxygen is the Z element forcells on the plane. When a user moves the cursor over the cells in the plane, the cell below the cursorall cells on the plane. When a user moves the cursor over the cells in the plane, the cell below theis highlighted and the attributes of that cell will be shown on top of the 3D matrix in the browsercursor is highlighted and the attributes of that cell will be shown on top of the 3D matrix in thewindow. In Figure 3, the shown attributes read ‘X: Ca, Y: Ca, Z: O, Mineral fraction value: 0.297970034’.browser window. In Figure 3, the shown attributes read ‘X: Ca, Y: Ca, Z: O, Mineral fraction value:This means that about 29.8% of minerals containing oxygen also contain calcium. After finished the0.297970034’. This means that about 29.8% of minerals containing oxygen also contain calcium. Afterfirst two use cases with the 30 key mineral-forming elements, the research team decided to expand thefinished the first two use cases with the 30 key mineral-forming elements, the research team decidedscope of the dataset, and move on to all 72 mineral-forming elements.to expand the scope of the dataset, and move on to all 72 mineral-forming elements.Figure 3. Use a ‘mouse over’ operation to see attributes of a matrix cell. The cell below the cursor isFigure 3. Use a ‘mouse over’ operation to see attributes of a matrix cell. The cell below the cursor ishighlighted,and the attributes of the cell is shown on the top of the window. The value ‘0.297970034’highlighted, and the attributes of the cell is shown on the top of the window. The value ‘0.297970034’means that about 29.8% of minerals containing oxygen also contain calcium.means that about 29.8% of minerals containing oxygen also contain calcium.In the third use case, we expanded the dataset to cover all 72 mineral-forming elements.In the third useexpandeddataset tocoverall 72elements.Correspondingly,a 72 case, 72 we72 matrixwastheconstructedwitha samelistmineral-formingof 72 elements alongeachCorrespondingly,a 72 72 72 matrixwas constructeda same listtestof 72toelementseachaxis.Instead of fillingrawmineralnumbers,we used witha chi-squaredgeneratealongvaluesin axis.theInstead offillingraw3Dmineralnumbers,weofuseda chi-squaredto generatevalues in‘Doesthe 373,248cells of373,248cellsof thematrix.The aimthosevalues is totestanswerthe questionthe presencetheelement3D matrix.The aimthose valuesis to answerthe questionthe presenceof elementZ affect theofZ affecttheofcorrelationbetweenelementsX and ‘DoesY in mineralspecies?’For example,incorrelationX andcellsY incorrespondingmineral species?’ForO-Hexample,Figure 4 therows ofred andFigure4 thebetweenrows ofelementsred and blueto theplaneinhighlightdifferentelements’blue cells correspondingto theO-H planedifferent elements’with hydratedassociationwith hydratedminerals.ThehighlightZ axis, representingall theassociationelements pairingwith Ominerals.and H,TheZ axis,inrepresentingthe elementspairing withO and H, iselementsshown inthatdarkcorrelateblue. Cellsthat aretocoloredisshowndark blue. allCellsthat are coloredred representstronglyO–Hred representelementsto O–Helementsbearing minerals,and cells coloredbearingminerals,and thatcellscorrelatecolored stronglyblue representthat are anti-correlatedtoblueO–Hrepresentbearingelements Thesecommonresults indicatethat mentsare veryin hydratedmineralspecies,very commonin hydratedmineralspecies, whileothersareisrarelyfound inhydratedminerals.Thisiswhileothers arerarely foundin hydratedminerals.Thisan entirelynewresult gainedfromthisan entirelynewresultgained fromtothisusecase, andregardingleads geoscientiststo newquestionsusecase, andleadsgeoscientistsnewquestionswhat causesan elementtoregardingassociate whatwithcauses an minerals.element to associate with hydrated minerals.hydrated
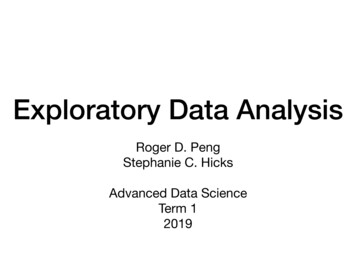
ISPRS Int.ISPRSInt. J.J. Geo-Inf.Geo-Inf. 2017,2017, 6,6, 36836877ofof1111ISPRS Int. J. Geo-Inf. 2017, 6, 3687 of 11Figure 4. Visualization of a 72 72 72 matrix in the developed pilot system. The rows of red andFigure4. VisualizationVisualization of72 72Figure4.of aa 7272 ue cells are corresponding to the O-H plane, and they highlight different elements’ association highlightdifferentelements’associationwithblue hydratedcells are ntelements’associationwith(i.e., O–H bearing) minerals.hydratedhydrated (i.e.,(i.e., O–HO–H bearing)bearing) minerals.minerals.The above three use cases helped the team develop most of the functions in the pilot system.The abovethree usetocaseshelpedthe teamof theandfunctionsthe pilotsystem.Withminor adaptionthe code,the systemwas developalsoused mosttovisualizeanalyze indatasetsin a fewThe abovethree use caseshelpedthe teamdevelopmostof the functionsin the pilotsystem.Withotherminoradaptionto thecode,wasthethesystemalso used tovisualizeand analyzedatasetsin a fewusecases. Oneof themstudywasof co-relationsbetweenprimaryand secondarycobaltWith minor adaption to the code, the system was also used to visualize and analyze datasets in a few othermineralis anyof mineralformedduringprimarythe originalsolidificationother(Co)use minerals.cases. OneA ofprimarythem wasthe studyco-relationsbetweenand secondarycobaltuse cases. One of them was the study of co-relations between primary and secondary cobalt (Co) ) minerals. A primary mineral is any mineral formed during the original solidificationA primarymineralis anymineral formed duringthe originalInsolidificationof the hostprocessessuchashydrothermaland ystallization)of thehost igneous alterationrock. A secondarymineral nsionalmatrix.processes such as hydrothermal alteration and weathering. In this use case, the raw datasets werealterationweathering.In this usecase,fromthe rawdatasetswerecollectedfromMindatand theFigureand5 showsthe visualizationoutputthe pilotsystem.Rowsof highervaluesin Figure5b IMAcollected from Mindat and the IMA mineral list, and were organized in a two-dimensional matrix.showa clearcorrelationof certainCo mineralsarisingwith5certainCo minerals,minerallist,and wereorganizedin the visualizationoutputFigure 5 shows the visualization output from the pilot system. Rows of higher values in Figure 5bat certaingeologicThis typeof previouslyunrecognizedis ofof certaingreat interestto Cofrom andthe pilotsystem.Rowstime.of highervaluesin Figure 5bshow a stsa clear correlationof research.certain secondary Co minerals arising with certain primary Co minerals,for furthermineralsarising withcertainprimary Co minerals, and at certain geologic time. This type of previouslyand at certain geologic time. This type of previously unrecognized correlation is of great interest tounrecognized correlation is of great interest to geoscientists for further research.geoscientists for further research.(a)(b)(a)(b)Figure 5. Cont.
ISPRS Int. J. Geo-Inf. 2017, 6, 3688 of 11ISPRS Int. J. Geo-Inf. 2017, 6, 3688 of 11(c)Figure 5. Visualization outputs showing co-relations between primary and secondary cobalt minerals.Figure 5. Visualization outputs showing co-relations between primary and secondary cobalt minerals.Minerals are arranged by their first occurrence time (old to young: left to right along the horizontalMinerals are arranged by thei
exploratory data analysis as a method to facilitate collaboration and hypothesis generation in geoscience research. The research team consisted of both geoscientists and computer scientist