Transcription
Hands-On Exploratory DataAnalysis with Python1FSGPSN &%" UFDIOJRVFT UP VOEFSTUBOE TVNNBSJ[F BOEJOWFTUJHBUF ZPVS EBUBSuresh Kumar MukhiyaUsman AhmedBIRMINGHAM - MUMBAI
Hands-On Exploratory Data Analysis withPythonCopyright a 2020 Packt PublishingAll rights reserved. No part of this book may be reproduced, stored in a retrieval system, or transmitted in any formor by any means, without the prior written permission of the publisher, except in the case of brief quotationsembedded in critical articles or reviews.Every effort has been made in the preparation of this book to ensure the accuracy of the information presented.However, the information contained in this book is sold without warranty, either express or implied. Neither theauthor(s), nor Packt Publishing or its dealers and distributors, will be held liable for any damages caused or allegedto have been caused directly or indirectly by this book.Packt Publishing has endeavored to provide trademark information about all of the companies and productsmentioned in this book by the appropriate use of capitals. However, Packt Publishing cannot guarantee the accuracyof this information.Commissioning Editor: Pravin DhandreAcquisition Editor: Ali AbidiContent Development Editor: Nathanya DiasSenior Editor: Ayaan HodaTechnical Editor: Manikandan KurupCopy Editor: Safis EditingProject Coordinator: Aishwarya MohanProofreader: Safis EditingIndexer: Rekha NairProduction Designer: Deepika NaikFirst published: March 2020Production reference: 1270320Published by Packt Publishing Ltd.Livery Place35 Livery StreetBirminghamB3 2PB, UK.ISBN 978-1-78953-725-3XXX QBDLU DPN
1Exploratory Data AnalysisFundamentalsThe main objective of this introductory chapter is to revise the fundamentals of ExploratoryData Analysis (EDA), what it is, the key concepts of profiling and quality assessment, themain dimensions of EDA, and the main challenges and opportunities in EDA.Data encompasses a collection of discrete objects, numbers, words, events, facts,measurements, observations, or even descriptions of things. Such data is collected andstored by every event or process occurring in several disciplines, including biology,economics, engineering, marketing, and others. Processing such data elicits usefulinformation and processing such information generates useful knowledge. But an importantquestion is: how can we generate meaningful and useful information from such data? Ananswer to this question is EDA. EDA is a process of examining the available dataset todiscover patterns, spot anomalies, test hypotheses, and check assumptions using statisticalmeasures. In this chapter, we are going to discuss the steps involved in performing topnotch exploratory data analysis and get our hands dirty using some open source databases.As mentioned here and in several studies, the primary aim of EDA is to examine what datacan tell us before actually going through formal modeling or hypothesis formulation. JohnTuckey promoted EDA to statisticians to examine and discover the data and create newerhypotheses that could be used for the development of a newer approach in data collectionand experimentations.In this chapter, we are going to learn and revise the following topics:Understanding data scienceThe significance of EDAMaking sense of dataComparing EDA with classical and Bayesian analysisSoftware tools available for EDAGetting started with EDA
Exploratory Data Analysis FundamentalsChapter 1Understanding data scienceLet's get this out of the way by pointing out that, if you have not heard about data science,then you should not be reading this book. Everyone right now is talking about data sciencein one way or another. Data science is at the peak of its hype and the skills for datascientists are changing. Now, data scientists are not only required to build a performantmodel, but it is essential for them to explain the results obtained and use the result forbusiness intelligence. During my talks, seminars, and presentations, I find several peopletrying to ask me: what type of skillset do I need to learn in order to become a top-notch datascientist? Do I need to get a Ph.D. in data science? Well, one thing I could tell you straightaway is you do not need a Ph.D. to be an expert in data science. But one thing that peoplegenerally agree on is that data science involves cross-disciplinary knowledge fromcomputer science, data, statistics, and mathematics. There are several phases of dataanalysis, including data requirements, data collection, data processing, data cleaning,exploratory data analysis, modeling and algorithms, and data product andcommunication. These phases are similar to the CRoss-Industry Standard Process for datamining (CRISP) framework in data mining.The main takeaway here is the stages of EDA, as it is an important aspect of data analysisand data mining. Let's understand in brief what these stages are:Data requirements: There can be various sources of data for an organization. It isimportant to comprehend what type of data is required for the organization to becollected, curated, and stored. For example, an application tracking the sleepingpattern of patients suffering from dementia requires several types of sensors'data storage, such as sleep data, heart rate from the patient, electro-dermalactivities, and user activities pattern. All of these data points are required tocorrectly diagnose the mental state of the person. Hence, these are mandatoryrequirements for the application. In addition to this, it is required to categorizethe data, numerical or categorical, and the format of storage and dissemination.Data collection: Data collected from several sources must be stored in the correctformat and transferred to the right information technology personnel within acompany. As mentioned previously, data can be collected from several objects onseveral events using different types of sensors and storage tools.Data processing: Preprocessing involves the process of pre-curating the datasetbefore actual analysis. Common tasks involve correctly exporting the dataset,placing them under the right tables, structuring them, and exporting them in thecorrect format.[9]
Exploratory Data Analysis FundamentalsChapter 1Data cleaning: Preprocessed data is still not ready for detailed analysis. It mustbe correctly transformed for an incompleteness check, duplicates check, errorcheck, and missing value check. These tasks are performed in the data cleaningstage, which involves responsibilities such as matching the correct record,finding inaccuracies in the dataset, understanding the overall data quality,removing duplicate items, and filling in the missing values. However, how couldwe identify these anomalies on any dataset? Finding such data issues requires usto perform some analytical techniques. We will be learning several suchanalytical techniques in IBQUFS , Data Transformation. To understand briefly,data cleaning is dependent on the types of data under study. Hence, it is mostessential for data scientists or EDA experts to comprehend different types ofdatasets. An example of data cleaning would be using outlier detection methodsfor quantitative data cleaning.EDA: Exploratory data analysis, as mentioned before, is the stage where weactually start to understand the message contained in the data. It should be notedthat several types of data transformation techniques might be required duringthe process of exploration. We will cover descriptive statistics in-depth in Section2, IBQUFS , Descriptive Statistics, to understand the mathematical foundationbehind descriptive statistics. This entire book is dedicated to tasks involved inexploratory data analysis.Modeling and algorithm: From a data science perspective, generalized modelsor mathematical formulas can represent or exhibit relationships among differentvariables, such as correlation or causation. These models or equations involveone or more variables that depend on other variables to cause an event. Forexample, when buying, say, pens, the total price of pens(Total) price for onepen(UnitPrice) * the number of pens bought (Quantity). Hence, our model would beTotal UnitPrice * Quantity. Here, the total price is dependent on the unit price.Hence, the total price is referred to as the dependent variable and the unit price isreferred to as an independent variable. In general, a model always describes therelationship between independent and dependent variables. Inferential statisticsdeals with quantifying relationships between particular variables.The Judd model for describing the relationship between data, model, and errorstill holds true: Data Model Error. We will discuss in detail modeldevelopment in Section 3, IBQUFS , Model Evaluation. An example ofinferential statistics would be regression analysis. We will discuss regressionanalysis in IBQUFS , Regression.[ 10 ]
Exploratory Data Analysis FundamentalsChapter 1Data Product: Any computer software that uses data as inputs, producesoutputs, and provides feedback based on the output to control the environmentis referred to as a data product. A data product is generally based on a modeldeveloped during data analysis, for example, a recommendation model thatinputs user purchase history and recommends a related item that the user ishighly likely to buy.Communication: This stage deals with disseminating the results to endstakeholders to use the result for business intelligence. One of the most notablesteps in this stage is data visualization. Visualization deals with informationrelay techniques such as tables, charts, summary diagrams, and bar charts toshow the analyzed result. We will outline several visualization techniques in IBQUFS , Visual Aids for EDA, with different types of data.The significance of EDADifferent fields of science, economics, engineering, and marketing accumulate and storedata primarily in electronic databases. Appropriate and well-established decisions shouldbe made using the data collected. It is practically impossible to make sense of datasetscontaining more than a handful of data points without the help of computer programs. Tobe certain of the insights that the collected data provides and to make further decisions,data mining is performed where we go through distinctive analysis processes. Exploratorydata analysis is key, and usually the first exercise in data mining. It allows us to visualizedata to understand it as well as to create hypotheses for further analysis. The exploratoryanalysis centers around creating a synopsis of data or insights for the next steps in a datamining project.EDA actually reveals ground truth about the content without making any underlyingassumptions. This is the fact that data scientists use this process to actually understandwhat type of modeling and hypotheses can be created. Key components of exploratory dataanalysis include summarizing data, statistical analysis, and visualization of data. Pythonprovides expert tools for exploratory analysis, with QBOEBT for summarizing; TDJQZ, alongwith others, for statistical analysis; and NBUQMPUMJC and QMPUMZ for visualizations.That makes sense, right? Of course it does. That is one of the reasons why you are goingthrough this book. After understanding the significance of EDA, let's discover what are themost generic steps involved in EDA in the next section.[ 11 ]
Exploratory Data Analysis FundamentalsChapter 1Steps in EDAHaving understood what EDA is, and its significance, let's understand the various stepsinvolved in data analysis. Basically, it involves four different steps. Let's go through each ofthem to get a brief understanding of each step:Problem definition: Before trying to extract useful insight from the data, it isessential to define the business problem to be solved. The problem definitionworks as the driving force for a data analysis plan execution. The main tasksinvolved in problem definition are defining the main objective of the analysis,defining the main deliverables, outlining the main roles and responsibilities,obtaining the current status of the data, defining the timetable, and performingcost/benefit analysis. Based on such a problem definition, an execution plan canbe created.Data preparation: This step involves methods for preparing the dataset beforeactual analysis. In this step, we define the sources of data, define data schemasand tables, understand the main characteristics of the data, clean the dataset,delete non-relevant datasets, transform the data, and divide the data intorequired chunks for analysis.Data analysis: This is one of the most crucial steps that deals with descriptivestatistics and analysis of the data. The main tasks involve summarizing the data,finding the hidden correlation and relationships among the data, developingpredictive models, evaluating the models, and calculating the accuracies. Some ofthe techniques used for data summarization are summary tables, graphs,descriptive statistics, inferential statistics, correlation statistics, searching,grouping, and mathematical models.Development and representation of the results: This step involves presentingthe dataset to the target audience in the form of graphs, summary tables, maps,and diagrams. This is also an essential step as the result analyzed from thedataset should be interpretable by the business stakeholders, which is one of themajor goals of EDA. Most of the graphical analysis techniques include scatteringplots, character plots, histograms, box plots, residual plots, mean plots, andothers. We will explore several types of graphical representation in IBQUFS ,Visual Aids for EDA.[ 12 ]
Exploratory Data Analysis FundamentalsChapter 1Making sense of dataIt is crucial to identify the type of data under analysis. In this section, we are going to learnabout different types of data that you can encounter during analysis. Different disciplinesstore different kinds of data for different purposes. For example, medical researchers storepatients' data, universities store students' and teachers' data, and real estate industriesstorehouse and building datasets. A dataset contains many observations about a particularobject. For instance, a dataset about patients in a hospital can contain many observations. Apatient can be described by a patient identifier (ID), name, address, weight, date of birth, address,email, and gender. Each of these features that describes a patient is a variable. Eachobservation can have a specific value for each of these variables. For example, a patient canhave the following:1"5*&/5@*% /BNF :PTINJ .VLIJZB"EESFTT .BOOTWFSL #FSHFO /PSXBZ%BUF PG CJSUI UI VMZ &NBJM ZPTINJNVLIJZB!HNBJM DPN8FJHIU (FOEFS 'FNBMFThese datasets are stored in hospitals and are presented for analysis. Most of this data isstored in some sort of database management system in tables/schema. An example of atable for storing patient information is shown here:PATIENT ID NAMESuresh001KumarMukhiya002003004005ADDRESS DOBMannsverk,30.12.1989 skmu@hvl.no61Mannsverk61, 5094,BergenMannsverkAnju61, Nordmann SwedenYoshmiMukhiyaEMAILGender WEIGHTMale6810.07.2018 yoshmimukhiya@gmail.com Female 110.12.1997 anjumukhiya@gmail.comFemale 2430.11.1990 aasha.gaire@gmail.comFemale 2312.12.1789 ola@gmail.comMale[ 13 ]75
Exploratory Data Analysis FundamentalsChapter 1To summarize the preceding table, there are four observations (001, 002, 003, 004, 005). Eachobservation describes variables (1BUJFOU*%, OBNF, BEESFTT, EPC, FNBJM, HFOEFS, andXFJHIU). Most of the dataset broadly falls into two groupsbnumerical data and categoricaldata.Numerical dataThis data has a sense of measurement involved in it; for example, a person's age, height,weight, blood pressure, heart rate, temperature, number of teeth, number of bones, and thenumber of family members. This data is often referred to as quantitative data in statistics.The numerical dataset can be either discrete or continuous types.Discrete dataThis is data that is countable and its values can be listed out. For example, if we flip a coin,the number of heads in 200 coin flips can take values from 0 to 200 (finite) cases. A variablethat represents a discrete dataset is referred to as a discrete variable. The discrete variabletakes a fixed number of distinct values. For example, the PVOUSZ variable can have valuessuch as Nepal, India, Norway, and Japan. It is fixed. The 3BOL variable of a student in aclassroom can take values from 1, 2, 3, 4, 5, and so on.Continuous dataA variable that can have an infinite number of numerical values within a specific range isclassified as continuous data. A variable describing continuous data is a continuousvariable. For example, what is the temperature of your city today? Can we be finite?Similarly, the XFJHIU variable in the previous section is a continuous variable. We aregoing to use a car dataset in IBQUFS , Descriptive Statistics, to perform EDA.[ 14 ]
Exploratory Data Analysis FundamentalsChapter 1A section of the table is shown in the following table:Check the preceding table and determine which of the variables are discrete and which ofthe variables are continuous. Can you justify your claim? Continuous data can follow aninterval measure of scale or ratio measure of scale. We will go into more detail in theMeasurement scales section in this chapter.Categorical dataThis type of data represents the characteristics of an object; for example, gender, maritalstatus, type of address, or categories of the movies. This data is often referred to asqualitative datasets in statistics. To understand clearly, here are some of the most commontypes of categorical data you can find in data:Gender (Male, Female, Other, or Unknown)Marital Status (Annulled, Divorced, Interlocutory, Legally Separated, Married,Polygamous, Never Married, Domestic Partner, Unmarried, Widowed, orUnknown)Movie genres (Action, Adventure, Comedy, Crime, Drama, Fantasy, Historical,Horror, Mystery, Philosophical, Political, Romance, Saga, Satire, Science Fiction,Social, Thriller, Urban, or Western)[ 15 ]
Exploratory Data Analysis FundamentalsChapter 1Blood type (A, B, AB, or O)Types of drugs (Stimulants, Depressants, Hallucinogens, Dissociatives, Opioids,Inhalants, or Cannabis)A variable describing categorical data is referred to as a categorical variable. These types ofvariables can have one of a limited number of values. It is easier for computer sciencestudents to understand categorical values as enumerated types or enumerations ofvariables. There are different types of categorical variables:A binary categorical variable can take exactly two values and is also referred toas a dichotomous variable. For example, when you create an experiment, theresult is either success or failure. Hence, results can be understood as a binarycategorical variable.Polytomous variables are categorical variables that can take more than twopossible values. For example, marital status can have several values, such asannulled, divorced, interlocutory, legally separated, married, polygamous, nevermarried, domestic partners, unmarried, widowed, domestic partner, andunknown. Since marital status can take more than two possible values, it is apolytomous variable.Most of the categorical dataset follows either nominal or ordinal measurement scales. Let'sunderstand what is a nominal or ordinal scale in the next section.Measurement scalesThere are four different types of measurement scales described in statistics: nominal,ordinal, interval, and ratio. These scales are used more in academic industries. Let'sunderstand each of them with some examples.NominalThese are practiced for labeling variables without any quantitative value. The scales aregenerally referred to as labels. And these scales are mutually exclusive and do not carryany numerical importance. Let's see some examples:What is your gender?MaleFemaleThird gender/Non-binary[ 16 ]
Exploratory Data Analysis FundamentalsChapter 1I prefer not to answerOtherOther examples include the following:The languages that are spoken in a particular countryBiological speciesParts of speech in grammar (noun, pronoun, adjective, and so on)Taxonomic ranks in biology (Archea, Bacteria, and Eukarya)Nominal scales are considered qualitative scales and the measurements that are taken usingqualitative scales are considered qualitative data. However, the advancement in qualitativeresearch has created confusion to be definitely considered as qualitative. If, for example,someone uses numbers as labels in the nominal measurement sense, they have no concretenumerical value or meaning. No form of arithmetic calculation can be made on nominalmeasures.You might be thinking why should you care about whether data is nominal or ordinal? Should wenot just start loading the data and begin our analysis? Well, we could. But think about this: youhave a dataset, and you want to analyze it. How will you decide whether you can make apie chart, bar chart, or histogram? Are you getting my point?Well, for example, in the case of a nominal dataset, you can certainly know the following:Frequency is the rate at which a label occurs over a period of time within thedataset.Proportion can be calculated by dividing the frequency by the total number ofevents.Then, you could compute the percentage of each proportion.And to visualize the nominal dataset, you can use either a pie chart or a barchart.If you know your data follows nominal scales, you can use a pie chart or bar chart. That'sone less thing to worry about, right? My point is, understanding the type of data is relevantin understanding what type of computation you can perform, what type of model youshould fit on the dataset, and what type of visualization you can generate.[ 17 ]
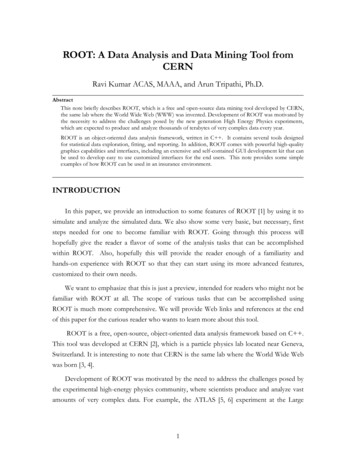
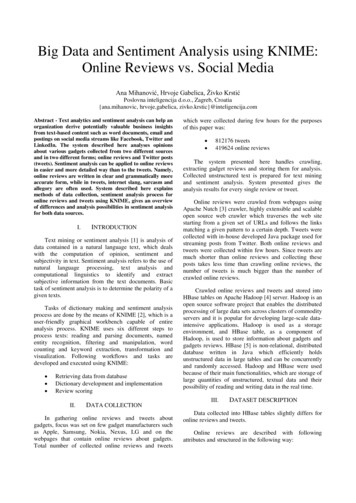
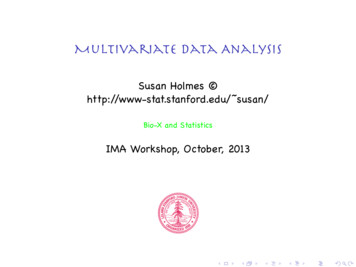
Exploratory Data Analysis FundamentalsChapter 1OrdinalThe main difference in the ordinal and nominal scale is the order. In ordinal scales, theorder of the values is a significant factor. An easy tip to remember the ordinal scale is that itsounds like an order. Have you heard about the Likert scale, which uses a variation of anordinal scale? Let's check an example of ordinal scale using the Likert scale: WordPress ismaking content managers' lives easier. How do you feel about this statement? The followingdiagram shows the Likert scale:As depicted in the preceding diagram, the answer to the question of WordPress is makingcontent managers' lives easier is scaled down to five different ordinal values, Strongly Agree,Agree, Neutral, Disagree, and Strongly Disagree. Scales like these are referred to as theLikert scale. Similarly, the following diagram shows more examples of the Likert scale:To make it easier, consider ordinal scales as an order of ranking (1st, 2nd, 3rd, 4th, and soon). The median item is allowed as the measure of central tendency; however, the averageis not permitted.[ 18 ]
Exploratory Data Analysis FundamentalsChapter 1IntervalIn interval scales, both the order and exact differences between the values are significant.Interval scales are widely used in statistics, for example, in the measure of centraltendenciesamean, median, mode, and standard deviations. Examples include location inCartesian coordinates and direction measured in degrees from magnetic north. The mean,median, and mode are allowed on interval data.RatioRatio scales contain order, exact values, and absolute zero, which makes it possible to beused in descriptive and inferential statistics. These scales provide numerous possibilities forstatistical analysis. Mathematical operations, the measure of central tendencies, and themeasure of dispersion and coefficient of variation can also be computed from suchscales.Examples include a measure of energy, mass, length, duration, electrical energy, plan angle,and volume. The following table gives a summary of the data types and scale measures:In the next section, we will compare EDA with classical and Bayesian analysis.[ 19 ]
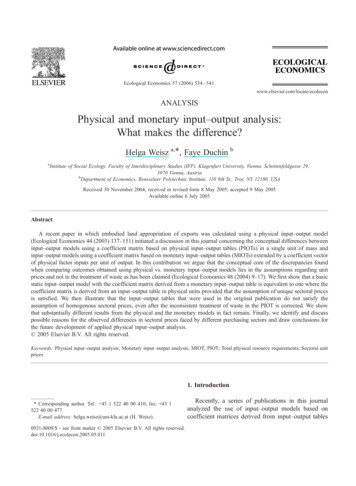
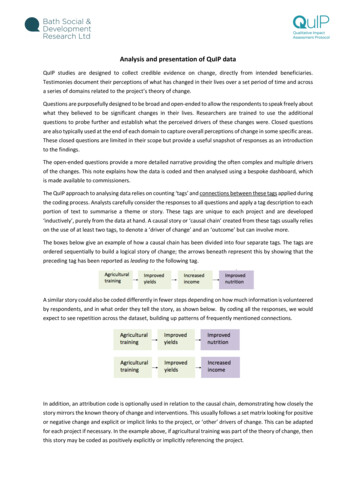
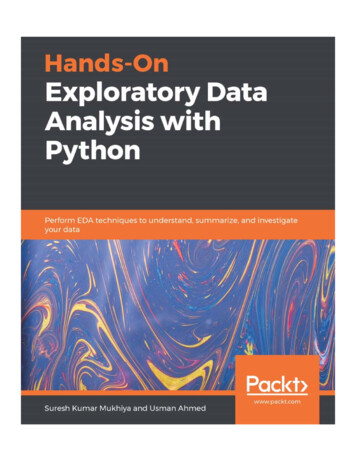
Exploratory Data Analysis FundamentalsChapter 1Comparing EDA with classical and BayesiananalysisThere are several approaches to data analysis. The most popular ones that are relevant tothis book are the following:Classical data analysis: For the classical data analysis approach, the problemdefinition and data collection step are followed by model development, which isfollowed by analysis and result communication.Exploratory data analysis approach: For the EDA approach, it follows the sameapproach as classical data analysis except the model imposition and the dataanalysis steps are swapped. The main focus is on the data, its structure, outliers,models, and visualizations. Generally, in EDA, we do not impose anydeterministic or probabilistic models on the data.Bayesian data analysis approach: The Bayesian approach incorporates priorprobability distribution knowledge into the analysis steps as shown in thefollowing diagram. Well, simply put, prior probability distribution of anyquantity expresses the belief about that particular quantity before consideringsome evidence. Are you still lost with the term prior probabilitydistribution? Andrew Gelman has a very descriptive paper about prior probabilitydistribution. The following diagram shows three different approaches for dataanalysis illustrating the difference in their execution steps:[ 20 ]
Exploratory Data Analysis FundamentalsChapter 1Data analysts and data scientists freely mix steps mentioned in the preceding approaches toget meaningful insights from the data. In addition to that, it is essentially difficult to judgeor estimate which model is best for data analysis. All of them have their paradigms and aresuitable for different types of data analysis.Software tools available for EDAThere are several software tools that are available to facilitate EDA. Here, we are going tooutline some of the open source tools:Python: This is an open source programming language widely used in dataanalysis, data mining, and data science (IUUQT XXX QZUIPO PSH ). For thisbook, we will be using Python.R programming language: R is an open source programming language that iswidely utilized in statistical computation and graphical data analysis (IUUQT XXX S QSPKFDU PSH).Weka: This is an open source data mining package that involves several EDAtools and algorithms (IUUQT XXX DT XBJLBUP BD O[ NM XFLB ).KNIME: This is an open source tool for data analysis and is based on Eclipse(IUUQT XXX LOJNF DPN ).Getting started with EDAAs mentioned earlier, we are going to use Python as the main tool for data analysis. Yay!Well, if you ask me why, Python has been consistently ranked among the top 10programming languages and is widely adopted for data analysis and data mining by datascience experts. In this book, we assume you have a working knowledge of Python. If youare not familiar with Python, it's probably too early to get started with data analysis. Iassume you are familiar with the following Python tools and packages:Python programmingFundamental concepts of variables, string, and datatypesConditionals and functionsSequences, collections, and iterationsWorking with filesObject-oriented programming[ 21 ]
Exploratory Data Analysis FundamentalsChapter 1Create arrays with NumPy, copy arrays, and dividearraysPerform different operations on NumPy arraysUnderstand array selections, advanced indexing,and expandingWorking with multi-dimensional arraysLinear algebraic functions and built-in NumPyfunctionsUnderstand and create %BUB'SBNF objectsSubsetting data and indexing dataArithmetic functions, and mapping with pandasManaging indexBuilding style for visual analysisLoading linear datasetsAdjusting axes, grids, labels, titles, and legendsSaving plotsImporting the packageUsing statistical packages from SciPyPerforming descriptive statisticsInference and data analysisNumPypandasMatplotlibSciPyBefore diving into details about analysis, we need to make sure we are on the same page.Let's go through the checklist and verify that you meet all of the prerequisites to get the bestout of this book:Setting up a virtual environmentReading/writing to filesError handlingObject-oriented concept pip install virtualenv virtualenv Local Version Directory -p Python System DirectoryGJMFOBNF EBUBNJOJOH UYU GJMF PQFO GJMFOBNF NPEF S FODPEJOH VUG GPS MJOF JO GJMF MJOFT GJMF SFBEMJOFTQSJOU MJOFTGJMF DMPTFUSZ 7BMVF JOU JOQVU 5ZQF B OVNCFS CFUXFFO BOE FYDFQU 7BMVF&SSPS QSJOU :PV NVTU UZQF B OVNCFS CFUXFFO BOE FMTF JG 7BMVF BOE 7BMVF QSJOU :PV UZQFE 7BMVF FMTF QSJOU 5IF WBMVF ZPV UZQFE JT JODPSSFDU DMBTT %JTFBTF EFG @@JOJU@@ TFMG EJTFBTF %FQSFTTJPO TFMG UZQF EJTFBTF EFG HFU/BNF TFMG QSJOU .FOUBM )FBMUI %JTFBTFT \ GPSNBU TFMG UZQFE %JTFBTFE HFU/BNF4PDJBM "OYJFUZ %JTPSEFSNext, let's look at the basic operations of EDA using the NumPy library.[ 22 ]
Exploratory Data Analysis FundamentalsChapter 1NumPyIn this section, we are going to revise the basic operations of EDA using the /VN1Z library.If you are familiar with these operations, feel free to jump to the next section. It might feelobvious when going through the code, but it is essential to make sure you understand theseconcepts before digging into EDA operations. When I started learning data scienceapproaches, I followed a lot of blogs where they just reshaped an array or matrix. When Iran their code, it worked fine, but I never understood how I was able to add two matrices ofdifferent dimensions. In this section, I have tried to explicitly point out some of the basicOVNQZ operations:For importing OVNQZ, we will use the following code:JNQPSU OVNQZ BT OQFor creating different types of OVNQZ arrays, we will use the following code: JNQPSUJOH OVNQZJNQPSU OVNQZ BT OQ %FGJOJOH % BSSBZNZ %"SSBZ OQ BSSBZ QSJOU NZ %"SSBZ %FGJOJOH BOE QSJOUJOH % BSSBZNZ %"SSBZ
Data Analysis (EDA), what it is, the key concepts of profiling and quality assessment, the . analysis include summarizing data, statistical analysis, and visualization of data. Python provides expert tools for exploratory ana