Transcription
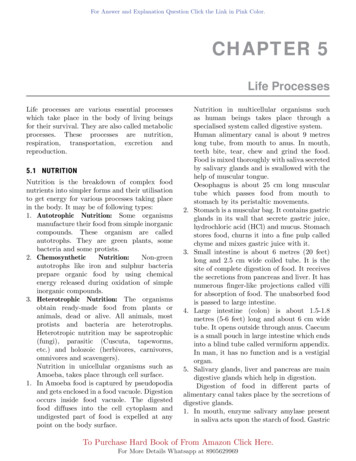
3. The general circulation of the atmosphere and oceanThe general circulation is the ever-changing pattern of winds and currents. It isresponsible for transporting heat meridionally from the tropics to the poles, and upward from thesurface into the troposphere. Large-scale features that help determine regional climate includeoceanic currents and gyres, atmospheric storm tracks, and seasonal mean low and high pressurecenters. We will explore fundamental global modes of interannual variability, including the ElNino Southern Oscillation (ENSO), the North Atlantic Oscillation (NAO) or Northern AnnularMode (NAM), the Southern Annular Mode (SAM), and the stratospheric QuasibiennialOscillation (QBO). Any global trend must be interpreted in the context of this naturalvariability. Perturbations to the earth system such as volcanic eruptions often manifestthemselves in these natural modes of variation. Observed geographical patterns of temperaturetrends in the Arctic and Antarctic, the “global warming fingerprint”, bear a strong resemblance tothe structure of annular modes.3.1. Motivation from radiative considerationsIt useful to consider the general circulation as a response to differential heating, which weexplore in this subsection with a question and answer format.Q: What happens to the sunlight that reaches the earth?The globally-averaged energy balance for space, the atmosphere, and the earth's surfaceis shown in Fig. 3.1. From the principle of conservation of energy, we know that Energy In Energy Out (2.5) for each part of the system. The energy transfer processes are partitioned intosolar radiation, infrared radiation, and air motions. Consider the fate of 100 unitsof incoming solar energy: 30 are reflected back to space by the earth system, 20 are absorbed bythe atmosphere, and 50 are absorbed at the earth's surface. Absorption of sunlight andre-emission at earth temperatures converts energy from visible to infrared wavelengths. Theearth emits 90 units of infrared upward at 288 K, while the atmosphere emits 70 units upwardand 70 units downward at 255 K (140 units e20 absorbed50 absorbedSolar Radiation70 emitted up(255 K)70 emitteddownLatent andSensible HeatTransport3090 emitted(288 K)Infrared RadiationAir MotionsFigure 3.1. Schematic diagram of globally-averaged vertical energy transfer processes amongspace,the atmosphere, and the surface, distinguishing energy transfer by solar radiation (left),Figure 3.1. The global average vertical energy transfer processes between osphericmotions(left),(right).the atmosphere,the surface,solar radiationinfrared radiation(middle), and vertical transport by atmospheric motions (right).45
Q: Does radiative transfer account for all of the energy budget?For the energy balance between the planet and space, yes. Of the 100 units of solarradiation that reach earth, 30 units are reflected and 70 are emitted to space in the infrared bythe atmosphere, verifying the fundamental radiative balance assumed in calculating Tre from(2.7). But the radiative energy budgets for the surface and the atmosphere are not balanced.The surface receives 50 units of sunlight and 70 units of infrared from the atmosphere, whileemitting 90 units of infrared, for a gain of 30 units, net radiative heating. The atmospherereceives 20 units of sunlight and 90 units of infrared from the surface, while emitting 140 unitsof infrared, for a loss of 30 units, net radiative cooling. This implies that 30 units must betransferred from the surface to the atmosphere by conduction and complex motions, as shown atthe right in Fig. 3.1. This radiative imbalance which heats the surface and cools the atmospherecauses warm, moist air near the surface to rise, and cool, dry air aloft to sink, effectivelytransporting heat upward. The resulting motions, including thermals, thunderstorms, tropicalcyclones, and midlatitude cyclones, may be regarded as the response of the general circulation tothis radiative imbalance.Q: What is “latent heat”?The atmosphere is heated from below like a pot of boiling water. Of the 50 units of solarenergy that reaches the surface, about 30 go into simply evaporating water from the ocean andwet land surfaces. So about 30% of the solar energy reaching earth goes into evaporating water!Water is surprisingly stubborn to heat up. It takes 2.5 million J of energy to evaporate 1 kg ofwater, hence the latent heat of vaporization is 2.5x10⁶ J/kg.A profound amount of energy goes into enabling water molecules to leap from the liquidphase into the high speed gaseous phase. As the temperature of water increases it becomeseasier and easier for water to evaporate. The amount of water vapor that air can hold increasesexponentially with increasing water temperature.Since it takes energy to vaporize water at constant temperature, the energy goes into thephase change. From the point of view of temperature, this form of energy is hidden. We callthis form of energy storage for water vapor “latent heat”. Winds moving moist and dry airaround are transporting latent heat. We can sense warm and cold air with our skin, so thattype of energy is called sensible heat. The atmosphere can transport warm and cold air (sensibleheat transport), and moist and dry air (latent heat transport). The energy associated with watervapor is latent until it condenses due to cooling processes. The phase change retards the coolingprocess during the formation of rain and snow, since energy must be removed to cause vapor tocondense onto a rain drop or freeze onto an ice crystal. Latent heat is the fuel which drives theinteresting storms that affect our lives. Rain or snow and latent heat release can occur quite farfrom where the water evaporated. Atmospheric transport of water is an important part of theclimate system.Q: Why are the poles cold?Differential heating between the equator and poles is the fundamental cause of large-scaleatmospheric and oceanic motions. But why are the poles colder than the equator? It may betempting to conclude that it is because at noon the equator is 6367 km closer to the sun than thepoles. But this is minuscule compared to the distance of 150,000,000 km to the sun. The solarintensity is virtually the same everywhere it strikes the outer atmosphere, so the answer lies in46
the spherical shape of the earth. The sun's rays spread out across the surface near the poles, sothat a square meter of surface receives much less radiation than in the tropics.Q: What causes the general circulation?Since the poles are colder than the tropics, the Stephan-Boltzmann law implies that lessradiation is emitted to space. Yet on an annual average there is a tremendous imbalance betweenEnergy In and Energy Out for radiative processes alone. Figure 3.2 shows that much more solarradiation is absorbed in the tropics than is emitted to space in the infrared. At high latitudes, theamount of infrared emitted to space far exceeds the solar radiation absorbed. If radiativeprocesses were the only ones operating, after a while the poles would get much colder and thetropics much warmer, until emission and absorption were equal. In this thought problem, theequator to pole annual mean difference would be 100 K. The observed difference is 35 K.Atmospheric and oceanic heat transport arises in response to differential radiative heating, andare moderately efficient at reducing temperature differences.Figure 3.2. Latitudinal profile of annually andzonally averaged solar heating (solid) and infraredcooling (dashed) in W m2. The difference betweenabsorbed solar and emitted infrared radiation, the netradiation into the earth system, is shown in thebottom curve [Peixoto and Oort 1984].3.2. Atmospheric and oceanic heat transportDifferential radiative heating leads to density differences, rising and sinking motions,hence the winds and currents which accomplish the net heat transport across 37 latitude.These motions tend to occur in organized, large-scale patterns influenced by the distribution ofcontinents. Figure 3.3 shows the atmospheric and oceanic heat transport contributions to thetotal required heat transport. About 1/3 of the heat transport occurs in the ocean, with warmcurrents going poleward on the west edges of the ocean basins, and cold currents goingequatorward on the east edges of the oceans. There are equal contributions of latent and sensibleheat transport in the atmosphere, with warm moist tropical air moving poleward, being replacedby cold dry polar air moving equatorward. To see film loops of this phenomenon, visitwww.aos.wisc.edu/weather/forecastmaps and click on the Global Forecast System (GFS)prognostic charts produced by the National Centers for Environmental Prediction (NCEP).A primary source of evaporated water is the subtropical oceans. Some of this istransported into the tropics where it rains out in the intertropical convergence zone. Some of thisis transported to higher latitudes, where precipitation exceeds evaporation, and the latent heatkeeps the air much warmer than it would otherwise be. After precipitation, the drier air is thentransported equatorward, where it picks up more water vapor and the cycle begins again. Typicalvalues of vertically-integrated latent heat release are 40 W m-2, similar in magnitude todifferences in radiative heating and cooling in Fig. 3.2.47
Figure 3.3. Annual and zonal mean meridionalenergy transport as a function of latitude (in unitsof petawatts or 1015 W) required by the radiativeenergy balance in Fig. 3.2, showing separatetransport contributions from the atmosphere(observed) and the ocean (inferred) [Peixoto andOort 1984].A typical example of heat transport by a storm in the Midwestern U.S. is shown in Figs.3.4 and 3.5, valid for 0000 UTC, February 6, 2008 (6 pm CST February 5). This storm has seenbeen referred to as the Super Tuesday storm. The radar reflectivity map (Fig. 3.4) shows whererain, hail, and snow (hydrometeors) have formed due to upward motion. Rising motion occursalong the cold front over Arkansas and the warm front over Northern Indiana. The cold frontand the area just ahead of it in the warm sector is densely-beaded with red thunderstorm cells.These spawned more than 100 tornadoes which killed more than 50 people. Warm, moist airheading northward ahead of the cold front wraps counterclockwise around the low-pressurecenter toward Iowa, giving a comma shape to clouds and precipitation. In SouthernWisconsin snowfall from the storm ranged from 9 to 20 inches. More than 2000 cars weretrapped on an 18 mile stretch of I-90 for almost a day.Figure 3.4. Composite U.S.radar reflectivity at 0000 UTFebruary 6, 2008 (6 pm CSTFebruary 5). Reflected power(color) is proportional to theintensity of precipitation.48
Figure 3.5. GFS 24 hour forecastvalid at 0000 UT February 6, 2008(6 pm CST February 5) ofa) 300 hPa geopotential height(white contours every 60 m), andisotachs (color bar in knots; 1 knot 0.544 m/s).b) 850 hPa height (white contours,interval 30 m) and temperature(color bar, oC).c) Sea level pressure (whitecontours, interval 4 hPa), 12-hourrainfall (color bar, inches), and1000-500 hPa thickness (yellowcontours, 60 m interval). Spatialvariation in thickness is caused bythe pattern of average temperaturein the layer.49
Focus: Synoptic-scale baroclinic wavesFigure 3.5 shows a 36 hour GFS forecast, including depiction of the jet stream inthe upper troposphere (300 hPa), temperature pattern in the lower troposphere (850hPa), sea level pressure, and 6-hour rainfall. Note the wavy pattern at 300 hPa,featuring a 100-knot jet stream ( 50 m/s) over Texas, which curves northwardtoward the Great Lakes, reaching 180 knots ( 90 m/s) over Ontario, and extendseastward into the Atlantic (Fig. 3.5a). In this configuration, a developing surface lowwill track toward the northeast, consistent with flow at 500 hPa, commonly referredto as the “steering level”. The 850 hPa chart reveals a growing cyclone, with lowpressure over the Mississippi valley. This cyclone is converting energy associatedwith the contrast between warm air coming up from the Gulf of Mexico toward theGreat Lakes, and cold air heading southward toward Texas from Canada (Fig. 3.5b).Note the strong temperature gradients at the leading edge of the cold and warm airmasses, the cold and warm frontal zones (Figs. 3.5b, 3.4). The precipitation andlatent heat release occur in association with the fronts. A common pathway formoist, rising air in the warm sector is to wrap cyclonically around the low-pressurecenter, resulting in a comma-shaped cloud and precipitation pattern (Fig. 3.5c).One may observe that in the midlatitudes there are wavy temperature patternsassociated with cyclones and anticyclones (Fig. 3.5b). Anticyclones are seen off thecoast of California and Florida. An older, occluded cyclone is found near theAleutian Islands. As the cyclones and anticyclones go through their life cycles,warm moist air moves poleward and rises ahead of an approaching cyclone, whilecold dry air moves equatorward and sinks ahead of an approaching anticyclone,effectively transporting sensible and latent heat toward the poles. The warm moistair is lighter and rises up and over the cold dry air, which sinks equatorward. Sincedense air sinks and light air rises, this lowers the center of mass of the combined airmasses. The air mass motions associated with a cyclone may be characterized assloping buoyancy, whereby energy associated with the distribution of mass(geopotential energy) is converted into kinetic energy, causing the growth of asynoptic-scale baroclinic wave. The portion of energy that can be tapped isdetermined by the horizontal contrast in density. This process of wave growth iscalled baroclinic instability. The result of amplified air mass motions around acyclone is to homogenize the horizontal variation in density in a process calledocclusion, or Rossby wave breaking, thereby reducing the energy available forbaroclinic instability. The end result of these waves going through their life cycles isto mix the atmosphere such that the difference in heat and moisture between thetropics and high latitudes is reduced. Synoptic baroclinic waves may be regarded asa response to differential heating. They make a primary contribution toward thegeneral circulation by transporting heat, momentum, water, and other constituents.3.3. A puzzle concerning land and seaThe large-scale wind and current patterns, which accomplish the necessary polewardheat transport, are controlled, in part, by the distribution of land and sea. The importance of thisdistribution can be brought out by examining a curious paradox about the earth’s climate, which50
may be stated: The globally-averaged temperature is colder in January than in July, but theearth is closer to the sun in January, receiving some 7% more radiation than in July! This factis rendered even more curious when it is noted that, in January, the southern hemisphere (SH)ocean absorbs more energy than does the more reflective northern hemisphere (NH) landsurfaces in July. How can this be? The answer lends insight into how monsoons work and is animportant aspect of the Milankovich theory of glacial / interglacial cycles.The land is primarily located in the NH. Land heats up and cools off much more quicklythan ocean, and can support snow and ice more readily. Sunlight is absorbed in a thin layer onland ( 1 cm thick) but penetrates much deeper into the ocean ( 100 m). It takes 4 times asmuch heat to raise 1 kg of water 1 K compared to 1 kg of soil. The main reason why the landheats up more quickly than the ocean in the summer is that much of the solar energy reaching theocean goes into evaporating water. This is also true of moist ecosystems on land. But whereverit is dry, sunlight quickly raises the surface temperature. Emission of infrared to space canquickly cool the land surface, but the ocean surface will stay more constant, since mixing ofwarmer water from below will keep the temperature mild. Ocean currents can also transport heatto where it is lost by infrared emission, keeping waters ice free as far north as Spitzbergen. Allof these factors give the ocean a large thermal inertia, which cools off and heats up much moreslowly than the land. Hence the seasonal cycle for the NH, which contains most of the land,exerts a strong control over the whole planet. Other consequences of this land/sea contrast forecosystems and human habitation are that the diurnal and annual temperature variations aresmaller near the ocean than in the middle of continents.Even though the earth is closest to the sun in January, the NH land is tilted away from thesun, so it cools quickly. Snow can build up on land, reflecting sunlight, making the regioncooler. This is an example of the ice albedo feedback, amplifying the ability of snow to fall onland. In July, the NH land is tilted toward the sun, so it heats up quickly, more thancompensating for the fact that the earth is farther from the sun. Meanwhile, the SH oceans heatslowly in January and cool slowly in July. Applying similar reasoning, continents heat up andcool off much more quickly than the more equable oceans, leading to seasonally-reversing landsea heating contrasts and monsoonal circulations. In Chapter 4 we will explore the role of NHland masses in enabling the Milankovich orbital parameters to lead earth into and out of ice ages.The distribution of the annual range in monthly averaged temperature is shown in Fig.3.6. The interiors of continents are much colder in winter and much warmer in summercompared to oceans at a similar latitude, with the range in monthly-averaged temperatureexceeding 60 K in northeastern Siberia, 40 K in Canada, 20 K in northwest Africa, and 15 K inAustralia and Patagonia. In midlatitudes, the west coasts of continents are more like the oceansand the east coasts are more like the continents, because of the prevailing westerlywinds. We will investigate the nature of these westerly winds shortly.Figure 3.6. The annual range inmonthly-averaged surfacetemperature, contour interval 5oC[Shea 1986].51
The tropics are not very noticeable in Fig. 3.6, with the annual range averaging 2 K.This is partly due to the fact that the noon sun is high in all seasons. Other important factorsinclude the efficient mixing of heat by air motions and trapping of infrared radiation by the largeamounts of water vapor in the tropics. Nevertheless, air does get hotter over tropical land(Amazonia, Africa, and Indonesia) than over the adjacent ocean, leading to a stronger tendencyfor rainfall over continents and groups of tropical islands.3.4. Monsoon CirculationsHot air rises and cold air sinks. If we burn some toast when it's cold outside and we openthe door, the hot air with the smoke will go out the top and the cold air will come in along thefloor and chill your feet, making even tube socks seem desirable. You may also have noticedthat air chills next to a window in winter, gets denser, and sinks along the floor, making your feetcold, and is replaced by air from the upper part of the room. These examples illustratehow the monsoons work, only on a larger scale. A monsoon is a seasonal reversal in theprevailing wind direction on a continental scale.Figure 3.7 shows idealized cross-sections of monsoon circulations for summer andwinter. In summer the air over the continent heats up quickly, expands, and rises, withmolecules “spilling off” onto the cooler, contracted air column over the oceans. The export ofmolecules from the continents to the oceans implies lower pressure at the surface over thecontinent and higher pressure over the ocean. This pressure difference gives rise to a pressuregradient force, which causes air to move from the oceans to the continent, bringing moistureonshore. This air then rises, cools, condenses, and rains, hence the association of monsoon andsummer rains.Figure 3.7. Idealized monsoon circulations corresponding to a) summer and the tropics, and b)winter and polar regions.During winter the continents get much colder. The air over the continents becomesdenser, more compact, and sinks, leaving room for air molecules to “fall off” of the expandedwarm oceanic air columns onto the top of the contracted continental air columns. This increasesthe surface pressure over land and decreases it over the oceans. The resulting pressure differencecauses the air to flow from the continents toward the oceans (offshore flow). The rising warm airover the oceans cools at it rises, leading to condensation and precipitation. The sinking cool airover the continent warms as it sinks, suppressing the development of clouds.Air converges into the warm low pressure regions and rains over the oceans during winterand over the continents during summer. In the subtropics and higher latitudes there is a seasonalmonsoon circulation that strongly influences the general circulation. The winter circulation52
also applies to Antarctica most of the time, where high pressure dominates and katabatic flowsdescend the continent and rush out onto the ice shelves toward the warm low pressure areassurrounding Antarctica. The summer circulation also applies to the tropics, with preferredrising motion and rain over Indonesia, Africa, and Amazonia.Figure 3.8. Schematic view of the atmospheric circulation in the tropics indicating convergenceand rising motion in regions of convection [Webster 1983].Figure 3.8 shows the strong east-west overturning in the Pacific that results frompreferential heating over Amazonia, Africa, and Indonesia (which exhibits the thermal aspects ofa “Maritime Continent”). This pattern of low pressure, rising motion, and rainfall overIndonesia and high pressure, sinking and clear skies in the East Pacific is part of the overturningWalker circulation, first identified by Gilbert Walker in the 1930s. This circulation variesbetween strong and weak every 3-7 years, giving rise to a Southern Oscillation, the atmosphericcomponent of the El Nino Southern Oscillation (ENSO) phenomenon.The Walker circulation is centered in the tropics, which is south of where the scientistswho thought about it lived, and is not predominantly of the SH. When the Walker circulation inthe Pacific changes, the circulation changes everywhere in the tropics (Fig. 3.8). Differentialheating gives rise to regions of high and low sea level pressure at all latitudes. In the tropics, airtends to flow straight from high to low pressure, such that spatial variation in sea level pressureis rather weak. In the extratropics, surface flow is also toward the warm ocean or continent, butwith increasing latitude, the effects of rotation on a sphere are increasingly important (theCoriolis effect), causing the flow to have a significant component around high and low pressurecenters, instead of just from high to low pressure.3.5. Sea level pressure patterns and windsThe distribution of land and sea is directly related to the seasonal patterns of sea levelpressure, winds, and gyre circulations in the upper layer of the oceans. The rotation of the earthleads to a very interesting consequence for air trying to flow from high to low pressure. Sincethe earth rotates around once a day the air doesn't flow simply from high to low pressure. Thiseffect is more pronounced the farther away from the equator you get. To understand the world'slarge scale atmospheric and oceanic circulation patterns, we need to understand the Corioliseffect and the associated, wind-driven Ekman transport which exists in the upper layer of theocean.53
As observers sitting here on the earth we are pulled by gravity toward the center of theearth and stuck to the earth's surface by the van der Wahl's forces that attract our shoes andclothes to objects that we walk and sit on. Since the earth rotates slowly enough, these frictionalforces and the firmness of the earth cause us to move in a very peculiar path through space: evercurving (radially accelerating) toward the rotation axis but never getting there. In the NH, we arealways curving to the left of straight-line motion. It is natural for us to express everything in acoordinate system that is not moving with respect to the earth's surface. But when we do so,straight line motion in the NH appears to curve to the right. This is the Coriolis effect, which isnot a true force in the sense of a physical impulse to change direction or speed. Straight-linemotion appears curved in a rotating coordinate system, causing moving air or water to appear tobe deflected to the right in the NH and to the left in the SH.Imagine yourself inside a room and you have the ability to fly. If you took off and flewstraight toward a spot on the wall on the other side of the room you would miss your target everso slightly. That is because, during your flight, the room rotated slightly, counterclockwisearound the north pole (or clockwise around the south pole), as seen from above. It is just theCoriolis effect.A turntable normally rotates clockwise as seen from above. This is in the same sense asthe SH, as seen from above. If you draw a chalk line on a long-play vinyl record from thespindle towards yourself, you would see a chalk mark (streak line) which curves to the left of thedirection of motion of the chalk. It is just the Coriolis effect.If you were to ride in a rocket flying straight from the North Pole toward the equator, youwould find that the equator, moving eastward at 450 m/s, slipped off to the east, to your left,while you were moving straight. An observer in the rotating earth coordinate system would seeyou appearing to be deflected to the right and to appear to land to the right of your target. It isjust the Coriolis effect. It is interesting to consider that a rocket launched eastward or westwardat the equator will stay over the equator, because the Coriolis effect is zero there.One day you may find yourself with a beautiful house, with a beautiful spouse,and a beautiful merry-go-round, trying to throw beautiful balls to each other, and you may askyourself, well, why doesn't the ball get to my partner like I expect? The ball goes straight, butyou and your partner are in a rotating coordinate system. It is just the Coriolis effect.Figure 3.9 shows the patterns of sea level pressure and surface winds during Januaryand July. During NH winter the oceans are warm and rainfall is prevalent in the Aleutian Lowand Icelandic Low pressure systems. The continents are cold during NH winter, with theCanadian High and Siberian High pressure systems dominating the weather. During NH summerthe oceans are cooler and the North Pacific and Bermuda Highs expand to dominate thecirculation, while lower pressure and thunderstorms dominate North America and Eurasia.In the SH during summer (Fig. 3.9a) the oceans are cooler in the subtropics, sohigh pressure dominates over the eastern Pacific and Atlantic (cf. Fig. 3.7). Relatively lowerpressure occurs over Australia, Africa, and South America. During SH winter the oceansdominate the climate, with synoptic storms travelling rapidly eastward in the “roaring 40s and50s”.54
Figure 3.9. Monthly mean sea level pressure (contour interval 4 hPa), and idealized surfacewind vectors for a) January and b) July [from Ahrens (2019)].When air diverges out of a high-pressure region and converges into a low pressureregion it is deflected to the right in the NH and to the left in the SH. During NH winter, airflowing outward from cold high pressure over Canada curves to the right, yielding northwesterlywinds in central North America. During NH summer air flowing outward from the high-pressureregion over Bermuda curves to the right, yielding southerly winds prevailing in central NorthAmerica. This is the North American monsoon east of the Rockies. Note that in winter dry airsinks equatorward over us, while in summer moist warm air moves poleward over us, giving apoleward heat transport of sensible and latent heat in both seasons.3.6. Midlatitude westerlies and subtropical easterliesThe ocean surface circulations are caused by wind pushing on the ocean surface. Weneed to understand why winds tend to blow from the east (easterly) in the subtropics and fromthe west (westerly) in the extratropics. The suffix -ly suggests the properties of the air fromwhence it came. We observe in Fig. 3.9 that the subtropical high pressure regions have westerlywinds on their poleward flanks and easterly winds on their equatorward flanks. We can gain adeeper understanding of why this is so by considering the transport of angular momentumby the general circulation.Angular momentum per unit mass is equal to the tangential speed of rotation times thedistance to the rotation axis. The earth's surface at the equator is moving eastward at 450 m/sand is 6367 km from the rotation axis, so it has a lot of angular momentum, while the poles havezero angular momentum. This means that poleward motion brings larger angular momentum,while equatorward motion brings smaller angular momentum. Air diverges poleward out oftropical convection over Indonesia, Amazonia, and Central Africa in the upper troposphere.This poleward-moving air remembers its large angular momentum, which is greater thanthe midlatitude surface over which it is moving, so it travels eastward faster than the surfaceunderneath. Poleward motion generates westerly winds. The surface air converging into thetropics will remember that it came from a latitude with lower angular momentum, and move lessrapidly eastward than the surface it is moving over. Equatorward motion generates easterlywinds. These trade easterlies converge into the tropics, where they rise again. The zonalaverage of this overturning meridional circulation is known as the Hadley circulation.This meridional circulation varies around the equator and with season, beingespecially strong ove
rain, hail, and snow (hydrometeors) have formed due to upward motion. Rising motion occurs along the cold front over Arkansas and the warm front over Northern Indiana. The cold front and the area just ahead of it in the warm sector is densely-beaded with red thunderstorm cells. These spawned