Transcription
ARCHITECTURAL PROGRAMMINGProgram Spreadsheet – GSF, NSF, NOSF CalculationSpatial Diagram for Schematic Design
Steps in Program Area Calculations1. NSF : NSF for each space X #Units2. NOSF : Total NSF Circulation3. Total NOSF with efficiency :Total NOSF / %Efficiency4. Total with 10% for mechanicalSubtotal : 3 45. With 2% for exterior wallsTotal GSF : Subtotal 5
1. NSF – Net Square Footage–Some circulation may be part of the unit sizes(i.e. space to stand in front of counter or file cabinet)–Some circulation is included in the NSF for work areas and cubicles–Some circulation is included in the NSF for office spaces need space for layout and to move around NOTE:Since office spaces still need additional circulation to beconnected to the rest of the building the office is considered a NSF unit(not NOSF)
2. NOSF - Net occupiable square footage Need additional sf for circulation between cubicles,offices, aisles in an auditorium, etc.How much more? This is an estimate, based on: Experience doing these types of layouts Studying existing successful plans of similar projects (doingarea take-offs)
To get NOSF* - Guidelines for adding circulation % of space enclosed% Circulation added(offices, closets, workrooms) More than 50% Between 20 and 50% Less than 20% Note:Add 30%Between 15–25%Add 10% Use your judgment – evaluate what activities are going on.These are estimates. Sometimes programs just put 25% on top of total NSF.However, tailoring to the specific areas gives you betterprecision, especially if you want to revise
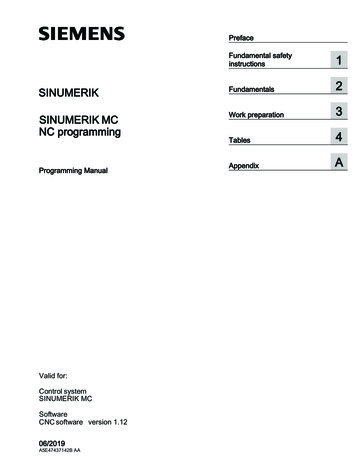
Calculating for NOSFSTAFF/SPACEPROGRAM O1503SecretariesWS802ClericalWS501Support Areas:Waiting/ReceptionO150Work Room/copierCR1000Coat closetCR100ToiletsCR500TOTAL STAFF7TOTAL NSFCIRCULATION @ 30%TOTAL NET OCCUPIABLE SQUARE FOOTAGE – NOSFUNITSNSF COMMENTS13211504501605010112150 Waiting for 10100 Include copier @25sf101001,1803541,534Legend: PO – Private office; CR – closed room; WS – open workstation; C – cubicle; O – open area
3. GSF: Gross Square Footage1) NOSF With Efficiency – Total NOSF / Efficiency2) Add 10% of NOSF with efficiency – Mechanical Space3) Add 2% of Subtotal 1) 2) - Exterior walls *If mechanical is programmed can skip this step
Calculating for efficiency Total NOSF is divided by the % efficiency:NOSF/ % Efficiency
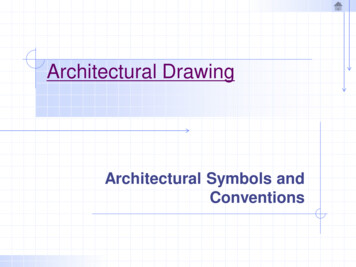
4. GSF CalculationEXAMPLE (with 75% Efficiency)1. 1,534 NOSF/.75 2. Add 10% of #1 for Mechanical 2,045 X 10% 3. 2,249.5 X.02 (for exterior walls) TOTAL GSF2,045204.52,249.544.992,294.49
Calculating for total GSF1) Total the NOSF2) Estimate a building efficiency for the layout(The higher the efficiency, the less room for additional circulation)3) Estimate efficiency at 75% (for example)4) Divide the NOSF by the % efficiency5) Take 10% of SF with efficiency and add to the total6) Take 2% of the total and add for the final GSF total
Example of Final GSF Summary Sheet
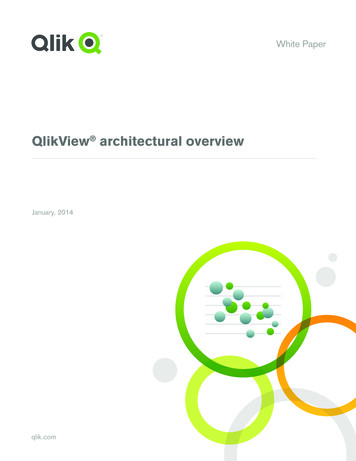
Bubble or Adjacency Diagrams The complete program has not yet been established - so notdesigning final layout yetEasy to understand and helpful to both client and designerClient is confident important issues and possible solutions havebeen determined and discussed before finalizing designOpportunity to rework the way things are done currently.Going through issues now and working things out abstractlysaves time, money, avoids miscommunication and, hopefully,demands by client for additional unpaid work/changes later.
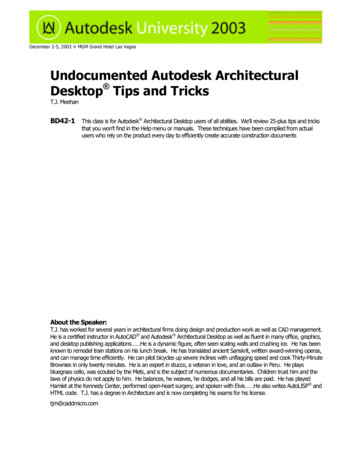
Diagrams discuss programmatic/planning ideas and options Copying services can be centralized or alizedCSDeptCSDeptCSDeptCSDeptDecentralizedCSDept
A few guidelines for better clarity of communication Diagrams are language - try to keep the symbols consistentand distinct for different areas or ideas, i.e. Avoid any crossing lines Show relative sizes of spaces Indicating a front and back entry helps establish a context, arelationship to areas outside the diagram.Try to distinguish closed and open areas through differenttypes of lines or colors.
Abstractly indicate planning arrangement – avoid “daisy” diagrams Degree of adjacency:–– Can show the relationship of spaces by placing their symbols closer toor further from one anotherIf connecting space symbols (the bubbles) with lines – using differentline types/weights helps sort out areas into building blocksUse a key to explain all symbols
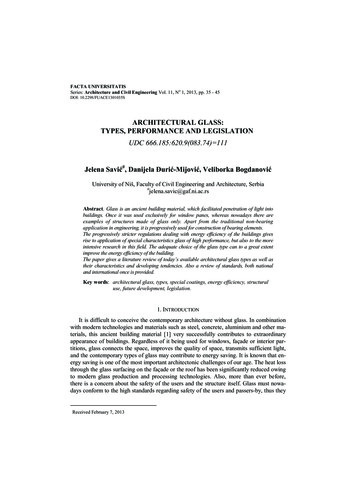
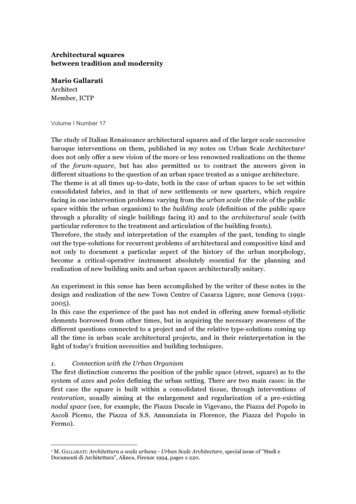
Diagram e- Create some hierarchy – avoid daisy diagrams.- Do not put spaces in the same shape as labels giving information about thespaces. The center is the name of the overall space, yet all around it are in thespace (I assume)- Lack of difference in the shapes (types and sizes) is also confusing.
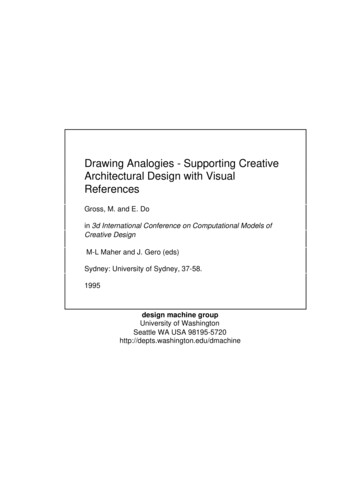
Example of daisy diagram - little differentiation and indication of layout
Final Programming Pre-schematic phases During the programming phase, in addition to establishing thestaff space program and adjacency diagrams, need to exploreoptions for building layering; Layering diagrams - what goeson what floorDiscuss possible phasing of the project; degrees and ways toaddress future expansion on the chosen siteExplore building height and volumePresent blocking diagrams – how does building occupy thesite? What is the footprint? What is the orientation of allentries/exits in relationship to the site? Orientation ofdepartments/areas?
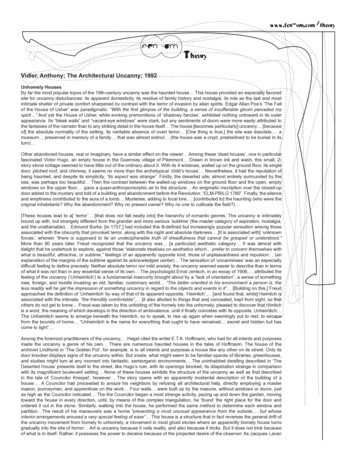
Blocking Diagrams Shows blocked out areas of the program, to scaleGives an idea of the building footprint, orientation, mainentries /exits Must be sited to be give whole picture Must have a North arrow showing orientation Several options should be considered before going intoschematic design
Blocking Diagram 1 – circle footprint
Blocking Diagram 2 – L-Shaped footprint
Blocking Diagram 3 – V-Shaped footprint
Blocking Diagram within Site
Blocking Diagram within Site
1. NSF – Net Square Footage – Some circulation may be part of the unit sizes (i.e. space to stand in front of counter or file cabinet) – Some circulation is included in the NSF for work areas and cubicles – Some circulation is included in the NSF for office spaces need space for layout and to move around NOTE: Si