Transcription
Quantifying Equid Behavior—A Research Ethogram for Free-RoamingFeral HorsesTechniques and Methods 2-A9U.S. Department of the InteriorU.S. Geological Survey
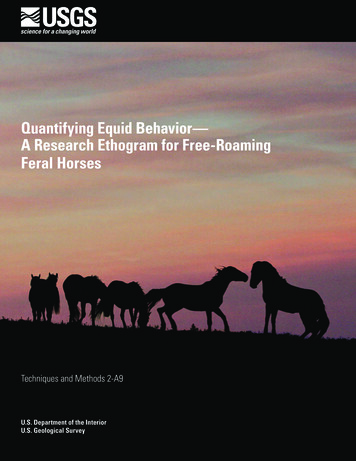
Cover photo by Jason Ransom.
Quantifying Equid Behavior—A ResearchEthogram for Free-Roaming Feral HorsesBy Jason I. Ransom and Brian S. CadeTechniques and Methods 2-A9U.S. Department of the InteriorU.S. Geological Survey
U.S. Department of the InteriorKEN SALAZAR, SecretaryU.S. Geological SurveySuzette M. Kimball, Acting DirectorU.S. Geological Survey, Reston, Virginia: 2009For more information on the USGS—the Federal source for science about the Earth, its natural and living resources,natural hazards, and the environment, visit http://www.usgs.gov or call 1-888-ASK-USGSFor an overview of USGS information products, including maps, imagery, and publications,visit http://www.usgs.gov/pubprodTo order this and other USGS information products, visit http://store.usgs.govAny use of trade, product, or firm names is for descriptive purposes only and does not imply endorsement by theU.S. Government.Although this report is in the public domain, permission must be secured from the individual copyright owners toreproduce any copyrighted materials contained within this report.Suggested citation:Ransom, J.I. and Cade, B.S., 2009, Quantifying equid behavior— A research ethogram for free-roaming feral horses:U.S. Geological Survey Techniques and Methods 2-A9, 23 p.
iiiContentsIntroduction.1Background.1Social Organization.1Ethological Data Collection and Analyses.2Ethogram.4Feeding.4Resting ding Attentive.8Elimination.8Social. 10Harem Social.10Herding.10Harem knowledgments .20References.21Figures1. Observed daytime activity budgets of adult control female feral horses and haremstallions in Colorado, Wyoming, and Montana, 2003–2006.52. Feral horses grazing.53. Resting behavior in a band of feral horses.64. Example of locomotion, most typically expressed as walking from one place toanother.75. Rolling by a feral horse mare as a grooming behavior.76. Example of masturbation, a typical comfort behavior for feral horse males.87. Feral horse mares focused on an external stimulus and exhibiting standing attentivebehavior.98. A band of horses exhibiting human awareness.99. A female feral horse exhibiting elimination by urination.1010. Example of allogrooming (mutual grooming), one of the most common harem socialbehaviors. 1111. Olfactory investigation in the harem social behavior context.1112. Pair-bonding among juveniles within a band as a common harem social behavior.1213. A feral horse stallion herding females in his band.12
iv14. A stallion harem tending, guarding females against an intruder male.1315. Male feral horse expressing harem tending by maintaining a fecal midden.1316. Flehmen response in a feral horse stallion displayed by an elevated head and raised,inverted upper lip.1417. A feral horse stallion engaged in the male reproductive sequence.1518. Basic guidelines for distinguishing reproductive and non-reproductive stallionbehaviors .1519. Successful copulation between a feral horse male and female.1620. Agonism expressed by two feral horses in the form of a threat.1721. Example of pushing as an agonistic expression.1722. Example of chasing as a moderately intense form of agonism.1823. Example of biting as a common expression of agonism.1824. Example of rearing as an expression signifying a potentially intense agonisticinteraction.1925. Example of striking or stomping as typically indicative of highly agonistic expression.1926. Example of boxing and dancing between two stallions as illustrative of the highestlevel of agonism.2027. Submission expressed by a young male horse, directed toward the larger, dominantmale displaying threat behavior associated with dominance.21
Quantifying Equid Behavior—A Research Ethogram forFree-Roaming Feral HorsesBy Jason I. Ransom and Brian S. CadeIntroductionFeral horses (Equus caballus) are globally distributedin free-roaming populations on all continents except Antarctica and occupy a wide range of habitats including forest,grassland, desert, and montane environments. The largestpopulations occur in Australia and North America and havebeen the subject of scientific study for decades, yet guidelinesand ethograms for feral horse behavioral research are largelyabsent in the scientific literature. The U.S. Geological Survey (USGS) Fort Collins Science Center conducted researchon the influences of the immunocontraceptive porcine zonapellucida (PZP) on feral horse behavior from 2003–2006 inthree discrete populations in the American west (see Ransom and others, 2007; Ransom, 2009). These populationswere the Little Book Cliffs Wild Horse Range in Colorado,McCullough Peaks Herd Management Area in Wyoming, andPryor Mountain Wild Horse Range in Montana; the researcheffort included over 1,800 hours of behavioral observations of317 adult free-roaming feral horses. The following ethogramwas developed during the course of this study to facilitateaccurate scientific data collection on feral horse behavior,which is often challenging to quantify. By developing this setof discrete behavioral definitions and a set of strict researchprotocols, scientists were better able to address both appliedquestions, such as behavioral changes related to fertilitycontrol, and theoretical questions, such as understanding socialnetworks and dominance hierarchies within social groupsof equids.federally protected by the Wild Free-Roaming Horses andBurros Act of 1971, which refers to them as “living symbols of the historic and pioneer spirit of the West,” statingthat “they contribute to the diversity of life forms within theNation and enrich the lives of the American people” (Public Law 92-195, 85 Stat. 649, as amended). Roughly 30,000feral horses are distributed across 10 western States in theUnited States on 21.4 million ha of federally designated horserange. With annual population growth rates reported at 15–25percent (Eberhardt and others, 1982; Wolfe and others, 1989;Garrott and Taylor, 1990; Garrott and others, 1991) and verylimited natural depredation, the influence of feral horses onnative flora, fauna, and ecosystem processes varies greatly(see Smith, 1986; Fahnestock and Detling, 1999; Coughenour, 2002; Levin and others, 2002; Beever and Herrick, 2006;Beever and others, 2008). Understanding animal behavior canbe an important tool in addressing a species’ influences androles in an ecosystem and can lead to better management andconservation practices (Sutherland, 1998; Buchholz, 2007).Additionally, when management practices such as fertilitycontrol alter natural biological processes, it is important toconsider the ethical implications, such as influences on animalbehavior and social structure (Nettles, 1997; Asa and others,2005; Porton, 2005).BackgroundFeral horses arrange themselves in family groups knownas bands, which range in size from 2 to 20 or more animals.Band size is variable and may be a response to both the environment the horses inhabit and population density. Animalscan reduce risk of predation by living in groups (Pusey andPacker, 1997), and in open habitats without cover in whichto hide, animals may form larger groups (Molvar and Bower,1994). The latter was found to be true in the USGS study,Feral horses in North America are descendents of animalsthat escaped domesticity or were intentionally released bysettlers, explorers, and military personnel, and because oftheir highly adaptive nature were able to thrive in a multitudeof environments. In the United States most feral horses areSocial Organization
2 Quantifying Equid Behavior—A Research Ethogram for Free-Roaming Feral Horseswhere mean band size in the sage steppe habitat found atMcCullough Peaks was 8.01 0.38 (SE) horses, while habitats with trees and dense vegetation had smaller mean bandsizes—4.45 0.16 horses at Little Book Cliffs and 4.16 0.17horses at Pryor Mountain.Feral horse bands typically consist of a single polygynousstallion, adult females, foals of the year, and yearling malesand females. Bands with multiple stallions do occur and werefirst reported by Denniston (1979) and Miller (1979). Miller(1979) found that multiple stallions were present only in bandsconsisting of greater than 9.3 horses. This finding was supported by the USGS study, during which multiple-stallionbands were recorded only at McCullough Peaks; multiplestallions occurred in five bands of horses consisting of 9–18animals each. At 2 years of age, subordinate males typicallydisperse the band into bachelor groups of two to severalhorses, but occasionally 2- and 3-year-old males remain withthe band if the stallion does not drive them away. Rutberg andKeiper (1993) found that the age at which male horse dispersaloccurs is strongly correlated with the number of peers in thenatal group.Feral horse bands are not geographically territorial andhome ranges overlap with those of other bands in the population. This geographically non-territorial, harem-type socialstructure is known as Type I organization and also is usedby the Przewalski horse (Equus ferus przewalskii), Plainszebra (Equus burchellii), and Mountain zebra (Equus zebra)(Klingel, 1975; Rubenstein, 1989). The other organizationalstructure found in equids, Type II organization, involves adultmales establishing geographic territories and females movingbetween them. Type II organization is used by the Grevy’szebra (Equus grevyi), African wild ass (Equus africanus), andAsiatic wild ass (Equus hemionus). While feral horses do notexhibit geographic territoriality, the USGS study did documentresource-oriented territoriality whereby stallions (with theentire band present) defended mineral sources repeatedly andoften with elevated agonistic interactions when other bandsapproached.Ethological organization within horse bands is characterized by a dominance hierarchy, but the literature hasconflicting functional explanations for hierarchical structuresin equids. Houpt and others (1978) found that body weightaffected social rank but age did not; however, other researchers (Keiper and Sambraus, 1986; Rho and others, 2004; Heitorand others, 2006) found age to be linearly correlated withsocial rank. Reproductive status of females has been shownto influence their social dominance in a band, as well as theirrate of interchange between bands (van Dierendonck andothers, 2004). Most studies, however, indicate that agonismis strongly correlated with dominance rank among females(Houpt and others, 1978; Waring, 1983; Keiper and Receveur,1992; Weeks and others, 2000). The USGS study found thatthe most dominant members of feral horse bands were female,and stallion rank varied by band. This ethological structure isreported in much of the existing literature (Houpt and Keiper,1982; McCort, 1984; Keiper and Sambraus, 1986; Klimov,1988; and Keiper and Receveur, 1992). Lack of stalliondominance has been attributed to the amount of time stallionsspend away from the band while recruiting new females orengaging in agonistic interactions with other stallions; femalesin a band, however, can establish stronger hierarchical relationships because they continuously remain in close proximity to one another (Keiper and Receveur, 1992). Social rankin bachelor groups, which are often unstable, has only beenattributed to individual temperament (Tilson and others, 1988).Ethological Data Collection andAnalysesIt is possible to quantify behavior through the systematicenumeration of discretely defined categorical behaviors interms of counts of occurrence or proportions of time exhibited.Collection of ethological data may be accomplished throughseveral techniques, and the ultimate decision rests on theprecisely defined research objectives. The reader is referredto Altmann (1974) for a definitive overview of samplingmethodology for observational data. In the last 30 years,many insights have contributed to refining these methods,such as how to determine the appropriate time period betweensampling when using the instantaneous scan sampling methodand a better research design to capture infrequent behavioralexpressions. In sampling feral horse behavior, the USGS studyfound that instantaneous scan sampling (the method of recording the categorical behavior of each focal animal at precisemoments in time) at 1-min intervals was ideal for quantifyingtime budget data. Continuous sampling is an alternative to thistechnique and involves recording a focal animal’s behaviorcontinuously and noting the point in time that a new behaviorbegins. Continuous sampling was impractical for our studydue to the number of animals and observers involved. Mitlohner and others (2001) found no significant difference betweenbehavioral data recorded with instantaneous scan samplingversus continuous sampling when intervals were 15 minutesor less, and found a high correlation between the techniqueswhen using 1-min intervals.Collecting data on time budgets using instantaneousscan sampling is fairly straightforward, but behaviors that areinfrequent and expressed briefly are not likely to be capturedadequately (Houpt, 1991; Doran, 1992). Two relatively goodoptions exist for collection of such data: the all-occurrencemethod and focal sampling. All-occurrence data collectionrecords every behavior every time it is observed (Altmann,1974) and can be a good technique when the number ofanimals in the focal band is not too large and the behaviorsof interest are easy to detect. Although less efficient in termsof data collection, the focal sample method may be more reliable since the observer’s focus is directed at only one animal(Altmann, 1974; Houpt, 1991). This method involves randomly selecting one individual in the band and continuouslyobserving and recording all behavioral expressions. In feral
Ethological Data Collection and Analyses 3horse research, capturing briefly occurring expressions is mostimportant for reproductive, social, and agonistic behaviors.Feeding, resting, and locomotion typically occur in periodslong enough to be captured by most techniques.Ethological protocols must be established prior to datacollection and should be defined by research objectives. Thediscrete behavioral categories presented in this ethogram donot preclude the exhibition of simultaneous behaviors. Forexample, it is typical in feral horses for a comfort behaviorsuch as masturbation to occur while the animal is feeding, soa protocol should be explicitly defined stating which behaviortakes precedence in the data record. If the objective of yourresearch is to determine the amount of time horses are feedingin relation to some covariate, then feeding is the appropriatecategory, and if expression of comfort behavior is the focus,then it should be recorded as such (or in this case, one mightwish to subdivide comfort into several behaviors, since comfort is generally a short-duration behavior with many specificexpressions). Regardless of the approach, notations of simultaneous occurrences are invaluable in retrospect.Simultaneous behavioral expressions are not the onlyobservational data collection pitfall. Some behaviors, such asolfactory investigation, can be ascribed to several categories.This behavior may fall under comfort, reproduction, or haremsocial behavior, but the correct categorization of such expressions is not subjective: each expression does have an absolutedefinition. In such cases, the context of the behavior willdefine its true characterization. When such potentially confusing behaviors are prevalent, they are addressed specifically inthe ethogram.Considerably more in-depth analyses of behavior are possible when covariates associated with individual focal subjectsare collected reliably. Many factors may influence behavior,such as age, body condition, dominance rank, presence ofdependent foal, climate, and habitat. Fortunately, many feralhorses have unique natural markings, making identification ofindividual animals possible without the use of radio-collarsor numbered tags. Pelage color; facial patterns such as snips,strips, blazes, and stars; and leg markings such as coronetbands, socks, and stockings collectively make cataloging andreferencing study animals feasible (Sponenberg and Beaver,1992; Gower, 2000; Green 2001). Properly cataloging andidentifying individual horses in a research effort can providethe foundation from which to build in-depth covariate data andthus lead to a better understanding of animal behavior.Analyses of behavioral data may incorporate many traditional statistical methods, but time budget data presents a particularly challenging dilemma. These analyses must considerthe compositional nature of a time budget: models exhibiting strong support for one behavioral category must also beconsidered for each other category. Proportions of time spentin behavioral categories are compositional dependent variablesbecause the sum of the proportions in all behavioral categories sum to 1. In other words, there is a unit sum constraint(Aitchison, 1986) by which more time spent in one or morebehavioral categories must be associated with less time spentin one or more other behavioral categories. These compensatory shifts in estimates are absolute, leading to a dependentrelationship among behaviors constituting the time budgetbeing analyzed (Elston and others, 1996). Many compositionaldata-analysis procedures have been developed (for example,log-ratio procedures; Aitchison, 1986, 1992), but few areappropriate for data that exhibit real values of 0 or 1. It may beimportant that the amount of time an animal exhibits a givenbehavior is truly 0 percent or 100 percent. Many methods,such as log-ratio analysis, require data transformations thateliminate values of 0 and 1 by assigning very small or verylarge values (greater than 0 or less than 1) (Bakeman and others, 1992; Clark and Messina, 1998). This process ultimatelyalters the distribution of data and may adversely affect conclusions drawn about individual behaviors in the composition(Bingham and Brennan, 2004). Once transformed, the common method of log-ratio analysis also produces only quantitative statements about the overall distribution of the composition in comparison to another and the sampling distributionof the difference; it does not specify explicit contributions ofeach piece of the composition to those differences (Aitchison,1986). If your data are not composed of real values of 0 and1, log-ratio analyses may be appropriate. It is best suited forcompositions with only two elements since conclusions aboutthe change in allocation may be drawn easily (Elston and others, 1996), but most behavioral studies aim to address multiplebehaviors. Some extensions of the algebra of log-ratio compositional measures have been made by Billheimer and others(2001), but currently these procedures are limited to three-partcompositions and still suffer the restriction of not allowingzero proportions.One solution to the problem of comparing time-budgetcompositions with several behaviors and true values of 0 and 1is the use of a multi-response permutation procedure (MRPP;Mielke and Berry, 2007). This method does not require datatransformation and analyzes compositional differences byapproximating probabilities of a test statistic based on averageEuclidean distances for detecting distributional differences. Inother words, the test is focused on differences in multivariatecumulative distributions rather than means. This approachmay yield useful results for drawing conclusions about howdifferent animals or treatment groups allocate their time, butit still does not provide insightful conclusions about specificbehaviors within the composition of interest. No standardized way to approach this problem currently exists, but onesolution is simply to model each behavior to query furthercovariates and relationships of interest: analyze each part ofthe behavioral composition as a univariate dependent variable.For such results to be interpretable, however, the same modelsmust be applied and presented for all individual behaviors inthe composition.In simple compositions with few behaviors, the trade-offin time allocation may be evident. It is likely, however, thatsuch clear trade-offs will not always be evident and multiplemodels must be presented for each behavior. For example,consider a simple composition of three horse behaviors
4 Quantifying Equid Behavior—A Research Ethogram for Free-Roaming Feral Horses(Yf feeding, Yr resting, and Yl locomotion, where Yf Yr Yl 1.0). If Yf has a strong linear increase with the predictorvariable X1 (for example, 0/1 indicator variable of sex) and aweak linear increase with predictor variable X2 (for example,herd size), then Yr , Yl , or both must decrease with X1, butthe actual magnitude of that decrease will depend on bothbehaviors and the degree to which they also are influencedby X2 (model 1 is Y f(X1 X2)). It could easily be that thestrongest model for Yr might include X2 and another predictor(say X3, and model 2 is Y f(X1 X3)). Thus, it is possiblefor model 1 to be strongly selected for analyzing the Yf partof the Y compositional vector of behaviors but model 2 to bestrongly selected for the Yr part of the composition. Likewise,one model may be strongly supported for several behaviorsand a complement model may be strongly supported for theremaining behaviors in the composition (see Ransom, 2009);however, because the behavioral composition really inducesa relationship among the parts of the composition, statisticalmodel results will be uninterpretable if a selected model is notconsidered to apply to all parts of the behavioral composition(for example, Yf , Yr, and Yl).The increasing use of maximum-likelihood and Bayesian approaches for solving complex problems may ultimatelylead to the development of more lucid guidelines for manyproblems indicative of behavioral data. These methods canprovide powerful tools for analyzing scientific data and canlead to a deeper understanding of the processes and errorsinvolved (Hobbs and Hilborn, 2006). Regardless of thestatistical approach, the path toward proper model selectionfor individual dependent behaviors in a composition has notbeen described in the literature. The use of model weights andmodel averaging may assist in drawing coherent conclusionsabout parameters of interest (Burnham and Anderson, 2002),but all supported models must be considered simultaneouslyfor all dependent compositional variables to avoid violatingthe inherent statistical assumptions. A reasonable approachto assessing strength of evidence for compositional models,without violating assumptions of dependence, is to sum theminimum Akaike’s Information Criteria (AIC: Burnham andAnderson, 2002) scores for the individually-modeled constituent behaviors in a composition; subsequently, each sum thenforms an aggregate AIC score for each compositional model.The strength of evidence for the overall composition may thenbe assessed using AIC weights as Burnham and Anderson(2002) describe for individual models.expressions into broad categories since data collection onevery specific behavior expressed is usually impractical andmakes analyses excessively difficult. Therefore, this ethogramdivides behavioral expressions into 13 discrete categories thatcover the range of expressions a feral horse may exhibit infree-roaming conditions. Two additional categories (humanawareness and out-of-sight) are used to account for biasedobservations. These 13 categories can easily be further aggregated a posteriori if desired, but categorizing these behaviors separately a priori allows for a wider range of possibleanalyses while still being practical for data collection. Anexample of a broader aggregation of these categories is theconsolidation of grooming, comfort, standing attentive, andelimination into maintenance; herding, reproduction, haremtending, harem social, agonism, and submission into social;and human awareness and out-of-sight (unavailable to theobserver) into unknown (fig. 1). At any given time during thecourse of observation, a focal animal will be exhibiting behavior that can be described by one of these categories. Developing a research ethogram from the several hundred behavioralexpressions documented in equids can be a daunting task;therefore, this basic ethogram for feral horses is presented as astarting point for behavioral studies. For an excellent ethogramresource detailing complete equid behavior expressions, thereader is referred to McDonnell (2003). For a comprehensivework on equine behavior, the reader should also see Waring(1983).EthogramThe second largest amount of time in the daily timebudget of feral horses is allocated to resting, which may occurduring 25–35 percent of the daylight hours (fig. 1). Restingbehavior is characterized by a general lack of attention andrelaxed state and may occur in a standing position or in recumbenc
U.S. Department of the Interior. U.S. Geological Survey. Techniques and Methods 2-A9. Cover photo by Jason Ransom. Quantifying Equid Behavior—A Research . . and a better research design to capture infrequent behavioral expressions. In sampling feral horse behavior, the USGS study found that instantaneous scan sampling (the method of record- .