Transcription
Lithos 206–207 (2014) 52–64Contents lists available at ScienceDirectLithosjournal homepage: www.elsevier.com/locate/lithosInvited review articleAdvances in Fourier transform infrared spectroscopy of natural glasses:From sample preparation to data analysisF.W. von Aulock a,b,⁎, B.M. Kennedy a, C.I. Schipper f, J.M. Castro e, D. E. Martin g, C. Oze a, J.M. Watkins d,P.J. Wallace d, L. Puskar g, F. Bégué a, A.R.L. Nichols c, H. Tuffen haDepartment of Geological Sciences, University of Canterbury, PB 4800, Christchurch 8140, New ZealandSchool of Environmental Sciences, University of Liverpool, Liverpool, UKResearch and Development Center for Ocean Drilling Science, Japan Agency for Marine Earth Science and Technology (JAMSTEC), 2-15 Natsushima-cho, Yokosuka, Kanagawa 237-0061, JapandDepartment of Geological Sciences, University of Oregon, Eugene, OR 97403, USAeInstitute of Geosciences, Johannes Gutenberg University Mainz, J.-J.-Becher-Weg 21, D-55128 Mainz, GermanyfSchool of Geography, Environment and Earth Sciences, Victoria University of Wellington, Wellington 6012, New ZealandgAustralian Synchrotron, 800 Blackburn Rd, Clayton, VIC 3168, AustraliahLancaster Environment Centre, Lancaster LA1 4YQ , UKbca r t i c l ei n f oArticle history:Received 10 April 2014Accepted 19 July 2014Available online 30 July 2014Keywords:FTIRFourier transform infrared spectroscopyVolcanic glassAnalytical methodsVolatilesa b s t r a c tFourier transform infrared spectroscopy (FTIR) is an analytical technique utilized to measure the concentrationsof H and C species in volcanic glasses. Water and CO2 are the most abundant volatile species in volcanic systems.Water is present in magmas in higher concentrations than CO2 and is also more soluble at lower pressures, and,therefore it is the dominant volatile forming bubbles during volcanic eruptions. Dissolved water affects bothphase equilibria and melt physical properties such as density and viscosity, therefore, water is important for understanding magmatic processes. Additionally, quantitative measurements of different volatile species using FTIRcan be achieved at high spatial resolution. Recent developments in analytical equipment such as synchrotronlight sources and the development of focal plane array (FPA) detectors allow higher resolution measurementsand the acquisition of concentration maps. These new capabilities are being used to characterize spatial gradients(or lack thereof) around bubbles and other textural features, which in turn lead to new insights into the behaviorof volcanic feeder systems. Here, practical insights about sample preparation and analysis of the distribution andspeciation of volatiles in volcanic glasses using FTIR spectroscopy are discussed. New advances in the field of FTIRanalysis produce reliable data at high spatial resolution that can be used to produce datasets on the distribution,dissolution and diffusion of volatiles in volcanic materials. 2014 Elsevier B.V. All rights reserved.Contents1.2.3.Introduction . . . . . . . . . . . . . . . . . .Fourier transform infrared spectroscopy . . . . .2.1.Absorbance spectroscopy . . . . . . . . .2.2.Absorbance . . . . . . . . . . . . . . .2.3.Density . . . . . . . . . . . . . . . . .2.4.Thickness . . . . . . . . . . . . . . . .2.5.Dealing with microcrystalline glasses . . .2.6.Molar absorption coefficients . . . . . . .Different modes of FTIR measurements . . . . . .3.1.Transmission vs reflection FTIR spectroscopy3.1.1.Transmission FTIR spectroscopy .3.1.2.Reflectance FTIR spectroscopy . .3.2.Near-IR versus mid-IR . . . . . . . . . .⁎ Corresponding author.E-mail addresses: F.von-aulock@liverpool.ac.uk (F.W. von Aulock), ben.kennedy@canterbury.ac.nz (B.M. 7.0170024-4937/ 2014 Elsevier B.V. All rights reserved.53545454545557575757575757
F.W. von Aulock et al. / Lithos 206–207 (2014) 52–644.Sample preparation for transmission FTIR spectroscopy . . . . . . . . .4.1.Preparing your sample for optimal results . . . . . . . . . . . .4.2.Thickness of the sample . . . . . . . . . . . . . . . . . . . .4.3.Mounting and choice of adhesives . . . . . . . . . . . . . . .4.4.Polishing . . . . . . . . . . . . . . . . . . . . . . . . . . .4.5.Melt inclusions . . . . . . . . . . . . . . . . . . . . . . . .5.New analytical capabilities . . . . . . . . . . . . . . . . . . . . . .5.1.Synchrotron IR sources . . . . . . . . . . . . . . . . . . . .5.2.Focal plane array detectors and data volumes in imaging FTIR . . .5.3.Data volumes and typical data collection parameters in imaging FTIR6.Data analysis for volatile concentration mapping in volcanic glass . . . .6.1.Measurement of maps and ways to display results . . . . . . . .7.Applications in volcanology . . . . . . . . . . . . . . . . . . . . . .8.Conclusions . . . . . . . . . . . . . . . . . . . . . . . . . . . . .Acknowledgments . . . . . . . . . . . . . . . . . . . . . . . . . . . .References . . . . . . . . . . . . . . . . . . . . . . . . . . . . . . . .1. IntroductionVolatiles are the driving force behind volcanic eruptions (Sparks,1978). Dissolved volatiles drastically change the physical and chemicalproperties of silicate melts and magmatic rocks (Hess and Dingwell,1996). Therefore, high spatial and quantitative resolutions are essentialfor understanding volcanic and magmatic processes from melting ofthe mantle wedge to the growth of bubbles in volcanic eruptions(e.g. Cashman and Sparks, 2013; Lowenstern, 1995; Plank et al.,2013; Wallace, 2005). Specifically, the spatial distribution of volatiles in volcanic glasses records diffusion processes and can providea quantitative estimate of the timescales and temperatures of hydrationor dehydration mechanisms; such as the growth of bubbles (Castroet al., 2005; Kennedy et al., 2010; McIntosh et al., 2014; Watkins et al.,2012), lifetime of diffusion pathways in high-temperature melts(Berlo et al., 2013; Cabrera et al., 2010; Castro et al., 2012), hydrationof archeological artifacts (Liritzis and Laskaris, 2011; Stevenson andNovak, 2011) and natural volcanic glasses (von Aulock et al., 2013), orthe formation of crystals (Castro et al., 2008; Gardner et al., 2012;Seaman, 2013; von Aulock et al., 2013; Watkins et al., 2008). Furthermore the analysis of volatiles dissolved in glassy melt inclusions is themain tool used to constrain the volatile contents of magmas and assistin the understanding of deeper magmatic processes (e.g. Wallace,2005). For example, volatile contents of a population of glassy inclusions and groundmass record changes in volatile concentrations overtime, temperature and pressure, and comparison between and amongthem can help to establish models of degassing during magma ascent(Gonnermann and Manga, 2005; Mormone et al., 2011; Newmanet al., 1988; Rust et al., 2003).Numerous studies discuss analytical tools that can be used to measure volatiles in volcanic rocks (e.g. Cherniak et al., 2010; Devine et al.,1995; Ihinger et al., 1994). Methods for analyzing H2O and CO2 include:Fourier transform infrared spectroscopy (FTIR; the focus of this reviewarticle) (Behrens et al., 1996; Nichols and Wysoczanski, 2007; Stolper,1982a, 1982b), secondary ion mass spectrometry (SIMS) (Delaney andKarsten, 1981; Hauri et al., 2002; Hervig et al., 1989, 2003; Kilgouret al., 2013), Raman spectroscopy (Behrens et al., 2006), Karl Fischer titration (Turek et al., 1976; Westrich, 1987), thermo gravitational analysis (TGA) (Applegarth et al., 2013; Denton et al., 2009), and electronbackscatter methods (Berlo et al., 2013; Humphreys et al., 2008;McIntosh et al., 2014). Apart from availability, funding and other personal considerations such as the experience of the user, there are specific strengths and drawbacks to each analytical method.Fourier transform infrared (FTIR) spectroscopy measures the fundamental vibrations and associated overtones of the chemical speciespresent in a sample in the infrared region of the electromagnetic spectrum. FTIR instrumentation is comparatively simple (unless a synchrotron source is used) and can deliver accurate and precise th high spatial and quantitative resolutions (e.g. Devine et al., 1995;Ihinger et al., 1994; Newman et al., 1986; Stolper, 1982a, 1982b;Zhang, 1999). Specifically, a spatial resolution down to 3 μm can beachieved (Della Ventura et al., 2014; Miller and Smith, 2005). Discriminating different bonds in hydrous compounds is one of the majorstrengths of FTIR analysis and allows the quantification of hydrous species to determine equilibration timescales (Zhang et al., 2000) and recognize effects of low temperature hydration (Dixon et al., 1995).Depending on the absorption bands investigated and the sample thickness, the detection limit can be as low as 10 ppm for hydroxyl groups,molecular water or total water (at 3570 cm 1) and 25–50 ppm for Cas carbonate and as low as about 2 ppm for molecular CO2. These valuesare only rough estimates based on experience and depend largely onother properties of the sample such as thickness and optical propertiesas discussed later. A major drawback of this method is related to samplepreparation, which, in most cases requires a doubly polished, thin, unsupported wafer. Sample preparation can be challenging for verysmall samples (such as melt inclusions), fragile samples such as pumices or perlites, and for samples that need to be polished to very thinwafers. The measured values are directly proportional to the thicknessand water content of the sample and for very thin samples the qualityof the thickness measurements is often the biggest limitation to theaccuracy of quantitative measurements.Secondary ion mass spectrometry (SIMS) uses an ion gun to emitsecondary ions from the surface of the analyzed material, and the secondary ions are then collected by a mass analyzer. Samples only needto be polished on one side. Both the spatial resolution and detectionrange can be extremely high on the micrometer scale with detectionlimits down to parts per million (ppm) (Cherniak et al., 2010; Hauriet al., 2002; Hervig et al., 2003). Accurate quantitative measurementsrequire careful calibrations (often done in reference to FTIR data) andthe matrix effects of natural glasses can be complicated, requiring standards of similar chemical compositions. A limitation of this method isthat the characterization of water speciation is not possible (Herviget al., 2003; Ihinger et al., 1994), but the SIMS method is capable of analyzing the hydrogen and carbon isotope ratios (e.g. Shaw et al., 2008).Raman spectroscopy is based on molecular vibrations caused by thescattering of light from a sample (Ihinger et al., 1994). The use of a coherent light source (i.e., a laser) allows for higher spatial resolutionthan conventional FTIR, and calibrations for quantitative measurementsare rapidly improving (e.g. Behrens et al., 2006; Di Muro et al., 2006; LeLosq et al., 2012). Before Raman spectroscopic measurements can beused as a reliable quantitative method, combined studies with FTIRare necessary to provide a reliable calibration.A way of determining bulk water concentrations without the use ofspectroscopic methods is to force complete degassing by heating thesamples to high temperatures in a furnace. The released gas can thenbe detected by quantitative methods with low detection limits via Karl
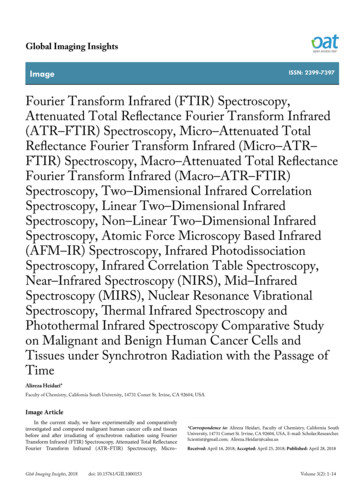
54F.W. von Aulock et al. / Lithos 206–207 (2014) 52–64Fischer titration (e.g. Turek et al., 1976; Westrich, 1987) or by thermogravimetric methods, wherein weight loss during heating may beaccompanied by exsolved gas analysis using mass spectrometry(e.g. Denton et al., 2009), or by vacuum manometry. These techniqueshave commonly been used in calibrating the FTIR method for analysisof volcanic glasses (Ihinger et al., 1994). The advantages of this methodare that it is inexpensive as it does not require sophisticated instrumentation and sample preparation. Also, the degassing temperatures potentially contain information about volatile species degassing patterns(Applegarth et al., 2013; Tuffen et al., 2012). However, the processesof degassing at high temperatures are not yet fully understood, norare the impacts of sample preparation. The discrimination of water orcarbon dioxide from other volatiles such as halogens can be difficult.Further disadvantages of this method are that it also measures adsorbedvolatiles and the contents of fluid inclusions and minerals, in addition tothe volatiles dissolved in the glass, and the method is also sampledestructive.Backscattering of atoms at the surface in nuclear microprobes usedin elastic recoil detection (ERD) or Rutherford backscattering (RBS)can produce accurate and precise measurements of hydrogen contentsin volcanic glass. For example, the study of Bureau et al. (2009) gives alimit of 4 16 μm2 as a maximum spatial resolution and 94 ppm as a detection limit. Recent studies show promising results in the use of backscatter electron analysis for measuring water concentrations in volcanicglass (Humphreys et al., 2008; McIntosh et al., 2014), but matrix effectsand the impact of the polishing quality are not fully understood, therefore analyses have to be treated as qualitative. A nuclear microprobetechnique has been used to analyze C in glasses using the 12C(d, p) 13Cnuclear reaction (Spilliaert et al., 2006; Varela and Metrich, 2000;Varela et al., 2000). The minimum detection limit for carbon variesfrom 40 to 15 ppm, and the uncertainty (1σ) using reference basalticglasses containing 300 and 100 ppm of carbon is 10%.Despite a number of analytical methods being suited for volatileanalysis in volcanic glasses, funding and availability often limit thechoice. FTIR spectroscopy is a widely available, well-documented method and is, therefore, preferred by many scientists. The list of methods,however, is constantly growing, which makes it important to reviewthe choice of analytical method regularly based on recent developmentsin literature and technology. Detailed reviews of the analytical methodsmentioned exist as overview chapters (e.g. Cherniak et al., 2010; DellaVentura et al., 2014; Ihinger et al., 1994). Comparatively, the increasingpossibilities for volatile analysis and the increasing body of literatureavailable on analytical FTIR techniques make this an ideal method formany applications when measuring volatile contents of volcanic glass.In the following sections, we provide an overview of recent techniquesand developments in FTIR and share our practical experience in samplepreparation, measurement and analysis of the resultant data.2. Fourier transform infrared spectroscopy2.1. Absorbance spectroscopyInfrared spectroscopy is based on the absorption of light due to characteristic vibrations of molecular species in the infrared spectral region.The Beer–Lambert Law (also called Bouguer–Beer–Lambert Law or simplyBeer's Law) states that the absorbance A (dimensionless), which is thecommon logarithm of the ratio of the intensity of transmitted light I (dimensionless) over incident light I0, is proportional to molar concentration c (mol·l 1), path distance of the light through the sample l (cm),and a constant, ϵ (L·mol 1·cm 1), the molar absorptivity of the sample.A ¼ log10I¼ ϵ l c:I0ð1ÞAbsorbance therefore is dimensionless, l is in cm, ϵ is inL·mol 1·cm 1, and concentration expressed as the molar concentration(mol·l 1). In Earth sciences, mass fractions (w in kg·kg 1) are morepractical, which leads to:w¼A Mϵ l ρð2Þwith M as the molar mass (in g·mol 1) of the absorber and ρ as the density (in kg·m 3). For quantitative measurements, the absorbance, density, thickness and the molar absorption coefficient of a sample are neededto determine the weight fraction of a substance such as water in a sampleby infrared spectroscopy. In FTIR, all wavelengths of the spectral area arecreated by a Michelson interferometer and the produced interferogram istransformed into a spectrum by a Fourier transformation. In a Michelsoninterferometer, the incoming beam of light passes through a half translucent mirror (i.e. the beam splitter) and interferes with the incomingbeam while the additional beam path oscillates. This creates an interference pattern of the wavelengths of interest within a short period oftime. In contrast to a prism, the light does not have to pass through asmall slit and the intensity of passing light remains high. Further, one interferogram contains absorbance data across the whole spectral region,and a set of tens of scans can be performed in seconds to minutes; the absorbance of all relevant species can therefore be measured at high signalto-noise concurrently. For more specific information, Cherniak et al.(2010) and Ihinger et al. (1994) cover the basics of FTIR spectroscopy inmore detail.2.2. AbsorbanceThe characteristic vibrations of H and C species are usually elucidated by the absorption of light in the region of near- and mid-IR (atwavenumbers of 1400–8000 cm 1). The vibrations of the volatile species can either be bending or stretching, or a combination of the twoin two (e.g., OH and H2O) or three dimensions (e.g. CO2 3 ), resulting inseveral peaks in an absorbance spectrum (see Fig. 2 and e.g. Nakamoto,2006). In addition, vibrations show overtones at higher wavenumbersin the near-IR region (see Fig. 2). These overtone peaks are usuallyweaker (at constant volatile concentrations and thickness) and, inglasses, typically less convoluted than the absorption peaks in themid-IR region (making them the preferred bands for quantitative measurements of species at high volatile contents if the background in thenear-IR are well fit). The absorbance of each peak is measured by measuring the maximum difference between the peak and a baseline, or the areabetween the peak and a baseline. Baseline choice depends on the type ofbaseline used in constraining the chosen epsilon value. The most widelyused is a linear baseline between the minima on each side of the peak. Itis the easiest to define and most reproducible between workers. However, in steep areas and on shoulders, such as around the CO2 3 peaks, it canbe difficult to apply. Alternatively, baselines have been defined with aflexicurve (Di Matteo et al., 2004; Zhang et al., 1997), curve equations(e.g. Dixon et al., 1995) and using degassed samples that are otherwiseequivalent to those being analyzed (e.g. Dixon et al., 1988).2.3. DensityWater has a significant influence on the density of glasses (Ochs andLange, 1999) and for water contents different to the measured glass orstandard material with literature values the final glass density has tobe calculated by iteration. The density of natural glasses can be modeledusing the equations given by Lange and Carmichael (1987); Lange(1997), a model for silicate melts at high temperatures, by extrapolatingto room temperature. Partial molar volumes can also be used from Ochsand Lange (1999). Densities of silicate glasses are complex and a number of factors have to be considered (Ardia et al., 2014; Ochs andLange, 1999; Richet et al., 2000). Measurements can be used to verifybulk densities and Archimedian methodologies such as in Richet et al.(2000) and Lange and Carmichael (1987) are very precise and accurate.
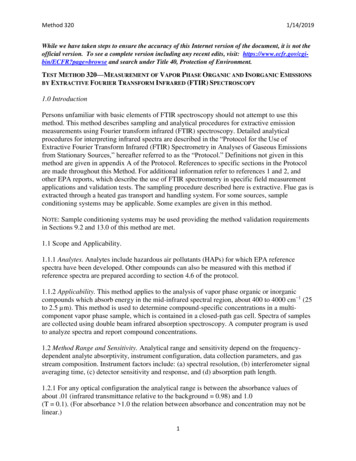
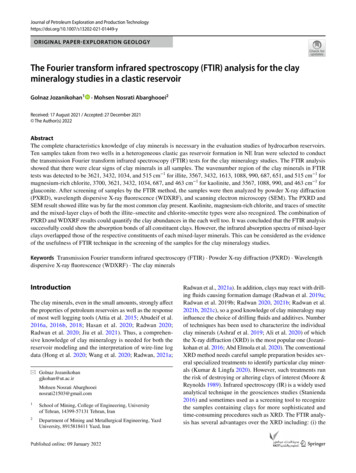
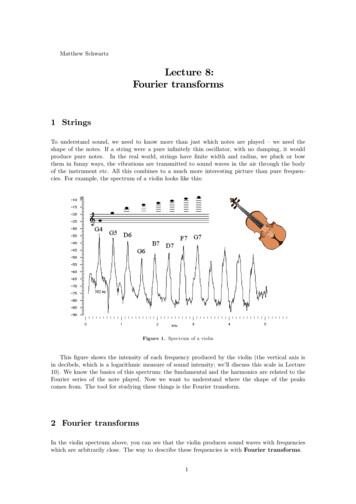
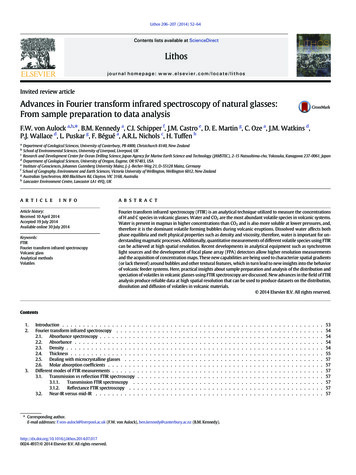
F.W. von Aulock et al. / Lithos 206–207 (2014) 52–6455(see Eqs. (1) and (2)). The most common methods for determiningsample thickness are:Fig. 1. Example of the use of absorbance on the 1830 cm 1 band for determining rhyoliteglass thickness. Method, baseline fitting, and correlation between absorbance and thickness following Miwa and Toramaru (2013). Example is a rhyolite obsidian from the2008 obsidian dome at Volcan Chaitén (Chile). Top panel shows apparent glass thicknessas determined from the 1830 cm 1 that represents vibration of Si\O bonds. Bottom panelshows transmitted light photomicrograph of sample and absorbance on the 3550 cm 1H2O peak. Note that fluctuations in the determined thickness correspond to identifiableimpurities and/or obstacles in the beam path (bubbles and crystals), so that the precisionat each spectral measurement point is higher than with the digital micrometer (averagethickness 50 μm). However, thickness measurements are subject to edge effects at component margins, and also to fluctuations in an automatically-fitted baseline (OPUS software package), so that some caution is required when interpreting the results.A lot of standard laboratory scales can be modified for this purpose withreadily available accessories that are user friendly.2.4. ThicknessThickness measurements are a major concern for thin samples asthis can possibly introduce large errors in quantitative measurements Use of micrometers or digital displacement gauges: These are probably the most common ways to measure thickness, with a maximumaccuracy of 2–3 μm. The main issue with these is that the pointedtip of the micrometer can break the sample if not used carefully. In addition, if the sample is very porous the tip can sink into the sample,both damaging it and making the measurement unreliable. By usinga flat tip, this can be avoided, however, this will only measure maximum thickness in contact with the tip. It is also not confined to asmall spot on the sample, and thus may not necessarily match to theposition of the data collection. Nevertheless, for thick samples this isthe most reliable and quickest method of gauging sample thicknessand should also be performed as a reference measurement on allsamples. Interference fringes: When using FTIR spectroscopy, counting thespectral fringes that are produced by interference of the primarysource of light and the light of internal reflections within the sampleallows the thickness to be accurately determined. Nichols andWysoczanski (2007) determined a maximum standard derivation of 3 μm when compared with measurements with a digital displacement gauge. For a lot of samples, the internal reflections in the samplewafer are sufficient when measured in transmission mode, however, ahigher signal-to-noise ratio of the interference fringes can be achievedwhen the sample is placed on a gold backing plate (to create a highlyreflective surface for background measurements) and reflectancemode is used. The number of fringes can then be counted in a spectralregion showing no chemical absorptions, for example with these samples the region between 2000 and 2700 cm 1 is commonly used, andthe thickness determined using the following relationship:d¼m2nðν1 ν2Þð3Þwhere m is the number of waves in a selected wavenumber range, n isthe refractive index (dimensionless) of the sample and v1 and v2 (incm-1) are the highest and lowest wavenumbers respectively definingthe selected interval (Wysoczanski and Tani, 2006). The largest contribution to error in these measurements is caused by the estimationof the refractive index (Nichols and Wysoczanski, 2007). This methodcan however be successfully used for glassy, well polished samples ofFig. 2. Spectra of volcanic glass in the near- and mid-IR regions. The near-IR curve of a rhyolitic glass (brown) with total water contents of 4.3 wt.% shows the overtone and combinationbands of hydroxyl and water. This is a thicker sample and therefore the absorbances are higher compared to the other curves. The mid-IR curves of basalt all show different contents inwater and carbon dioxide species. The gray curve shows typical interference fringes in reflective mode.This curve is adapted from Nichols and Wysoczanski (2007).
56F.W. von Aulock et al. / Lithos 206–207 (2014) 52–64about 5–150 μm in thickness, where precision is higher for measurements of samples 100 μm (von Aulock et al., 2013). Commercialsoftware such as OPUS by Bruker implements tools to automaticallydetermine thicknesses based on interference fringes. This makes it aconvenient method for the evaluation of large quantities of data inmaps of samples with variable thickness. However, the peak count ishighly dependent on the noise in the analyzed spectra and automaticdata analysis might not provide sufficient control and transparencyfor scientific applications on natural samples. Calibrated microscope stages: z-calibrated stages of microscopes withvisible-light capability can make very precise measurements of samples of almost any thickness, by measuring the vertical displacementbetween the focused surfaces of the wafer. Calibrations should be performed regularly to eliminate drift. Optical profilometers, which use interferometry and/or confocal microscopy to analyze surface topographies of small samples are commercially available, such as the Leica DCM 3D series and can have avertical resolution of b 4 nm (Ventura et al., 2012). Thickness determination using Si\O stretching on 1830 cm 1:(Miwa and Toramaru, 2013) presented a calibration of thickness measurements that use the linear relationship between absorbance nearthe 1830 cm 1 band and the vibration of Si\O bonds in the glass(Zhang et al., 2002). By cross-correlation with thickness determinedby reflectance interference fringes and digital micrometer, they determined the following relationship for thickness in an obsidian glass(Miwa and Toramaru, 2013):d ¼ 0:0340 0:0006Abs1830 :ð4ÞThis technique has several limitations. It is not applicable to basalts,especially those that are hydrous, because the 1830 cm 1 is subordinate to, and partially overlapping with, the OH band at 1630 cm 1,and has only been calibrated for one obsidian sample over a H2O content range of 0.01 to 0.66 wt.% (Miwa and Toramaru, 2013). It does,however, have the potential to be very useful for automatic thicknessdeterminations in high-SiO2 glasses for several practical reasons. Firstly, the main strength of using reflectance to determine thickness isgained by having the reflectance interference fringes collected fromthe exact same analytical spot as the transmitted spectra; however,it may not always be possible to rapidly shift between transmittedand reflected modes on a given FTIR microscope. While quick changeover is possible on many desktop micro- and FPA-FTIR systems, theswitchover is not straightforward on many synchrotron systems.Being able to use the 1830 cm 1 band on the transmitted light spectrathus circumvents the need to collect two types of FTIR spectra. For individual spot analyses, manual selection does not pose a major problem, but for FPA or map analyses, the number of spots makes manualcorrection of each spectrum impractical. Conversely, the measurement of peak absorption on a linear baseline — as is used in the1830 cm 1 thickness determination allows automatic visualizationof sample thickness variation just as one would automatically visualize volatile species distributions by selecting the appropriate peaks. Inprinciple the volatile peaks in each spectrum within an FTIR image canbe normalized to the 1830 cm 1 peak using the software, producingan image that represents concentration, assuming compositional homogeneity, and not just absorbance.However, recent tests on a Chaitén (Southern Chile) low-vesicularityobsidian sample at the Australian Synchrotron that included traversesthrough obsidian glass and across bubbles and small clinopyroxenephenocrysts reveal potential issues (Fig. 1). Applying an automatic determination of sample thickness using the 1830 cm 1 peak withOPUS software package does effectively yield a bulk thickness acrossclear portions of glass, but it does not clearly delineate the presenceand size of the bubbles and/or clinopyroxene crystals (e.g. Fig. 1). Instead, the transmittance spectra deviate from linear baselines due torefraction about the non-orthogonal edges of the feature, causingartifacts in the thickness determinations, and the Si\O bonds in theclinopyroxene contribute to the absorbance on the 1830 cm 1 peak.These are important observations, because Miwa and Toramaru(2013) originally employed the 1830 cm 1 technique to determineeffective glass thicknesses that eradicated the effects of microlites inthe beam path, but the example shown in Fig. 1 suggests that thismay not be an appropriate use of the otherwise valid technique. Theuse of the 1830 cm 1 vibrational signature of Si\O bonds holds agreat deal of promise for automated thickness determination ofhigh-SiO2 glasses, but requires further development and careful applications to compositions different to those used for calibration byMiwa and Toramaru (2013). The thickness of melt inclusions can be measured by these techniquesas long as they are exposed on both sides and there is no contamination from the host crystal in the FTIR spectra (Mormone et al., 2011).However, owing to their small size, it is often difficult to expose an inclusion on both sides. In order to ease sample preparation and dramatically increase the number of inclusions that can be targeted forFTIR a
Fourier transform infrared spectroscopy (FTIR; the focus of this review article) (Behrens et al., 1996; Nichols and Wysoczanski, 2007; Stolper, 1982a, 19