Transcription
Journal of Applied Pharmaceutical Science Vol. 8(09), pp 107-113, September, 2018Available online at http://www.japsonline.comDOI: 10.7324/JAPS.2018.8916ISSN 2231-3354Liquid Chromatography and Fourier Transform InfraredSpectroscopy for quantitative analysis of individual and totalcurcuminoid in Curcuma longa extractRatna Wulandari1,2, Sudjadi1, Sudibyo Martono1, Abdul Rohman1*12Department of Pharmaceutical Chemistry, Faculty of Pharmacy, Universitas Gadjah Mada, Yogyakarta, 55281, Indonesia.The National Agency of Drug and Food Control, Republic of Indonesia.ARTICLE INFOABSTRACTArticle history:Received on: 11/03/2018Accepted on: 23/07/2018Available online: 30/09/2018Analysis of individual and total curcuminoid composed of curcumin (CUR), desmethoxycurcumin (DMCUR) andbisdemethoxycurcumin (BDMCUR) in Curcuma species is very important. Curcuminoids are frequently used asmarkers in herbal medicine involving the use of Curcuma species in its formulation. The objective of this study was tovalidate high-performance liquid chromatography (HPLC) and Fourier transform infrared spectroscopy-partial leastsquare (FTIR-PLS) for quantitative analysis of total and individual curcuminoids in turmeric (Curcuma longa L.)extract. The turmeric powder was macerated using ethanol and evaporated to obtain an ethanolic extract. The actualcontents of individual curcuminoids of CUR, DMCUR, and BDMCUR were determined using HPLC. FTIR-PLS canbe used for quantitative analysis of individual and total curcuminoids using specific wavenumbers. The coefficient ofdetermination (R2) for the relationship between actual values and FTIR-PLS predicted values for calibration, internal,and external validation was 0.98 which indicated good accuracy. The relatively low values of errors in calibration,validation and external validation indicated good precision. FTIR spectroscopy-PLS can be used as an alternativetechnique over HPLC for determination of individual and total curcuminoid in turmeric extracts.Key words:Curcuma longa Linn,curcuminoid, partial leastsquare, HPLC, FTIRspectroscopy.INTRODUCTIONThe use of turmeric (Curcuma longa Linn) as a rawmaterial in herbal medicines and food products has increasedsignificantly (Liang et al., 2004; Gad et al., 2013). Because ofits composition especially curcuminoid, turmeric is known asfunctional food components, turmeric has been reported to haveantibacterial, antiinflammation, and antioxidant activities dueto high contents of curcuminoid (Sing et al., 2002; De et al.,2009; Anubala et al., 2014), neuroprotective (Issuriya et al.,2014), immunomodulatory (Rogers et al., 2010), antidiabetic(Wickenberg et al., 2010), as well as antitumor and anticanceractivities (Aggarwal et al., 2003; Wilken et al., 2011). Becauseof high antioxidant activities, turmeric has been widely used incosmetics, nutraceuticals, and phytomedicines (Paulucci et al.,Corresponding AuthorAbdul Rohman, Department of Pharmaceutical Chemistry, Faculty ofPharmacy, Universitas Gadjah Mada, Yogyakarta, 55281, Indonesia.E-mail: abdul kimfar @ ugm.ac.id*2013).In order to assure the quality of herbal materials fromone batch to other batches, it is important to determine the levelsof chemical compounds responsible for the biological activities.Curcuminoid in turmeric, especially curcumin, has been used as achemical marker during biological activity evaluation (Gupta et al.,1999). According to Indonesian Herbal Pharmacopeia, turmericextract should contain minimum 33.90% of total curcuminoidwith moisture content less than 10% (Ministry of Health, 2008).Indeed, analytical techniques capable of quantifying curcuminoid(total and individual) should be developed.Some analytical techniques have been developed andused for quantitative analysis of curcuminoid, namely thin layerchromatography-densitometry (Péret-Almeida et al., 2005), highperformance liquid chromatography using ultraviolet-visible andelectrochemistry detectors (Inoue et al., 2008; Syed et al., 2015),liquid chromatography-mass spectrometry (Asai and Miyazawa,2000), and capillary electrophoresis (Jiang et al., 2006). Dueto its capability to provide separation among components in 2018 Ratna Wulandari et al. This is an open access article distributed under the terms of the Creative Commons Attribution License -NonCommercialShareAlikeUnported License ).
108Wulandari et al. / Journal of Applied Pharmaceutical Science 8 (09); 2018: 107-113samples, chromatography-based methods are a method of choicefor analysis of multicomponent such as in extract; however, thesemethods are time-consuming and involving the use of excessivechemicals and reagents. Therefore, there is a need to developanalytical techniques capable of quantifying analytes using somesimple methods based on spectroscopy such as near-infraredspectroscopy (Tanaka et al., 2008) and mid-infrared spectroscopy(Rohman et al., 2015).Fourier transform infrared (FTIR) spectroscopy ispromising techniques for the quantification of curcuminoid due toits capability to provide fast and green analytical technique, withminimum sample preparation step (Bunaciu et al., 2011; Rohman,2012). Combined with multivariate calibration, FTIR spectroscopycan be used as an alternative technique for chromatographictechniques. Tanaka et al. (2008) have analyzed individualcurcuminoid of curcumin (C), desmethoxycurcumin (DMC) andbisdemethoxycurcumin (BDMC) and total curcuminoid (as a sumof C DMC BDMC) using near infrared at 1650-1780 nm. Inthis study, mid-infrared (4000-400 cm 1) was used due to morepeaks obtained, as consequence, the modeling of PLS using morepeaks was more achievable (Bunacie et al., 2011). Rohaeti et al.(2015) using FTIR spectroscopy in combination with principalcomponent analysis (PCA) and canonical variate analysis (CVA)for identification and classification of turmeric, temulawak(Curcuma xanthorhiza) and bengle (Zingiber cassumunar). Inour best knowledge, there is no report regarding the applicationof FTIR spectroscopy for analysis of individual and totalcurcuminoid using HPLC and FTIR spectroscopy combined withPLS. In this research, the individual curcuminoid was isolatedfrom the mixture using column chromatography and the isolatedcompounds obtained was used for quantification using HPLC andFTIR spectroscopy combined with PLS regression.with photodiode array detector at 425 nm using an internalnormalization technique (relative percentage).MATERIALS AND METHODSCurcuminoid containing CUR, DMCUR and BDMCURwas purchased from E. Merck (Darmstadt, Germany) withcurcuminoid contents 94%. Turmeric was obtained from severalregions of Java (East Java, Central Java, West Java, Yogyakarta,and Jakarta). The synthetic curcumin was kindly given by Prof. Dr.Sudibyo Martono from Department of Pharmaceutical Chemistry,Faculty of Pharmacy, Universitas Gadjah Mada, Indonesia.The solvents used for mobile phase were of HPLC grade. Theother solvents and reagents were of pro-analytical grade unlessotherwise was specified.Validation of HPLC methodThe optimized HPLC condition was subjected tovalidation according to International Conference Harmonization(ICH, 2005) by assessing several parameters namely: selectivity,linearity and range, limit of Detection (LoD), limit of quantification,precision, and accuracy.Isolation of C, DMC, and BDMCIsolation of curcuminoid (with curcuminoid contents 94%) from E. Merck into CUR, DMCUR and BDMCUR wascarried out according to Péret-Almeida et al. (2005) using columnchromatography with stationary phase of silica gel 60 for columnchromatography (230–400 mesh) (Merck, Darmstadt, Germany),with mobile phase of chloroform-methanol delivered in gradientmanner. Each fraction obtained was subjected to TLC, and thefraction containing the same curcuminoid was compiled. Thesolvent was evaporated using a vacuum rotary evaporator, andthe powder obtained was determined for its purity qualitativelyusing TLC with three different mobile phase systems. The purityof individual curcuminoids was also determined using HPLCPreparation of ethanolic extract of turmericThe samples of turmeric were cleaned from any dirty,cut into small using the commercial cutter, and dried using aconventional oven at 50 C. The dried turmeric was powderedusing a grinder and subjected to sieving using mesh 40. A-50 gramof powdered turmeric was subjected to maceration using 500 mLethanol 90% in aquadest for 24 hours (Tanaka et al., 2008). Themacerate was filtered and the supernatant was evaporated using avacuum rotary evaporator at 50 C to obtain an ethanolic extract.The ethanolic extract was then fractionated using n-hexane twotimes, and the purified ethanolic extract was then added withamprotab (1 part extract:19 part amprotab) and subjected to FTIRspectroscopic measurement and HPLC analysis.HPLC analysis and validationThe condition of HPLC was optimized based onWichitnithad et al. (2009) to get the best separation among CUR,DMCUR, and BDMCUR. The final condition used during analysisof curcuminoid in ethanolic extract of turmeric was:Column:Waters X-bridge C18 (250 mm 4.6 mm i.d; 5 μm)Mobile phase:acetonitrile : acetic acid 2% inaquadest (50:50 v/v) deliveredisocratically at 1.0 mL/minDetector:PDA at 425 nmVolume of injection:20 uLColumn oven temperature:30 CFTIR spectroscopy analysisAnalysis of ethanolic extract of turmeric added withamprotab was performed using the sampling technique ofattenuated total reflectance (ATR) as in Rohman et al. (2015). Thesamples were directly placed on ATR crystal and its spectra werescanned using FTIR spectrophotometer ABB MB3000 (ClairetScientific, Northampton, UK), equipped with deuterated triglycinesulfate (DTGS) detector and beam splitter of germanium, andprocessed using Horizon MB FTIR software version 3.0.13.1(ABB, Canada). FTIR spectra were measured at mid-infrared(4000-650 cm 1) using a resolution of 4 cm 1 and number ofscanning of 32. All spectra were rationed against a backgroundof air spectrum. After every scan, a new reference air backgroundspectrum was taken. These spectra were recorded as absorbancevalues at each data point in duplicate.Statistical analysisThe analytical results obtained using HPLC was used
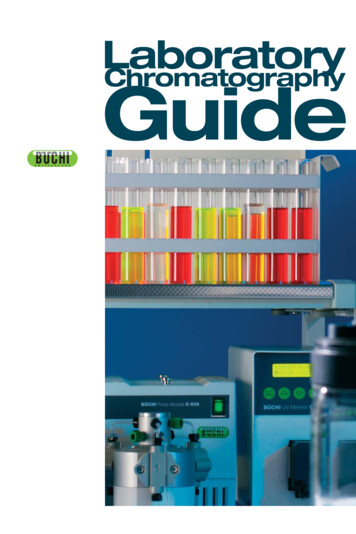
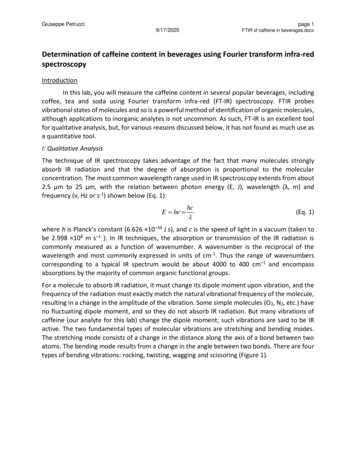
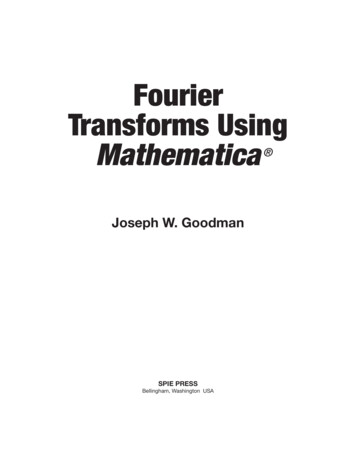
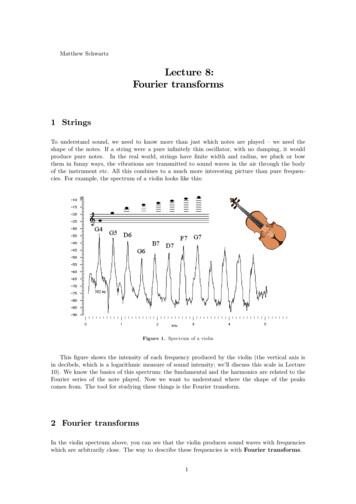
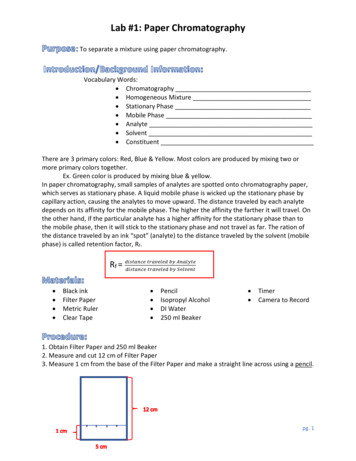
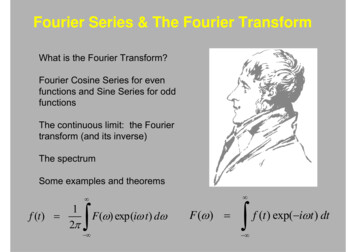
Wulandari et al. / Journal of Applied Pharmaceutical Science 8 (09); 2018: 107-113as actual content values of CUR, DMCUR, and BDMCUR andwere correlated with predicted values of CUR, DMCUR, andBDMCUR using PLS calibration. PLS is calibration model usedto solve problems involving high collinearity or to calculatecorrelated Y variables (Gad et al., 2013). PLS has been associatedwith other mathematical methods and algorithms, and the mostused algorithms to implement PLS regression is non-lineariterative partial least squares (NIPALS). The concentrationvariables (y-axis) are related to the predictor variables (x-axis)through auxiliary variables known as latent variables (factorsor components), which are linear combinations of the variablesx1, x2, , xK. These components are highly similar to principalcomponents calculated by principal component analysis. Minitabsoftware version 17 was used for statistical analysis during109calibration, internal validation using leave one out technique, andexternal validation.RESULTS AND DISCUSSIONThe reference standard of CUR, DMCUR, andBDMCUR used for quantitative analysis was isolated fromcurcuminoid using column chromatography. The isolatedcompounds of CUR, DMCUR and BDMCUR were analyzed usingTLC with three different polarity solvents. Figure 1 showed thatCUR, DMCUR, and BDMCUR were well separated. Curcuminis the major component in curcuminoid and is obtained relativelyeasy compared to DMCUR and BDMCUR. The purity levels ofCUR, DMCUR, and BDMCUR as determined using HPLC with aphotodiode array detector at 425 nm were of 99.92%, 98.53% and85.85%, respectively.Fig. 1: Thin layer chromatography profile of curcumin (C), demethoxycurcumin (DMC) and bisdemethoxycurcumin (BDMC) using three different solventswith stationary phase of silica gel GF254. System A chloroform:methanol:acetic acid (95:3:2 v/v/v); system B Toluene:acetic acid (9:1 v/v); and system C chloroform:aquadest:Ethanol (25:0.04:0.96). M Curcuminoid; SC synthetic curcumin.Due to its versatility, high-performance liquidchromatography (HPLC) was the method of choice fordetermination of curcuminoid because curcuminoid is relativelynon-polar and suitable to be separated using reversed HPLCcolumn (Prabaningdyah et al., 2017). HPLC was reference methodfor quantitative analysis of CUR, DMCUR and BDMCUR inethanolic extract of turmeric, and was optimized in order to meetthe requirement of system suitability test, namely resolution 2;tailing factor 1.8 and number of theoretical plate 10.000. Twocolumns, namely Waters X-bridge C18 (250 mm 4.6 mm i.d;5 μm) and Waters Spherisorb, C18, (250 4.6 mm, 5 μm) werecompared, and finally Waters X-bridge C18 was chosen withmobile phase of acetonitrile:acetic acid 2% in aquadest (50:50v/v) delivered isocratically at 1.0 mL/min. HPLC chromatogramof CUR, DMCUR, and BDMCUR obtained using optimumcondition was shown in Figure 2. The elution order of curcuminoidwas BDMCUR with tR of 6.795 min, DMCUR with tR of 7.43min, and CUR with tR of 8.130 min. This order was in agreementwith the polarity of curcuminoid, in which BDMCUR is morepolar than DMCUR and CUR.Validation of HPLC method for analysis of C, DMC, andBDMCHPLC was validated for quantitative analysis of CUR,DMCUR and BDMCUR in turmeric extract by determining severalparameters namely selectivity, linearity, limit of detection, limit ofquantification, accuracy, and precision according to InternationalConference on Harmonization (2005). The system suitability testindicated that HPLC system used was precise enough because therelative standard deviation (RSD) values of retention times and apeak area of CUR, DMCUR and BDMCUR from six replicateswere less than 2.0%. Besides, the resolution value (Rs) of 2, thenumber of a theoretical plate (N) 10.000, and tailing factor (TF) 2 were achieved as requested by United States Pharmacopeia.The selectivity of HPLC for separation of curcuminoidwas expressed with resolution value (Rs). The obtained Rs values
110Wulandari et al. / Journal of Applied Pharmaceutical Science 8 (09); 2018: 107-113of CUR, DMCUR and BDMCUR were 2.67, 2.59 and 15.56,respectively which indicated that the validated method wasselective enough for separation of curcuminoid. The linearity ofHPLC was assessed on concentration range of 0.4248-4.2484 µg/mL for CUR, 0.3139-1.8835 µg/mL for DMCUR, and 0.32881.644 µg/mL for CUR. The correlation coefficient (r) obtainedfor the relationship between concentration of CUR, DMCURand BDMCUR and peak area (y-axis) were 0.9995, 0.9996 and0.9996, with %y-intercept values of 3.43%, 3.21% and 6.17%,respectively. All r-values were higher than 0.999 indicating thatthe HPLC method was linear over the concentration range, whichcovers 50-150% from the target of analytes in the studied ethanolicextract of turmeric (ICH, 2005).Fig. 2: HPLC chromatogram of ethanolic extract of turmeric. BDMC bisdemethoxycurcumin with tR 6.795, DMC demethoxycurcumin with tR of 7.43 and C curcumin with tR of 8.130. Column Waters X-bridge C18 (250 mm 4.6 mm i.d; 5 μm), with column oven temperature of 30 C; mobile phase:acetonitrile:acetic acid2% in aquadest (50:50 v/v) delivered isocratically at 1.0 mL/min; detector photodiode array (PDA) at 425 nm.The precision of developed HPLC was assessed byrepeatability test and intermediate precision by analysis sixreplicates of homogeneous sample extract. RSD values of CUR,DMCUR, and BDMCUR were 1.34%, 1.42%, and 3.45%,respectively, lower than those requested by RSD Horwitz (i.e.4%) at a concentration level of 1% of target analytes (Gonzalezand Herrador, 2007). In addition, the recovery values for accuracystudies of CUR, DMCUR, and BDMCUR were studied by standardaddition methods by spiking CUR, DMCUR, and BDMCURinto the turmeric extract samples. The recovery values obtainedwere 98.05-100.38% for CUR, 99.30-101.60% for DMCUR, and99.97-100.0% for BDMCUR. These values are in agreement withthose specified in ICH (2005).The sensitivity of HPLC was expressed by determiningthe limit of detection (LoD) and limit of quantification (LoQ).The LoD and LoQ values obtained were 0.0040 µg/mL, 0.0037µg/mL, and 0.0049 µg/mL for CUR, DMCUR and BDMCUR,respectively, while LoQ values were 0.0162, 0.0104, and 0.0147µg/mL respectively. The values of LoD were confirmed byinjecting these concentrations 5 times, and RSD of 23.55% wasobtained indicating that LoD values were not precise enough tobe used as LoQ. In addition, the reported LoD and LoQ valuesof CUR were lower than those reported by Dandekar andPatravale (2009), i.e. 0.06 0.01 µg/mL and 0.21 0.045 µg/mL,respectively. However, LoD and LoQ values of this study werealso lower (more sensitive) than those reported by Cheng et al.(2010) using ultra performance liquid chromatography (UPLC)with uv-vis detector. LoD and LoQ values were 0.040 and 0.134µg/mL for CUR, 0.049 and 0.164 µg/mL for DMCUR, as well as0.029 and 0.098 µg/mL for BDMCUR, respectively.The validated HPLC method was subsequently used forquantitative analysis of CUR, DMCUR, and BDMCUR in thesamples, and the results were shown in Table 1. The concentrationsof CUR, DMCUR, and BDMCUR and curcuminoid total obtainedfrom HPLC analysis was used as actual values in PLS modelingduring prediction of CUR, DMCUR and BDMCUR using FTIRspectroscopy.Table 1: The concentration of curcumin (CUR), demethoxycurcumin (DMCUR)and bisdemethoxycurcumin (BDMCUR) in ethanolic extract of Turmeric obtained from Java region, Indonesia.RegionCURDMCURBDMCURCurcuminoid total*Bandung (West p (central Java)1.400.551.523.47Depok (west Java)1.410.580.892.88Magelang (central Java)1.200.461.012.67Bantul (Yogyakarta)1.680.611.023.31Karanganyar (central Java)1.610.520.963.09Kediri (East Java)1.880.520.893.29Kuningan (Jakarta)1.410.470.982.86Purworejo (central Java)1.050.330.622.00Sleman (Yogyakarta)1.410.551.293.25Sukaharjo (central Java)1.190.520.922.63Temanggung (central Java)1.370.611.173.15Wonogiri (central Java)0.760.290.521.57*Curcuminoid total is the sum of CUR DMCUR and BDMCUR.Analysis using FTIR spectroscopyFTIR spectroscopy is taken into account as the fingerprintanalytical technique used for qualitative and quantitative analysesof analyte(s) including Curcuma longa extracts (Prabaningdyah etal., 2018). To facilitate FTIR spectroscopy as quantitative analysismethod of curcuminoid in ethanolic extract of turmeric, PLS wasemployed for making the correlation between actual content valuesof curcuminoid as determined using HPLC and FTIR predicted
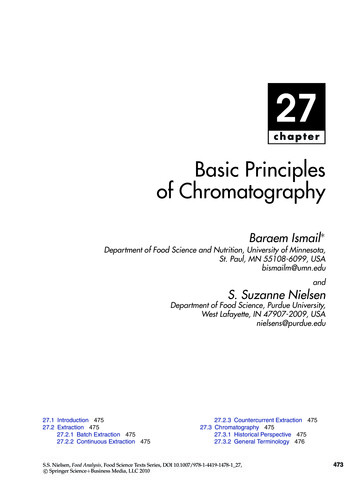
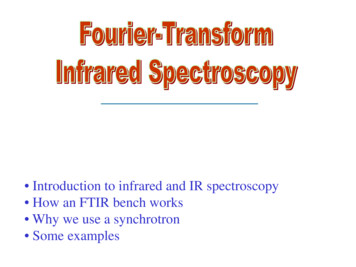
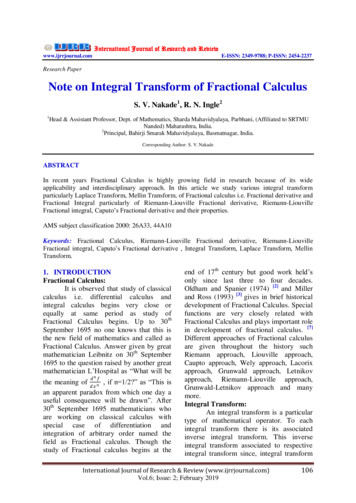
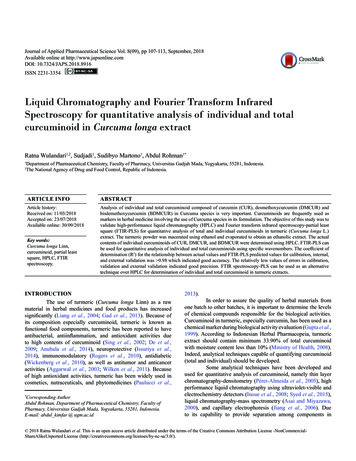
Wulandari et al. / Journal of Applied Pharmaceutical Science 8 (09); 2018: 107-113values using absorbance values at optimized wavenumbers. PLSis multivariate calibration technique based on inverse calibrationin which concentration (y-axis) was modeled with factors(combination of absorbance variables) in the x-axis (Miller andMiller, 2005). Figure 3 exhibited FTIR spectra of ethanolic extractof turmeric from several regions of Java, scanned at wavenumbers111of 4000-650 cm 1 along with main peaks corresponding to IRabsorption at specific wavenumbers. All functional groups inFigure 3 were representative of those of curcuminoid. These peakswere in accordance with those reported by Rohman et al. (2015),Rohaeti et al. (2015) and Prabaningdyah et al. (2018).Fig. 3. FTIR spectra of ethanolic extract of turmeric from 14 regions of Java, scanned at mid-infrared region (4000-650 cm 1) along with main peaks corresponding toIR absorption at specific wavenumbers.Analysis of curcuminoid with FTIR spectroscopycoupled with PLS calibration was performed in three steps,namely calibration, validation, and analysis of unknownsamples. Before calibration modeling, FTIR spectra of allsamples were subjected to optimization in order to get the bestregion capable of providing the acceptable correlation betweenactual values and FTIR predicted values of a curcuminoid andthe lowest errors. Optimization was performed by selecting thewavenumbers region and spectral treatments (Lestari et al., 2017).Finally, the wavenumbers of 1400-1720 cm 1 were preferred forquantification of CUR, wavenumbers of 1481-1747 cm 1 used forquantitative analysis of DMCUR, the combined wavenumbersregion of 1172-1226 cm 1 and 1469-1785 cm 1 used for analysisof BDMCUR, while the wavenumbers of 1407-1820 cm 1 wereexploited for analysis of total curcuminoid. Figure 4 revealed thecalibration model for the relationship between actual values ofCUR, DMCUR, and BDMCUR and total curcuminoid and FTIRpredicted values. The coefficient determination (R2) obtainedwere 0.9998 (CUR), 0.9999 (DMCUR), 0.9996 (BDMCUR)and 0.9999 (total curcuminoid). The root mean square error ofcalibration (RMSEC) values obtained were 0.469, 0.0035, 0.0063and 0.064 mg% for CUR, DMCUR and BDMCUR and totalcurcuminoid, respectively. The high value of R2 and low valuesof RMSEC indicated that FTIR spectroscopy using these specificwavenumbers were accurate and precise for quantitative analysisof curcuminoid. From figure 4, it is clear that results obtainedfrom HPLC were not significantly from those obtained by FTIRspectroscopy as indicated by the high R2 value.PLS calibration model was further validated using leaveone out (LOO) technique. In LOO, one of the calibration sampleswas removed from the calibration model, and the remainingsamples were used to make new PLS model. Subsequently, theremoved sample was computed using the new PLS regressionmodel. This manner was recurred, leaving each sample out in turn.The difference between the actual values and calculated valuesof CUR, DMCUR, and BDMCUR and total curcuminoid wascalculated (Miller and Miller, 2005). The validation models of C,DMC, BDMC and total curcuminoid during LOO resulting thepredicted residual error sum of squares (PRESS) of 1.4 10 6 forCUR, 2 10 7 for DMCUR, 4.4 10 6 for BDMCUR, and 2.6 10 6 for total curcuminoid. The low values of PRESS indicatedthat the calibration model was precise enough to be used foranalysis of CUR, DMCUR and BDMCUR, and total curcuminoidin unknown samples. However, based on results obtained duringexternal validation, RMSEP values of DMCUR and BDMCURwas too high, therefore, the developed model was not used forprediction of DMCUR and BDMCUR.Analysis of CUR and total curcuminoid in unknownsamples from Sleman and Sukoharjo, central Java using FTIRspectroscopy with PLS calibration model was performed. Theresults obtained were compared with those obtained using HPLCusing statistical Tukey test at a significance level of 0.05. There was
112Wulandari et al. / Journal of Applied Pharmaceutical Science 8 (09); 2018: 107-113no significant difference of results obtained by FTIR spectroscopyand HPLC (P 0.05). The P values were 1.25 and 1.23 for CUR,as well as 3.25 and 2.63 for total curcuminoid of turmeric obtainedfrom Sleman and Sukoharjo, respectively. FTIR spectroscopycombined with PLS calibration model offered alternative methodover HPLC due to its simplicity and its capability to providesimultaneous analysis of curcuminoid without a separation step.Fig. 4: PLS calibration model for the relationship between actual values of curcumin, demethoxycurcumin, bisdemethoxycurcumin and total curcuminoid with FTIRpredicted/calculated values using specific wavenumbers.CONCLUSIONFTIR spectroscopy combined with PLS calibrationmodel is an alternative technique for HPLC due to the capabilityof FTIR spectroscopy-PLS to offer the close relationship betweenactual values as determined by HPLC and FTIR predicted valueswith low errors. CUR was determined at wavenumbers of theregion of 1400-1720 cm 1, while total curcuminoid was analyzedat 1407-1820 cm 1. The R2 value for the correlation between actualvalues of a curcuminoid and FTIR-PLS was 0.98 indicating theaccuracy of the method with low errors. FTIR spectroscopy is fast,not destructive and no excessive sample preparation.CONFLICT OF INTERESTThe authors declared no conflict of interest.ACKNOWLEDGMENTThe author thanks the Ministry of Research and HigherEducation for financial support during this research via schemePenelitian Unggulan Perguruan Tinggi 2016 with contract rwal BB, Kumar A, Bharti AC. Anticancer potential ofcurcumin: Preclinical and clinical studies. Anticancer Res, 2003; 23:363398.Anubala S, Sekar R, Nagaiah K. Development and validationof an analytical method for the separation and determination of majorbioactive curcuminoids in Curcuma longa rhizomes and herbal productsusing non-aqueous capillary electrophoresis. Talanta, 2014; 123:10-17.Asai A, Miyazawa T. Occurrence of orally administeredcurcuminoid as glucuronide and glucuronide/sulfate conjugates in ratplasma. Life Sci, 2000; 67:2785-2793.Bunaciu AA, Aboul-Enein HY, Fleschin S. Recent Applicationsof Fourier Transform Infrared Spectrophotometry in Herbal MedicineAnalysis. Appl Spectros Rev, 2011; 46:251-260.Cheng J, Weijun K, Yun L, Jiabo W, Haitao W, Qingmiao L,Xiaohe X. Development and validation of UPLC method for qualitycontrol of Curcuma longa Linn.: Fast simultaneous quantitation of threecurcuminoids. J Pharm Biomed Anal, 2010; 53:43-49.De R, Kundu P, Swarnakar S, Ramamurthy T, Chowdhury A,Nair GB, Mukhopadhyay AK. Antimicrobial Activity of Curcumin againstHelicobacter pylori Isolates from India and during Infections in Mice.Antimicrob Agents Chemother, 2009; 53:1592-1597.Gad HA, El-Ahmady SH, Abou-Shoer MI, Al-Azizi MM.Application of chemometrics in authentication of herbal medicines: Areview. Phytochem Anal, 2013; 24:1-24.González AG, Herrador MÁ. A practical guide to analyticalmethod validation, including measurement uncertainty and accuracyprofiles. TrAC Trends Anal Chem, 2007; 26:227-238.Gupta AP, Gupta MM, Kumar S. Simultaneous Determinationof Curcuminoids in Curcuma Samples Using High Performance Thin LayerChromatography. J Liq Chromatogr Related Technol, 1999; 22:1561-1569.Inoue K, Nomura C, Ito S, Nagatsu A, Hino T, Oka H.
Wulandari et al. / Journal of Applied Pharmaceutical Science 8 (09); 2018: 107-113Purification of curcumin, demethoxycurcumin, and bisdemethoxycurcuminby high-speed countercurrent chromatography. J Agric Food Chem, 2008;56:9328-9336.International Conference on Harmonisation. Validation ofAnalytical Procedures: Text and Methodology. 2005; Retrieved from yaA,KumarnsitE,WattanapiromsakulC,Vongvatcharanond U. Histological studies of neuroprotective effects ofCurcuma longa Linn. on neuronal loss induced by dexamethasone treatmentin the rat hippocampus. Acta Histochemica, 2014; 116:1443-1453.Jiang H, Somogyi A, Jacobsen NE, Timmermann BN, Gang DR.Analysis of curcuminoids by positive and negative electrospray ionizationand tandem mass spectrometry. Rapid Comm Mass Spectrom, 2006;20:1001-1012.Lestari HP, Martono S, Sudjadi, Rohman A. Simultaneousanalysis of Curcumin and demethoxycurcumin in Curcuma xanthorrizausing FTIR spectroscopy and chemometrics. Int Food Res J, 2017;24(5):2097-2101.Liang YZ, Xie P, Chan K. Quality control of herbal medicines. JChromatogr B, 2004; 812:53-70.Miller JN, Miller JC. 2005. Statistics and Chemometrics forAnalytical Chemistry. 5th Ed. Edinburgh: Pearson Education Limited.Dandekar PP, Patravale VB. Development and Validation of aStability-Indicating LC Method for Curcumin. Chromatographia, 2009;69:871-877.Paulucci VP, Couto RE, Teixeira CCC, Freitas LAP. Optimizationof the extraction of curcumin from Curcuma longa rhizomes. Brazilian JPharmacog, 2013; 23:94-100.Péret-Almeida L, Cherubino APF, Alves RJ, Dufossé L, GlóriaMBA. Separation and determination of the physico-chemical characteristicsof curcumin, demethoxycurcumin and bisdemethoxycurcumin. Food ResInt, 2005; 38:1039-1044.Prabaningdyah NK, Riyanto S, Rohman A, Siregar C.Application of HPLC and response surface methodology for simultaneousdetermination of curcumin and desmethoxy curcumin in Curcuma syrupformulation. J App Pharm Sci, 2017; 7:58-64.Prabaningdyah NK, Riyanto S, Rohman A. Application of FTIRspectroscopy and multivariate calibration for analysis of curcuminoid insyrup formulation. J App Pharm Sci, 2018; 8:172-179.Rogers NM, Kireta S, Coates PTH. Curcumin inducesmaturation-arrested dendritic cells that expand regulatory T cells in vitro113and in vivo. Clin Exp Immun, 2010; 162:460-473.Rohaeti E, Rafi M, Syafitri UD, Heryanto R. Fourier transforminfrared spectroscopy combined with chemometrics for discriminationof Curcuma longa, Curcuma xanthorrhiza and Zingiber cassumunar.Spectrochim. Acta Part A: Mol Biomol Spectros, 2015; 137:1244-1249.Rohman A. Application of Fourier Transform InfraredSpectroscopy for Quality Control of Pharmaceutical Products: A Review.Indonesian J Pharm, 2012; 23:1-8.Rohman A, Sudjadi D, Ramadhani D, Nugroho A. Analysisof Curcumin in Curcuma longa and Curcuma xanthorriza Using FTIRSpectroscopy and Chemometrics. Res J Med Plant, 2015; 9:179-186.Singh R, Chandra R, Bose M, Luthra PM. Antibacterial activityof Curcuma longa rhizome extract on pathogenic bacteria. Current Sci,2002; 83:737-740.Syed HK, Liew KB, Loh GOK, Peh KK. Stability indicatingHPLC–UV method for detection of curcumin in Curcuma longa extract andemulsion formulation. Food Chem, 2015; 170:321-326.Tanaka K, Kuba Y, Sasaki T, Hiwatashi F, Komatsu K.Quantitation of curcuminoids in curcuma rhizome by near-infraredspectroscopic analysis. J Agric Food Chem, 2008; 56:8787-8792.The Ministry of Health, Republic of Indonesia. 2008. IndonesianHerbal Pharmacopeia. 1st Ed. Jakarta: Kemenkes.Wichitnithad W, Jongaroonngamsang N, Pummangura S,Rojsitthisak P. A simple isocratic HPLC method for the simultaneousdetermination of curcuminoids in commercial turmeric extracts. PhytochemAnal, 200
Fourier transform infrared (FTIR) spectroscopy is promising techniques for the quantification of curcuminoid due to its capability to provide fast and green analytical technique, with minimum sample preparation step ( Bunaciu et al., 2011; Rohman, 2012). Combined with mul