Transcription
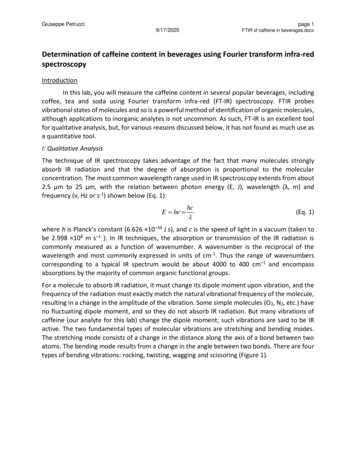
Journal of Applied Pharmaceutical Science Vol. 8(08), pp 151-156, August, 2018Available online at http://www.japsonline.comDOI: 10.7324/JAPS.2018.8821ISSN 2231-3354Application of Fourier transform infrared (FTIR) spectroscopycoupled with multivariate calibration for quantitative analysis ofcurcuminoid in tablet dosage formChairany Siregar1,2, Sudibyo Martono1, Abdul Rohman1*12Department of Pharmaceutical Chemistry, Faculty of Pharmacy, Gadjah Mada University, Yogyakarta, 55281, Indonesia.The National Agency of Drug and Food Control, District of Samarinda, East Kalimantan, Indonesia.ARTICLE INFOABSTRACTArticle history:Received on: 25/03/2018Accepted on: 19/06/2018Available online: 31/08/2018Curcuminoid, especially curcumin (CUR) and desmethoxycurcumin (DMCUR), is regarded as active componentsof a pharmaceutical formulation containing Curcuma species responsible for several biological activities includinganti-inflammatory and antioxidant. The objective of this research was to validate rapid and reliable method basedon Fourier transform infrared (FTIR spectroscopy) in the mid-infrared region in combination with multivariateanalysis for quantitative analysis of curcuminoid content in tablet formulation. FTIR spectra was subjected to severaloptimizations including wavenumbers selection and derivatization to get best prediction models for the relationshipbetween actual values of curcuminoid as determined using high-performance liquid chromatography and FTIRcalculated values. The first derivative FTIR spectra at wavenumbers of 2975-660 cm 1 using partial least squareregression (PLSR) was preferred for quantification of CUR in tablet, while DMCUR was predicted using FTIR normalspectra at wavenumbers of 1784-1587 cm 1. The coefficient of determination (R2) values for calibration and validationmodels either in CUR and DMCUR were of 0.99 indicating good accuracy methods. The errors in calibrationand validation models were low indicating the acceptable precision of the developed method. FTIR spectroscopycombined with PLS regression can be used as an alternative technique for determination of CUR and DMCUR intablet dosage form.Key words:curcumin,demethoxycurcumin, PLSregression, tablet, (CUR)anddesmethoxycurcumin (DMCUR), with chemical structures asshown in Figure 1, has been reported to have some biologicalactivities including antioxidant, anticancer and anti-inflammatory(Rohman, 2012). Curcuminoid has been used as chemical markersduring biological activity studies related to Curcuma genus.Some pharmaceutical products containing Curcuma extractshas been commercially available in Indonesian markets such asCurcuma syrup (Wahyono and Hakim, 2007), capsule, and tabletformulations (Rajashree et al., 2013). Therefore, determinationCorresponding AuthorAbdul Rohman, Department of Pharmaceutical Chemistry, Faculty ofPharmacy, Gadjah Mada University, Yogyakarta, 55281, Indonesia.E-mail: abdul kimfar @ ugm.ac.id*of curcuminoid in those formulations was needed to assure thequality of curcuminoid contained in pharmaceutical products.Chromatographic methods including chromatographywith ultraviolet-visible detector (Syed et al., 2015), photo-diodearray detector (Zhang and Acworth, 2013), and electrochemicaldetector (Long et al., 2014) has been reported for analysis ofcurcuminoid due to its capability to provide separation of individualcurcuminoid (Siregar et al., 2017). However, chromatographicmethods need more time and efforts, therefore, some simplemethods based on spectroscopic methods have been introducedto overcome these obstacles. UV spectrophotometry is a methodof choice for determination of curcuminoid in a formulationcontaining pure curcuminoid (Sharma et al., 2012), but thismethod is not suitable for products containing curcuminoid inplant extracts. Due to much peaks obtained to be used as variables,Fourier transforms infrared (FTIR) spectroscopy has been 2018 Chairany Siregar et al. This is an open access article distributed under the terms of the Creative Commons Attribution License -NonCommercial-ShareAlikeUnported License ).
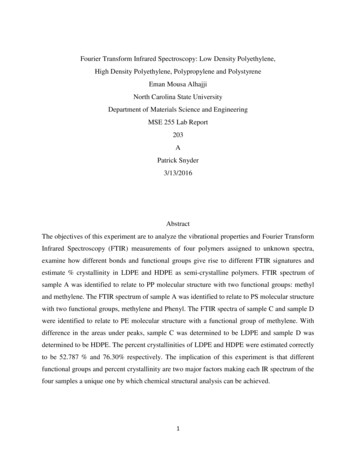
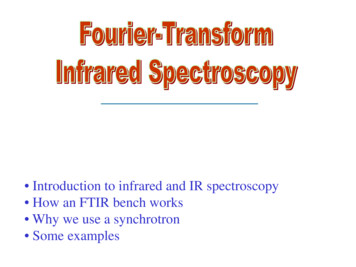
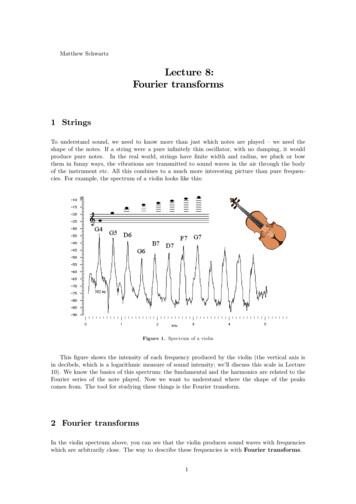
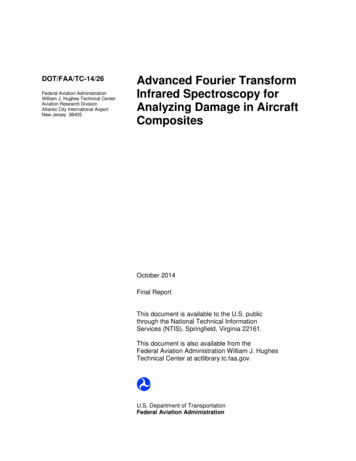
152Siregar et al. / Journal of Applied Pharmaceutical Science 8 (08); 2018: 151-156proposed for the analysis of analytes in a complex compositionincluding curcuminoid in the extracts.Fig. 1: The chemical structures of curcumin and demethoxycurcumin.FTIR spectroscopy, based on the interaction betweenelectromagnetic radiation currently in infrared region andsamples, in combination with several chemometrics techniques,has emerged as powerful analytical tools in the pharmaceuticalapplication (Chakraborty, 2016) due to its property as fingerprintspectra (Sim et al., 2004). In herbal medicine application, thecombination of FTIR spectroscopy and chemometrics have beenused for quantification of active pharmaceutical ingredients(Rohman, 2013), for discrimination between wild-grown andcultivated Ganoderma lucidum, an expensive herbal componentcommonly used in Chinese traditional medicine (Zhu and Tan,2015), authentication of geographical origin of Gentiana rigescenscommonly used as liver protective in traditional Chinese medicine(Wu et al., 2017) and for quality assurance of herbal medicine(Rohman et al., 2014). FTIR spectroscopy combined with partialleast square and principal component regression has been usedfor quantification of curcuminoid in extracts of Curcuma longa(Rohman et al., 2015) and Curcuma xanthorrhiza (Lestari et al.,2017). The reported publication regarding curcuminoid analysis,so far, was in extracts or powder and using literature review, thereare no reports related to the quantitative analysis of curcuminoidin tablet formulation. Therefore, in this study, FTIR spectroscopyat specific infrared region combined with multivariate calibrationwas optimized for quantitative analysis of curcuminoid (CUR andDMCUR).MATERIALS AND METHODSCurcumin (CUR) and desmethoxycurcumin (DMCUR)were isolated from commercial curcuminoid purchased fromE. Merck (Darmstadt, Germany). Isolation was performedfollowing method as described in Lestari et al. (2017). ThinLayer Chromatography (TLC) and High-Performance LiquidChromatography (HPLC) were used to check the purity ofCUR and DMCUR. The purity of CUR and DMCUR wasperformed using internal normalization technique. Tablet sampleswere purchased from several pharmacies around Yogyakarta,Indonesia. The placebo of samples was kindly given by PT. SOHOPharmaceutical Industry (Jakarta, Indonesia).HPLC analysisHPLC analysis of individual curcuminoid was performedaccording to Siregar et al. (2017) using Shimadzu LC-20AD(Kyoto, Japan) equipped with Rheodyne 7725i injection valvewith a 20 μL loop volume and binary gradient pump. Detectionwas carried out Shimadzu Photodiode Array Detector (SPDM20A) operated at a wavelength of 425 nm. Chromatographicseparation was performed using Waters X-Bridge C-18 (250 mm 4.6 mm i.d; 5 µm), set at 45 C. The mobile phase used consistedof a binary mixture of acetonitrile-acetic acid 3.00% (49:51 v/v),delivered in an isocratic manner with flow rate arranged at 1.08mL/min. For the preparation of a stock solution of samples, anaccurately weighed amount of samples (about 200.0 mg) wastransferred into a 25 mL volumetric flask, added with about 10mL methanol, sonicated for 30 min, and then diluted with mobilephase to volume. The samples were homogenized and centrifugedfor 10 min at 10.000 rpm. A portion of sample stock solution wasdiluted (1 in 20 mL for CUR and 2.5 in 5 mL for DMCUR) withmobile phase, mixed, and then filtered using 0.45 µm filter beforebeing injected into HPLC system.Fig. 2: HPLC chromatogram obtained during analysis of desmethoxycurcumin (tR of 6.28) and curcumin (tR of 6.96). For HPLC condition, see section of HPLCanalysis.Preparation of calibration and validation samplesIn order to facilitate the calibration model, a tabletcontaining CUR and DMCUR was added with placebo withvariety composition to get a different concentration of CURand DMCUR. Multivariate calibrations of partial least squareregression (PLSR) and principal component regression (PCR)were used for making calibration model. For validation samples,a set of independent samples prepared by adding a tablet with
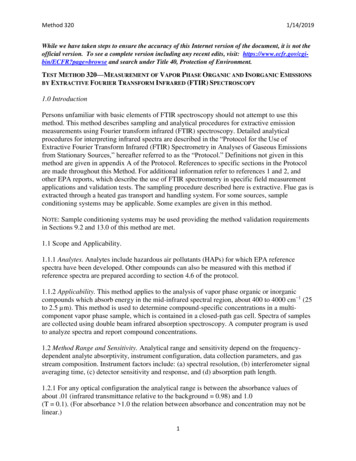
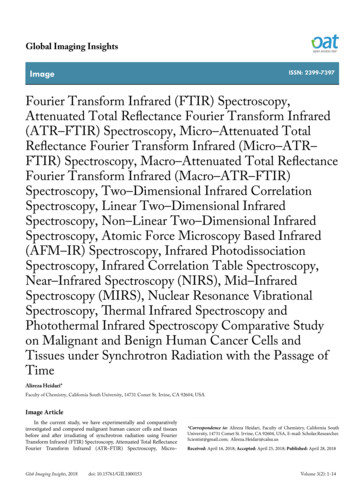
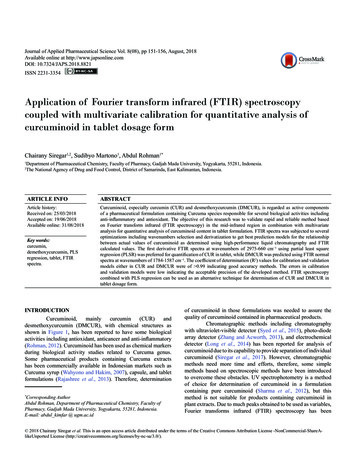
Siregar et al. / Journal of Applied Pharmaceutical Science 8 (08); 2018: 151-156different composition of placebo was used. The concentration ofCUR and DMCUR in validation samples was predicted using thecalibration model previously built.FTIR spectroscopy analysisThe powdered tablet samples were placed on SmartiTR Attenuated Total Reflectance (ATR) accessory composedof diamond crystal as sample handling technique at a controlledambient temperature (25 C). Samples were scanned usingNicolet iS10 FTIR spectrophotometer (Thermo Fisher ScientificInc, Madison, USA) equipped with deuterated triglycine sulfate(DTGS) detector and potassium bromide (KBr)/Germanium as abeam splitter. The instrument was connected to software OMNICver.9.7 and spectra were scanned at wavenumbers of 4000-650cm 1, recorded for 32 scans at a resolution of 8 cm 1. The airspectrum was used as background. Each data point was recordedin three replicates using absorbance mode to facilitate quantitativeanalysis (Rohman et al., 2014).Chemometric analysisMultivariate analyses consisted of partial least squareregression (PLSR) and principal component regression (PCR)were performed using software TQ Analyst ver.9.7 (ThermoFisher Scientific Inc., Madison, WI) included in Nicolet iS10FTIR instrument. PLSR and PCR were used to build a predictivemodel which correlated the actual values of CUR and DMCURfrom HPLC determination and FTIR predicted values. Statisticalparameters namely coefficient determination (R2), Root MeanSquare Error of Calibration (RMSEC) and Root Mean SquareError of Predicted (RMSEP) were computed using TQ Analystsoftware.RESULTS AND DISCUSSIONHPLC, due to its capability to be used for qualitative,quantitative and preparative analyses, is a standard methodfor analysis of active components in herbal medicine includingdetermination of curcumin (CUR) and desmethoxycurcumin(DMCUR) in plant extracts (Prabaningdyah et al., 2017). Figure2 revealed HPLC chromatogram for separation and quantificationof CUR and DMCUR in some tablet samples containing C.xanthorrhiza in its formulation. However, HPLC is timeconsuming and needs skillful analysis. Therefore, in this study,FTIR spectroscopy was developed for routine analysis of CURand DMCUR in any pharmaceutical products. The levels of CURand DMCUR in tablet formulation used as actual values of CURand DMCUR were determined by HPLC using photo-diode arraydetector at λ 425 nm, and their results obtained were compiledin Table 1. The variation of CUR and DMCUR compositions inevaluated tablets was coming from the addition of tablets withplacebo to facilitate calibration models during FTIR spectroscopicanalysis.FTIR spectra of a tablet containing extract of C.xanthorrhiza with curcuminoid as active components weredepicted in Figure 3. Each peak was corresponding to a functionalgroup present in two main curcuminoids present in C. xanthorrhiza,namely CUR and DMCUR (Lestari et al., 2017). The clear andbroad peak at wavenumbers (1/λ) of 3200 cm 1 correspondedto stretching vibration of hydrogen-bonded (-OH) present in153curcuminoid, while peaks at 2950 and 2900 cm 1 originatedfrom stretching vibrations of methyl (CH3) and methylene (CH2-)groups, respectively. The bending vibrations of CH3 and CH2 werealso observed at 1/λ 1339 and 1423 cm 1, respectively. Conjugatedcarbonyl group was observed at 1/λ 1655 cm 1, lower than 1/λin unconjugated carbonyl (Prabaningdyah et al., 2018). Table 2compiled the functional groups responsible for IR absorption oftablet placebo spiked with Curcuma xanthorrhiza. The presenceof these functional groups as indicated in each peak in FTIRspectra proved that the studied tablet contained Curcuma extract.Table 1: The concentrations of curcumin and desmethoxycurcumin in tabletsamples.SamplesCurcumin (mg/g)Demethoxycurcumin (mg/g)Sample 10.58210.0015Sample 20.84670.0021Sample 31.08610.0026Sample 41.22790.0030Sample 51.69710.0040Sample 62.16080.0048Sample 72.58080.0060Sample 83.04330.0077Sample 93.46980.0075Sample 104.31220.0118Sample 115.13550.0134Sample 126.05530.0156Sample 136.92670.0172Sample 147.93190.0230Sample 158.67700.0247Table 2: The functional groups responsible for IR absorption of tablet placebospiked with Curcuma xanthorrhiza (Lestari et al., 2017).Wavenumbers (1/λ)(cm 1)Functional groups along with mode of vibration3260Stretching vibration of hydrogen-bonded (-OH)2950 and 2900Stretching vibrations of methyl (CH3) and methylene(CH2-) groups1655Stretching vibration of conjugated carbonyl (C O) group1423CH2- bending1339CH3- bending1259C-O stretching1201C-O stretching1140C-O stretching1114C-O stretching1017C-OH stretching988-HC CH-(trans) out of plane899-HC CH-(cis) out of plane757-(CH2)n; -HC CH- bendingFor prediction of CUR and DMCUR, FTIR spectroscopyat specific wavenumbers was optimized by selecting certainregions of mid-infrared (4000-650 cm 1) capable of providing thebest correlation between actual values of CUR and DMCUR asdetermined by HPLC and FTIR predicted values. The selectionof wavenumbers regions used for prediction of CUR and
Siregar et al. / Journal of Applied Pharmaceutical Science 8 (08); 2018: 151-156154DMCUR using FTIR spectroscopy was relied on its capabilityto offer the highest coefficient of determination (R2) and lowestcalibration and validation errors. To facilitate this correlation, twomultivariate calibrations namely partial least square regression(PLSR) and principal component regression (PCR) were usedand optimized. Table 3 compiled the performance of multivariatecalibrations for prediction of CUR and DMCUR in Curcuma tabletalong with statistical values, namely R2 and root mean squareerror of calibration (RMSEC) and error in prediction (RMSEP).The accuracy and precision of FTIR spectroscopic-multivariatecalibration can be expressed by R2, RMSEC, and RMSEP. Thehigher R2 and the lower RMSEC and RMSEP, the better theprediction models (Sim et al., 2004).Fig. 3: FTIR spectra of tablet placebo spiked with Curcuma xanthorrhiza containing curcumin and desmethoxycurcumin at wavenumbers of 4000-650 cm 1.Table 3: The performance of multivariate calibration of partial least square regression (PLSR) and principle component regression (PCR) for prediction of curcuminand demethoxycurcumin in tablet er(cm 1)SpectraltreatmentCurcuminNumber ofFactorR2 calib.RMSECDemethoxycurcuminR2 val.RMSEPNumber 784-15871st 51st 009411712-653 0005850.99640.001031712-653 and3397-28731st 0.0004010.99880.0009262975-6601st 570.0009850.98410.001522183-9931st 99140.0005890.99380.0006581784-15871st .0006401712-653 0.0008210.99600.001171712-653 and3397-28731st .0008690.99780.001122975-66021st .00156
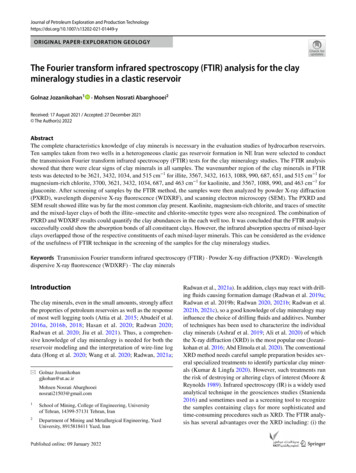
Siregar et al. / Journal of Applied Pharmaceutical Science 8 (08); 2018: 151-156155(A)(B)Fig. 4: The correlation between actual values of curcumin and FTIR predicted values using FTIR spectroscopy-partial least square regression (A) along with residualanalysis (B).(A)(B)Fig. 5: The correlation between actual values of desmethoxycurcumin and FTIR predicted values using FTIR spectroscopy-partial least square regression (A) alongwith residual analysis (B).
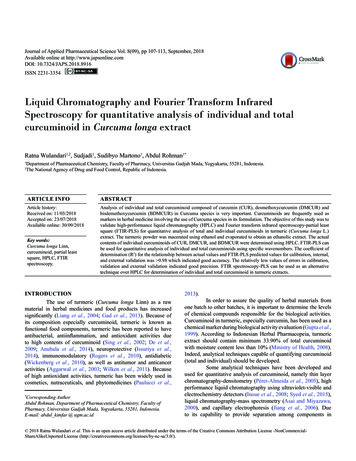
156Siregar et al. / Journal of Applied Pharmaceutical Science 8 (08); 2018: 151-156Based on the optimization using several parameters(types of multivariate calibration, wavenumbers region, spectraltreatment based on normal and its first derivative), CUR waspreferred to be quantified using first derivative spectra at combinedwavenumbers of 2975-660 cm 1 with 7 factors. The R2 obtainedfor calibration and validation models for quantitative analysisof CUR using PLSR were 0.9968 and 0.9964, with RMSEC andRMSEP values of 0.126% and 0.254%, respectively. Furthermore,PLSR using wavenumbers of 1784-1587 cm 1 with 5 factors waspreferred for quantification of DMCUR in a tablet with R2 valuesin calibration and validation of 0.9954 and 0.9916, respectively.The RMSEC and RMSEP values obtained were of 0.000427% and0.000754%.Figure 4 and Figure 5 revealed the correlation betweenactual values of CUR and DMCUR with FTIR predicted valuesusing optimized condition assisted with PLSR along with residualanalysis to evaluate the difference between actual and predictedvalues. From the residual analysis, it can be confirmed thatresidual values fall around zero (0) difference, above and belowzero value. This indicated that errors occurred can be negligible.From these results, it can be concluded that FTIR spectroscopyusing optimum condition can be used for prediction of CUR andDMCUR with acceptable accuracy as indicated by the high valueof R2 and precision as indicated by low levels of RMSEC, RMSEPand residual values. FTIR spectroscopy in combination withchemometrics of multivariate calibration offered a fast and reliabletechnique for quantitative analysis of pharmaceuticals with fixedcomposition, however, if the placebo or matrix composition usedwas different, a new model calibration and validation must bedeveloped.CONCLUSIONFTIR spectroscopy in combination with multivariateanalysis can be used as an alternative technique for quantitativeanalysis of CUR and DMCUR in table dosage form. The accuracyand precision of FTIR spectroscopy assisted with PLSR wereacceptable. This developed method was rapid and suitable forroutine analysis. However, if the composition of tablet used wasdifferent, a new model must be developed, and indeed the modelwas also validated.ACKNOWLEDGMENTThe authors acknowledge to Kemenristek Dikti (theMinistry of research and higher education, Republic of Indonesia)for financial support during this study with contract number of2328/UN1.P.III/DIT-LIT/LT/2017 awarded to Prof. Dr. AbdulRohman. The National Agency of Drug and Food Control, Districtof Yogyakarta, Republic of Indonesia was acknowledged forsupporting HPLC facilities that make this study possible. We alsothanks PT. SOHO Pharmaceutical Industry (Jakarta, Indonesia)for supporting sample placebo.CONFLICTS OF INTERESTThere are no conflicts of interest.REFERENCESChakraborty DS. Instrumentation of FTIR and its herbalapplications. World J Pharm Pharmaceutical Sci, 2016; 5(3):498-505.Lestari HP, Martono S, Wulandari R, Rohman A. Simultaneousanalysis of Curcumin and demethoxycurcumin in Curcuma xanthorrhizausing FTIR spectroscopy and chemometrics. Int Food Res J, 2017;24(5):2097-2101.Long Y, Zhang W, Wang F, Chen Z. Simultaneous determinationof three curcuminoids in Curcuma longa L. by high performance liquidchromatography coupled with electrochemical detection. J Pharm Anal,2014; 4(5):325-330.Prabaningdyah NK, Riyanto S, Rohman A, Siregar C.Application of HPLC and response surface methodology for simultaneousdetermination of curcumin and desmethoxy curcumin in Curcuma syrupformulation. J Appl Pharm Sci, 2017; 7(12):58-64.Prabaningdyah NK, Riyanto S, Rohman A. Application of FTIRspectroscopy and multivariate calibration for analysis of curcuminoid insyrup formulation. J Appl Pharm Sci, 2018; In Press.Rajashree R, Divya G, Sushma P, Kanchan I, Sachin K.Analytical Study of Curcumin Content in Different Dosage FormsContaining Turmeric Extract Powder and Turmeric Oleoresin Int Res JPharm, 2013; 4(3):182-185.Rohman A. Analysis of curcuminoids in food and pharmaceuticalproducts. Int Food Res J, 2012; 19(1):19-27.Rohman A. Application of Fourier Transform InfraredSpectroscopy for Quality Control of Pharmaceutical Products: a Review.Indones J Pharm, 2013; 23(1):1-8.Rohman A, Nugroho A, Lukitaningsih E, Sudjadi. Application ofvibrational spectroscopy in combination with chemometrics techniques forauthentication of herbal medicine. Appl Spectrosc Rev, 2014; 49(8):603-613.Rohman A, Sudjadi, Ramadhani D, Nugroho A. Analysis ofCurcumin in Curcuma longa and Curcuma xanthorrhiza Using FTIRSpectroscopy and Chemometrics. Res J Med Plant, 2015; 9(4):179-186.Sharma K, Agrawal SS, Gupta M. Development and validationof UV spectrophotometric method for the estimation of curcumin in bulkdrug and pharmaceutical dosage forms. Int J Drug Dev Res, 2012; 4(2):375380.Silverstein RM, Webster FX, Kiemle DJ. 2005. Spectrometricidentification of organic compounds. Hoboken, NJ: John Wiley & Sons.Sim C, Hamdan M, Ismail Z, Ahmad M. Assessment of HerbalMedicines by Chemometrics – Assisted Interpretation of FTIR Spectra.Anal Chim Acta, 2004; 570:1-14.Syed HK, Bin Liew K, Loh GOK, Peh KK. Stability indicatingHPLC-UV method for detection of curcumin in Curcuma longa extract andemulsion formulation. Food Chem, 2015; 170:321-326.Siregar C, Prabaningdyah NK, Choiri S, Riyanto S, Rohman A.Optimization of HPLC Using Central Composite Design for Determinationof Curcumin and Demethoxycurcumin in Tablet Dosage Form. Dhaka UnivJ Pharm Sci, 2017; 16(2):137-145.Wahyono D, Hakim AR. Effect of the curcuma plus syrupon the pharmacokinetics of rifampicin in rats. Indonesian J Pharm, 2007;18(4):163-168.Wu Z, Zhao Y, Zhang J, Wang Y. Quality Assessment of Gentianarigescens from Different Geographical Origins Using FT-IR SpectroscopyCombined with HPLC. Molecules, 2017; 22:1238.Zhang Q, Acworth I. The quantitative analysis of curcuminoids ina food additive and foods evaluated using rapid HPLC with electrochemical,UV or fluorescence detection. Planta Med, 2013; 79:PO1.Zhu Y, Tan ATL. Discrimination of Wild-Grown and CultivatedGanoderma lucidum by Fourier Transform Infrared Spectroscopy andChemometric Methods. Am J Anal Chem, 2015; 6(5):480-491.How to cite this article:Siregar C, Martono S, Rohman A. Application of Fouriertransform infrared (FTIR) spectroscopy coupled withmultivariate calibration for quantitative analysis of curcuminoidin tablet dosage form. J App Pharm Sci, 2018; 8(08): 151-156.
Application of Fourier transform infrared (FTIR) spectroscopy coupled with multivariate calibration for quantitative analysis of curcuminoid in tablet dosage form Chairany Siregar1,2, Sudibyo Martono1, Abdul Rohman 1* 1Department of Pharmaceutical Chemistry, Faculty of Pharma