Transcription
Fourier Transform Infrared Spectroscopy: Low Density Polyethylene,High Density Polyethylene, Polypropylene and PolystyreneEman Mousa AlhajjiNorth Carolina State UniversityDepartment of Materials Science and EngineeringMSE 255 Lab Report203APatrick Snyder3/13/2016AbstractThe objectives of this experiment are to analyze the vibrational properties and Fourier TransformInfrared Spectroscopy (FTIR) measurements of four polymers assigned to unknown spectra,examine how different bonds and functional groups give rise to different FTIR signatures andestimate % crystallinity in LDPE and HDPE as semi-crystalline polymers. FTIR spectrum ofsample A was identified to relate to PP molecular structure with two functional groups: methyland methylene. The FTIR spectrum of sample A was identified to relate to PS molecular structurewith two functional groups, methylene and Phenyl. The FTIR spectra of sample C and sample Dwere identified to relate to PE molecular structure with a functional group of methylene. Withdifference in the areas under peaks, sample C was determined to be LDPE and sample D wasdetermined to be HDPE. The percent crystallinities of LDPE and HDPE were estimated correctlyto be 52.787 % and 76.30% respectively. The implication of this experiment is that differentfunctional groups and percent crystallinity are two major factors making each IR spectrum of thefour samples a unique one by which chemical structural analysis can be achieved.1
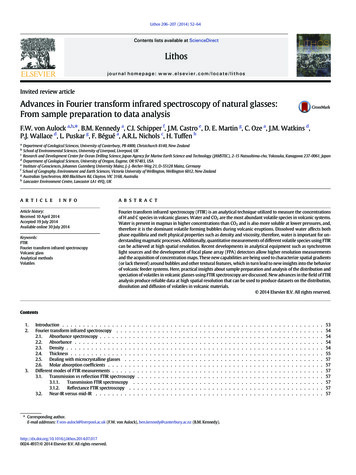
IntroductionFourier transform infrared spectroscopy (FTIR) is a method used to obtain an infraredspectrum of absorption or emission of a solid, liquid or gas. An FTIR spectrometer simultaneouslycollects high spectral resolution data over a wide spectral range. 1 Figure 1 shows the typicalarrangement of FTIR. The five main components of FTIR are radiation source, interferometer,sample, detector and mono IR beam.Figure 1. The typical arrangements of FTIR. 1The radiation source used in FTIR is polychromatic Xe lamp. An interferometer consistsminimally of two mirrors and a beam splitter. It works by first dividing the beam coming from thelamp, which gives rise an optical path difference, then recombining them at a beamsplitter afterbeing reflected off stationary and moving mirrors. The detector measures interference signal as afunction of optical path difference. The beams undergo constructive interference and can beconsidered in phase with a maximum detector response if the split beams have a difference of λ.The beams undergo destructive interference and 180o out of phase if the optical paths differ by λ/2.2
The amplitude of the wave is reduced by an amount proportional to sample in beam. Finally, thedetected intensity as a function of moving mirror position converted to the final IR spectrum, A orT vs ν (cm-1), by a Fourier transform. 2The principles of this technique rely on absorption or emission of the sample at a particularfrequency in relation to its vibrational motion of molecules. Molecular vibration, the coupledmotion of atoms within molecules, has the following modes: stretching, bending and rocking, eachof which corresponds to an energy level. IR spectra contains peaks at frequencies where it representtransitions between quantized vibrational energy states, which corresponds to a particularfunctional group. Energy difference for transitions between the ground state and first excited stateof most vibrational modes occurs in the mid-IR range, which is between 4000-400 wavenumber(cm-1). IR spectra is used in both chemical and structural analyses. A substance can be chemicallyidentified by matching observed IR spectrum with known database. Also, structures can bedetermined as functional groups give rise to characteristic bands. FTIR is faster, more reliable andmore powerful comparing to a classic dispersive IR spectrometer. In FTIR spectrometer, moreenergy reaches the sample and a wavelength range of IR does not have to be continuous whenscanned.The objective of this experiment is to analyze the vibrational properties of four polymersby measuring and observing the FTIR spectra Using Varian 640-IR, FT-IR Spectrometer. Inaddition, different bonds in relation to their functional groups giving rise to different FTIRsignatures are examined. Finally, % crystallinity in semi-crystalline polymers are calculated. Thespecimens being examined are low density polyethylene, high density polyethylene,polypropylene and polystyrene.3
Experimental ProcedureThe instrument used in this experiment was Varian 640-IR, FT-IR Spectrometer. Thespecimensbeingexaminedwerelowdensity polyethylene(LDPE),highdensitypolyethylene(HDPE), polypropylene(PP) and polystyrene (PS). LDPE sample was taken from amilk container, HDPE sample was taken from 6 pack ring holder, PP sample was taken from CDcase and PS sample was taken from coil installation. The hardware components were a Duraglowmid-IR source, KBr beamsplitter, and a Peltier-cooled DLaTGS detector; a HeNe laser, which wasused for calibrating distance of the moving mirror. The software used with the FTIR spectrometerwas Resolutions Pro. The experiment was operated at room temperature and an absolute pressureof 1 atm.The method used was attenuated total reflection (ATR) attachment. An ATR attachmentoperates by measuring the changes that occur in a totally internally reflected infrared beam whenthe beam comes into contact with a sample. This internal reflectance creates an evanescent wavethat extends beyond the surface of the crystal into the sample held in contact with the crystal. ATRis beneficial in the way it increases the signal ratio by contacting the sample at multiple points.The crystal material used for ATR was Zinc Selenide (ZnSe), known for its high reflective index.ZnSe scratched easily and care was taken when cleaning the crystal. The crystal was cleaned byusing a lens paper and alcohol. The parameters were as following: 32 scans arrange with eachother, 8 sensitivity, 4000-600 range of waves, and a resolution of 4 cm-1. Cautions were taken intoconsideration. Hand gloves were used in order to avoid oil contamination from fingers. Dry airwas used to avoid lens exposure to air which could change the microstructure of the lenses andIPA was used to clean ZnSe.4
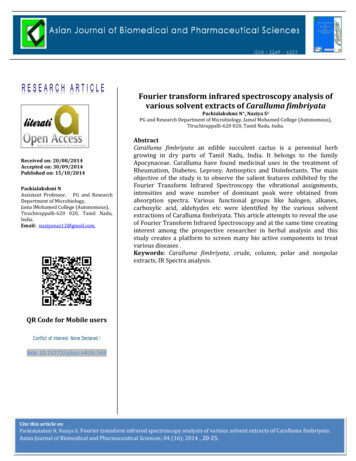
Each sample one at a time was mounted, and pressed down right on the crystal. Then theFTIR spectrometer was turned on and the measurement was collected. As with all FT-IRmeasurements, an infrared background was collected as shown in Figure 2, from the clean ATRcrystal to avoid positions of disturbing bands.FTIR Spectrum of the Background1.2Absorbance12000- 1280 cm-1disurbed by ber (cm-1)Figure 2. The FTIR spectrum of the background.The repeat units, as shown in Figure 3, for the polymers being examined were used in orderto relate the FTIR signatures to the polymer structures. The % crystallinities of the LDPE andHDPE samples were calculated using (1- Equation 1) 100.(a)(b)(c)Figure 3. Repeat units for (a) polyethylene, (b) polypropylene, and (c) polystyrene. 15
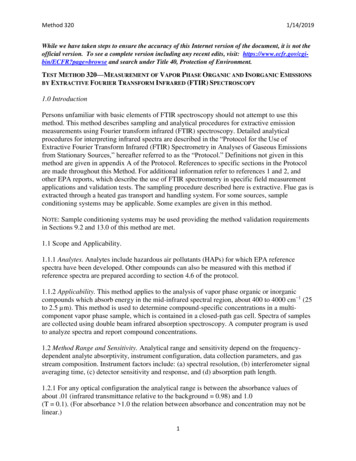
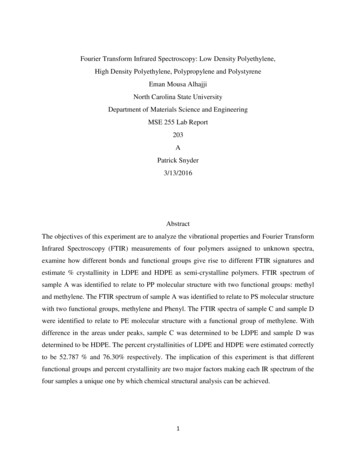
(1)where x is the amorphous content, the value 1.233 is the intensity ratio of the two bands in aspectrum of a 100% crystalline PE sample, Ia is the intensity of crystallinity methylene rockingpeak and Ib is the intensity of amorphous methylene rocking peak.ResultsThe FTIR spectra were calculated and given without the samples’ names. Sample A indicates 10major peaks, as labeled in Figure 3. It represents two active functional groups: methylene andmethyl. Table 1 shows the frequencies with its corresponding vibrational modes and functionalgroups. Sample A shows peak splitting.FTIR Spectrum Sample 631100160021002600Wavenumber(cm-1)Figure 4: Sample A IR Spectrum.631003600
Sample B indicates 12 major peaks, as labeled in Figure 3. It represents two active functionalgroups: groups: methylene and Table 2 shows the frequencies with its corresponding vibrationalmodes and functional groups. Sample B shows no or few peak splitting.Table 1: Peaks corresponding to vibrational moods and functional groups of sample A.PeakNumberFrequency(cm-1)Vibrationalmood almood &FunctionalGroup12345845910115513701445.9Amorphous RockMethylene(C-H2)Crystalline 2)9C-H ngC-H BendingMethylene(C-H2)C-H asym/symStretchingMethylene(C-H2)C-H asym/symStretchingMethyl (-CH3)C-H asym/symStretchingMethyl (-CH3)asym/symStretchingMethyl (C-H)10FTIR Spectrum of Sample 125110016002100260031003600Wavenumber(cm-1)Figure 5: Sample B IR Spectrum.Table 2: Peaks corresponding to vibrational moods and functional groups of sample 25.71357.61448.87
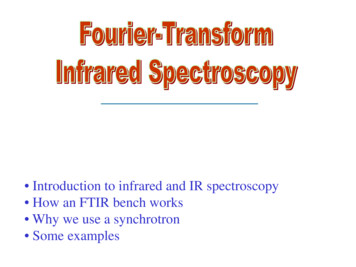
CH2)BendingC-HBendingC-H bondsBendingC-H .92920.13024.93059.9BendingC-H hingC-H bondsMethylene(CH2)StretchingC-H bondsMethylene(CH2)C-H Stretchinginaromatic ring(Phenyl)C-HStretching inaromatic ring(Phenyl)ringC and D Samples have very similar FTIR spectra. They both indicate 6 major peaks, as labeled inFigure 6 and Figure 7. They represent one active functional groups: methylene. Table 3 shows thefrequencies with its corresponding vibrational modes and functional groups. The FTIR spectra ofC and D samples show some peak splitting. The only noticeable difference between the two spectrais that the peaks in the FTIR spectrum of sample C is narrower than those in sample D.FTIR Spectrum of Sample 1002600Wavenumber(cm-1)Figure 6: Sample C IR Spectrum.831003600
FTIR Spectrum of Sample 10016002100260031003600Wavenumber (cm-1)Figure 7: Sample D IR Spectrum.Table 3: Peaks corresponding to vibrational moods and functional groups of sample C and .32915.87Amorphous RockMethylene(C-H2)Crystalline (CH2)StretchingMethylene(CH2)In order to calculate the % crystallinity of LDPE and HDPE, the intensity were firstdetermined by fitting each peak in the 700 cm-1 and taking its area. Using Equation 1, the %crystallinity of LDPE was found to be 52.787 %. The % crystallinity of HDPE was found to be76.30%.DiscussionAfter analyzing The FTIR signatures of the four samples, the unknown samples wereidentified. The FTIR spectrum of Sample A was found to be polypropylene. The peaks in FTIRspectrum of Sample A were found to split as shown in Figure 1, which indicates that this polymermolecule has to be semi-crystalline. 1 Moreover, the cluster of peaks around 2970 cm‐1 down to9
around 2850 cm‐1indecates that sample A has methyl as one functional group and the cluster ofpeaks around 1600 cm‐1 down to around 700 cm‐1indecates that sample A has methylene asanother functional group . Given the functional group, it can be concluded that the structure of thispolymer has to be polyethylene. The peaks in FTIR spectrum of Sample B were found to have onephase as shown in Figure 1, which indicates that this polymer molecule has to be amorphous.Sample B was determined to be polystyrene. Similarly, Sample B has cluster of peaks around 1600cm‐1 down to around 700 cm‐1, which indicates that sample B has methylene as a functionalgroup. The cluster of peaks around 1600 cm‐1 down to around 700 cm‐1indecates that sample Ahas methylene as another functional group. The peaks around 3024 to 3059 cm-1 indicates and thepeak with frequency of 694.1 cm-1 indicates that that this polymer has phenyl as a functionalgroup. Sample C and D exhibit very similar FTIR signatures. The splitting of peaks around 700cm-1 and around 1400 cm-1, as shown in Figure 6 and Figure 7, implies that sample C and sampleD are semi-crystalline polymers. From the FTIR signatures and its corresponding functional groupas shown in Table 3, sample C and sample D were found to be polyethylene polymers. However,the peaks in the FTIR spectrum of sample C were observed to be narrower than those in the FTIRspectrum of sample D, which suggests that sample C has to be LDPE and sample D is HDPE. 3The FTIR signatures of PE, PP and PS have common peaks around 1400 cm-1 thatrepresent methylene as functional group. The difference in structures of PE, PP, and PS, isreplacing one hydrogen atom in PE with a functional group, CH3 in PP and C6H6 in PS. 1 Thesereplacements influence % crystallinity of polymers. Percent crystallinity is also influenced by thedensity of a polymer. 2The percent crystallinities of LDPE and HDPE were estimated on basis of data obtainedfrom their FTIR spectra to be 52.787 % and 76.30% respectively. The estimated % crystallinities10
of HDPE and LDPE agree with the literature. HDPE is the most crystalline of the major categoriesof PE (70-90% crystalline). HDPE typically has molecular weight 35 kg/mol, and containsrelatively few branches, which themselves are of relatively small molecular weight. The increasedcrystallinity also results in increased stiffness and higher density, with density 0.935 - 0.960g/cm3. LDPE is a much higher molecular weight class of PE which contains many branches ofhigh molecular weight. Its ability to crystallize is greatly impeded by the presence of branching,which limits degree of crystallinity to about 40%. LDPE has much better flexibility, impacttoughness, and resistance to environmental stress cracking. The density of LDPE is lower due tothe higher amount of amorphous content, 0.910 - 0.925 g/cm3. 3 From the IR spectra of the twoPP samples, the lower the degree of crystallinity was, the more intensity of peaks were reported.Changes in intensity definitely signifies some changes related to the phase or crystallinity. Goingfrom the FTIR spectra of PE to PP, lower starching frequencies and lower energy peaks werededucted due to the change in functional group. It was also observed in the FTIR spectra of PP andPS with decreasing order of crystallinity that absorption bands shifted to lower frequencies andcaused minimal peaks splitting. Disturbing bands were found to alter the intensity and positionsof some peaks. 1 In sample B, the position of C-H bending was shifted to a higher frequency of1490 cm-1.ConclusionsFTIR spectroscopy is a powerful tool for the determination of molecular structuresbecause functional groups give rise to characteristic bands both in terms of intensity andfrequency. Using Varian 640-IR, FT-IR spectrometer, four polymers were identified and relatedto their FTIR spectra: low density polyethylene, high density polyethylene, polypropylene and11
polystyrene. The vibrational properties of LDPE, HDPE, PP, and PS were calculated. The findingsof frequencies of the absorption bands confirmed with the samples structures. Percent crystallinityin LDPE and HDPE were estimated. Overall, the experiment succeeded in showing the identityof the unknown sample. The FTIR spectrum of sample A was identified to relate to PP molecularstructure. The FTIR spectrum of sample A was identified to relate to PS molecular structure. TheFTIR spectra of sample C and sample D were identified to relate to PE molecular structure. Withdifference in the areas under peaks, sample C was determined to be LDPE and sample D wasdetermined to be HDPE. The experiment also succeed in showing that the percent crystallinitiesof LDPE and HDPE were estimated correctly to be 52.787 % and 76.30% respectively. It wasconcluded that different functional groups and percent crystallinity are two major factors makingeach IR spectrum of the four samples a unique one by which chemical structural analysis can beachieved.12
References1L. Reynolds, Fourier Transform Infrared Spectroscopy, MSE 255 course locker, 2016.2B. Stuart, Infrared Spectroscopy: Fundamentals and Applications (Wiley, West Sussex, 2004).3W.D. Callister Jr., Materials Science and Engineering: An Introduction, Seventh Edition (Wiley,New York, 2007).13
Mar 13, 2016 · Fourier transform infrared spectroscopy (FTIR) is a method used to obtain an infrared spectrum of absorption or emission of a solid, liquid or gas. An FTIR spectrometer simultaneously collects high spectral resolution data over a wide spectral