Transcription
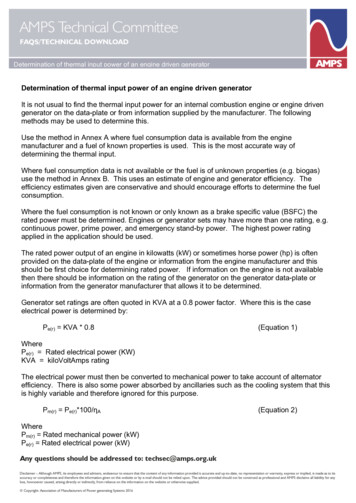
Giuseppe Petruccipage 19/17/2020FTIR of caffeine in beverages.docxDetermination of caffeine content in beverages using Fourier transform infra-redspectroscopyIntroductionIn this lab, you will measure the caffeine content in several popular beverages, includingcoffee, tea and soda using Fourier transform infra-red (FT-IR) spectroscopy. FTIR probesvibrational states of molecules and so is a powerful method of identification of organic molecules,although applications to inorganic analytes is not uncommon. As such, FT-IR is an excellent toolfor qualitative analysis, but, for various reasons discussed below, it has not found as much use asa quantitative tool.I: Qualitative AnalysisThe technique of IR spectroscopy takes advantage of the fact that many molecules stronglyabsorb IR radiation and that the degree of absorption is proportional to the molecularconcentration. The most common wavelength range used in IR spectroscopy extends from about2.5 μm to 25 µm, with the relation between photon energy (E, J), wavelength (λ, m) andfrequency (ν, Hz or s-1) shown below (Eq. 1):E h hc (Eq. 1)where h is Planck’s constant (6.626 10–34 J s), and c is the speed of light in a vacuum (taken tobe 2.998 108 m s–1 ). In IR techniques, the absorption or transmission of the IR radiation iscommonly measured as a function of wavenumber. A wavenumber is the reciprocal of thewavelength and most commonly expressed in units of cm-1. Thus the range of wavenumberscorresponding to a typical IR spectrum would be about 4000 to 400 cm–1 and encompassabsorptions by the majority of common organic functional groups.For a molecule to absorb IR radiation, it must change its dipole moment upon vibration, and thefrequency of the radiation must exactly match the natural vibrational frequency of the molecule,resulting in a change in the amplitude of the vibration. Some simple molecules (O2, N2, etc.) haveno fluctuating dipole moment, and so they do not absorb IR radiation. But many vibrations ofcaffeine (our analyte for this lab) change the dipole moment; such vibrations are said to be IRactive. The two fundamental types of molecular vibrations are stretching and bending modes.The stretching mode consists of a change in the distance along the axis of a bond between twoatoms. The bending mode results from a change in the angle between two bonds. There are fourtypes of bending vibrations: rocking, twisting, wagging and scissoring (Figure 1).
Giuseppe Petruccipage 29/17/2020FTIR of caffeine in beverages.docxOrganic functional groups haveparticular absorption peaks that can beused in qualitative analysis, varyingonly by the molecular environment. Figure 1. Possible fundamental bending and stretchingFor example, the "carbonyl band" of vibrations in a molecule.caffeine around 1655 cm-1 is easilydistinguishable from absorptions by other components of the sample and will be analyzed in PartI of this lab.From quantum theory, the vibrational states are quantized and the allowed vibrationaltransitions are those in which the vibrational quantum number changes by unity (i.e., Δv 1).The more atoms there are in the molecule, the more complicated the IR spectrum becomes dueto increased vibrational coupling and possible overtone peaks and combination bands. Theseeffects create a unique IR absorption spectrum for each molecule that can be used as a“fingerprint” in qualitative experiments.II: Quantitative AnalysisAlthough infrared spectroscopy is used extensively for qualitative analysis in organic chemistry,band intensities are related to the concentration and path length of the sample through theBeer–Lambert Law (Eq. 2) and so this technique can be used for quantitative analysis as well:(Eq. 2)A bc-1-1where A is the Absorbance, ε is the molar absorptivity in (L mol cm ), b is the path length (cm)and c is the concentration of analyte solution in moles L-1. If the absorbance of a series of knownstandard solutions are measured, a linear plot of Absorbance as a function of concentration canbe made and least-square analyzed. The slope of the plot would be equal to εb, allowingdetermination of the molar absorptivity if the path length of the cell is known (typically b 1 cm).Also, an unknown solution’s concentration can be determined after its Absorbance is measuredand applied to the linear least squares fit.
Giuseppe Petruccipage 39/17/2020FTIR of caffeine in beverages.docxThe difficulty with IR absorbancemeasurements is the sloping baseline thatis commonly observed. In other words, inorder for an accurate measure of theabsorbance due to the analyte, anaccurate evaluation of the baseline (orzero absorbance) must be made. Thereare several approaches used for thispurpose, but the most straightforward iscalled the “two-point algorithm,” wherethe baseline is taken as the connectorbetween the valleys on each side of thespectral feature of interest. This approachis shown schematically in Figure 2.AbsorbanceAmaxAanalyteA0Wavenumber (cm-1)In order to accurately determine theabsorbance due exclusively to the e (A0) must be subtracted fromthe maximum measured absorbance (Amax). Now, Aanalyte is plotted against analyte concentration(instead of Amax) to obtain an analyte-selective calibration curve (i.e., you must plot Amax-A0 as afunction of analyte concentration).Figure 2. Schematic approach to determining thezero absorbance with a sloping baseline.III: The Fourier Transform TechniqueMost IR instruments used today are of the Fourier Transform type. There are three majoradvantages of using Fourier Transform techniques in IR spectroscopy:1) Fourier transform instruments do not need slits to attenuate radiation and have feweroptical elements. The increased power reaching the detector gives a larger signal to noiseratio.2) The high resolving power and wavelength reproducibility allow for more accurate analysisof collected spectra.3) The multiplex advantage, or faster scanning. In Fourier techniques, all wavelengths arescanned simultaneously, allowing an entire spectrum to be scanned in 1 second or less. Since the signal to noise ratio R n increases as the number of scans, k, increases (as shown inEq. 3), then Fourier techniques allow many more scans in less time and much better signal tonoise ratios: R n n Rk scans1scank(Eq. 3)As you can see, the quality of the spectrum increases in proportion to the square root of thenumber of scans. Fourier techniques basically differ from conventional techniques in that theymeasure radiant power as a function of time (time domain), whereas conventional spectroscopy
Giuseppe Petruccipage 49/17/2020FTIR of caffeine in beverages.docxmeasures power as a function of frequency (frequency domain). This time domain spectrum isthen mathematically converted into a frequency domain spectrum using a Fourier transform. Theprocess is so complex that it requires a high speed computer and will not be covered here.Power variations at the very high frequencies of IR sources (1012 to 1014 Hz) cannot be measureddirectly with today's electronics (transducers measure averages instead of variations at thesehigh frequencies). Therefore the high frequencies must be scaled down to much lower values inorder to measure time domain signals. This is commonly accomplished using a MichelsonInterferometer (hatched box in Figure 2).A Michelson Interferometer essentiallysplits the IR radiation beam from thesource (high frequencies) into twobeams using a beam splitter. One beamis directed to a fixed mirror and the otherto a mirror moving at a constant speed(vm). The two beams are thenrecombined and directed to thedetector. The moveable mirror causesthe radiation power at the detector to Figure 2. Schematic of a typical FT-IR instrument.fluctuate in a predictable manner basedon the constructive and destructive interference patterns of the recombined beams. Theseinterference patterns are based on the difference in path length (or retardation, δ) for the twobeams. The plot of output power from the detector vs.retardation is called an interferogram (Figure 3).The resolution of the spectrometer, which is the differencein wavenumber between two peaks that can just beseparated by the instrument, is equal to the inverse of theretardation. The relationship between the molecularemitter's frequency, ν, and the interferogram frequency, f,is based on the moveable mirror speed, vm, according toEquation 4:Figure 3. Example of an interferogram.vm (Eq. 4)cAssuming a typical mirror velocity of 1.5 cm sec-1 and with the speed of light being 2.998 x 10⁸ msec-1, then the interferometer reduces the frequency of the source radiation by a factor of 10 –10(i.e., f 10–10 ν). This brings the frequency into the audio range and allows transducers to measurethe power variations and thus record a time domain spectrum. The Fourier transform convertsthe time domain spectrum back to a frequency domain spectrum rapidly and with incredibleresolution and signal to noise ratio.f 2V: Attenuated Total Reflectance (ATR)
Giuseppe Petruccipage 59/17/2020FTIR of caffeine in beverages.docxIt would be very convenient to be able to conduct FTIR analysis of aqueous samples.Unfortunately, water is a very strong IR absorber and would cause significant interference withyour analysis. For this reason, this laboratory first extracts the analyte (i.e., caffeine) into avolatile solvent, which is allowed to evaporate completely prior to acquisition of the FTIRspectrum of the solid. There are several approaches to obtaining FTIR spectra of solids, but, byfar, the most convenient is that of attenuated total reflectance.Figure 4 shows a schematic diagram of multi-bounceATR accessory. This technique allows you toquantitatively measure the absorbance of an aqueousthin film of sample (even though water itself is a verystrong absorber of infrared radiation) or of a solidsample. As seen in Figure 4, in the ATR technique thesample is placed on an internal reflection element andthe IR beam is directed into the element. It strikes the Figure 4. Schematic diagram of an ATRinternal crystal-sample interface at an angle greater cell for FTIR analysisthan the critical angle (i.e., the minimum anglenecessary to generate total internal reflection of the IR beam), and as a result undergoes internalreflection inside the crystal. Most radiation is reflected at the point of internal reflection, but ateach reflection point, the electric field of the IR radiation (termed the evanescent wave) has anexponentially decreasing distribution outside of the crystal (commonly termed the waveguide).The penetration depth (dp) of the IR radiation into the sample is given Equation 5:dp (Eq. 5)2n 2 n xtl sin 2 smp nxtl where λ is the wavelength of light (nm), nxtl is the refractive index of the ATR crystal, nsmp is therefractive index of the sample and θ is the angle of incidence of the light (normal to the crystalsurface). Typically, dp 10 μm. A small fraction of the evanescent wave passing into the sampleis absorbed by molecules present at the surface of the ATR crystal. Since the depth of penetrationis constant for any crystal-sample combination, it can be considered as a pathlength (b). The multipass configuration shown in Figure 4 then serves to increase the sensitivity by increasing theabsorption path length (i.e., dp x # reflections).MaterialsYou will be provided with several samples (solids and liquids) to analyze. Additionally, you willuse reagent grade chloroform (CHCl3) for caffeine extraction and samples preparation.The spectrophotometer you will use for this experiment is the Shimadzu IR Affinity-1 with aPIKE MIRacle, single-reflection attenuated total reflectance (ATR) attachment. Operatinginstructions are provided on the Chem 219 BlackBoard site.Hazards
Giuseppe Petruccipage 69/17/2020FTIR of caffeine in beverages.docxChloroform is a colorless, sweet-smelling, dense liquid. It is toxic by inhalation, ingestion, or skinabsorption. Waste chloroform and methanol should be placed in a labeled halogenated wastecontainer for disposal (see your TA).ExperimentalOutline for the lab: You will prepare standard solutions of caffeine in chloroform to derive a calibration curve forthe analysis. You will also extract caffeine from several solid and liquid samples using chloroform as thesolvent. Finally, you will use ATR-FTIR spectroscopy to quantify the concentration of caffeine in theoriginal samples.Procedure 1 – preparation of standards:Prepare a stock solution of caffeine by accurately weighing approximately 0.10 g of caffeine intoa 100-mL volumetric flask (SS 1). Dissolve and bring up to volume with chloroform. Pipette 5.00mL of this stock solution (SS1) and dilute to 50 mL to prepare stock solution 2 (SS2). Using thetable below, prepare 4 calibration standards from this diluted stock solution, each with a finalvolume of 10.0 mL.Standard12345mL of SS2134510 (no dilution)Concentration (ppm)Procedure 2 – preparation of samples:1) Solid samplesa. Prepare a solution of pre-workout powder as indicated by the manufacturer.When preparing the solution, use a 250-mL volumetric flask (this is approximately8 fl. Oz. or 1 cup) and accurately weigh the powder mass used (i.e., use the scoopprovided to measure out the approximate amount of powder, but weigh theactual mass accurately with an analytical balance).b. In a 30-mL separatory funnel, mix exactly 3 mL of the aqueous solution and 3 mLof chloroform.c. After phase separation, dilute 1 mL of the caffeine solution to a final volume of10-mL with chloroform. This final solution is used for the FTIR analysis.2) Liquid samplesa. In a 30-mL separatory funnel, mix exactly 3 mL of the aqueous sample solutionand 3 mL of chloroform.
Giuseppe Petruccipage 79/17/2020FTIR of caffeine in beverages.docxb. Gently invert/shake funnel for 3-5 minutes.c. After phase separation (15-30 min), dilute 1 mL of the caffeine solution to a finalvolume of 10-mL with chloroform. This final solution is used for the FTIR analysis.Data collection1) Record transmittance spectra from 1000 – 3000 cm-1 at 4 cm-1 resolution with 64 coadded scans.2) Record an open beam background spectrum through the clean zinc selenide crystal afterrinsing it with chloroform.3) For the collection of sample spectra, pipet 30 uL of caffeine/chloroform solution onto thecrystal and allow the solvent to completely evaporate before collecting theinterferograms of the caffeine film formed on the ATR crystal.4) Repeat three times5) Gently clean the zinc selenide crystal with chloroform (using a cotton ball) betweendifferent sample solutionsData analysis1) Construct a standard curve of absorbance vs caffeine concentration using the IRabsorbance using the peak at approximately 1655 cm-1.2) Perform a linear regression analysis to derive the best fit curve to the data (be sure toinclude the error in slope and intercept of the regression).3) Determine the concentration of caffeine in each sample using the standard curve andabsorbance of the extracted caffeine.4) Determine the total mass of caffeine ingested per beverage (assuming a 250 mL, or 1 cup,beverage size for brewed coffee and the powdered drink and 20 mL beverage sizes forespresso samples).QuestionsLab Report GuidelinesIntroduction: Explain the purpose of the experiments and the hypothesis you wish to test.Methods: Discuss aspects of the instrument that you will use in interpreting your results.Results: Discussion:Include calibration curves. Data tables used to make the calibration curves will go intoappendices
Giuseppe Petruccipage 89/17/2020 FTIR of caffeine in beverages.docxDiscuss the experimental procedure, as well as general conclusions reached. Sometopics for discussion (not an exhaustive list!) might include: What conclusions can youreach regarding the caffeine content in the different samples? What are somepossible sources of error? How might you improve the experiment?ReferencesSkoog, Holler and Crouch, “Principles of Instrumental Analysis,” 7th edition, Chapter 16, CengageLearning, 2016.Singh, B.R., Wechter, M.A., Hu, Y., and Lafontaine, C., “Determination of caffeine content incoffee using Fourier transform infra-red spectroscopy in combination with attenuated totalreflectance technique: a bioanalytical chemistry experiment for biochemists,” Biochem. Ed., 26,243-247 (1998)
III: The Fourier Transform Technique Most IR instruments used today are of the Fourier Transform type. There are three major advantages of using Fourier Transform techniques in IR spectroscopy: 1) Fourier transform instruments do not need slit