Transcription
Infrared Phys. Vol. 24, No. 2/3. pp. 69-93, 1984Printedin GreatBritain.0020-0891/84 3.00 0.00All rights reservedEARLYCopyright !c 1984 Pergamon Press LtdHISTORY OF FOURIERSPECTROSCOPYService d’AkonomieTRANSFORMPIERRE CONNESdu CNRS, B.P. No. 3, 91370 Verrieres-le-Buisson,France(Received 31 October 1983)Abstract-Thisis an attempt to explain how and why the stage was set for the appearanceon the sceneof Fourier transformspectroscopy(FTS) in the 1950s and not a whit before. The play begins 100 yearsearlier with Fizeau and Foucault who first produced high path-differenceinterferencephenomenaandused them for measuringsolar spectrumwavelengthsin the near IR. Next, the story unfolds withMichelson’s contribution,which led to importantdiscoveries around 1890: the hyperfine structures andwidths of atomic lines. Somewhat less well known is the Rubens interferometrictechnique, presented in1910, because no such striking results were ever collected; still, it represented a distinct advance over theMichelson one.What is the reason why Michelson, Rubens and Lord Rayleigh (who made no experiments himself butunderstoodall about them) never managed to get together and propose the modern form of FTS? Partof the responsibilitywe must ascribe to chance; however, sufficient motivationcould not be felt as longas basic noise limitationshad not been understoodand closely approached.INTRODUCTIONThe Durham Conference has just demonstratedthat Fourier transform spectroscopy (FTS) is nowone of the most versatile and widely useful tools in the paraphernaliaof modern optics. Will itbecome one of the permanentfeatures of the landscape, just like-letus say-theCathedral? Sucha prediction would be risky of course; but any participantwho briefly stole away from one of theless thrilling sessions and trespassed across the Close, surely discovered that all the great survivingmedieval cathedrals are first of all things of the mind: destroyed, rebuilt, enlarged or mutilated,plastered all over and then joyfully restored and rediscovered. What truly endures is oft more thespirit than the stones. At the dissipationrate of all things modern, our present interferometers(some of them anyhow) will be museum pieces before the turn of the century-millenium,andlikewise most of our analysis or recording techniques. But the basic principles involved might wellexhibit far greater staying power, and earn a permanentniche on the shelves of scientificmethodology(see Note l).*Where do they come from? All involved in FTS realize that the independentwork of Fellgettand Jacquinot about 30 years ago is unquestionablyat the origin of the whole development(seeNote 2). They also know of the classical results of Michelson,a trace of which is still found intextbooks, but only vaguely. Few are even aware of the work of Rubens in the field, or realize thatthe modern form of FTS was almost discoveredaround1910; if it had been, much of thedevelopmentof twentieth century spectroscopywould have been different, particularlyof coursein the IR.Why was it not discoveredin actual fact? Was the prime reason insufficientmathematicalunderstanding,immature technology,absence of motivation,or just the lack of the right people(the last being of course no valid historical explanation)?How much of the basic advantage of FTS(as we understandit today) was already seen? How close to the modern devices were the turn ofthe century interferometers?And what is the essential change of scene that made possible-andpractical-thetechnique that had failed 40 years before? The following brief (and amateurish)historical study will attempt to answer these questions.It will not start with Fourier, whosecontributionis of course essential but had originally nothing to do with optics. For the purposeof our demonstration,the story begins by experimentaladvances around the middle of the lastcentury.*Notes1-7 can be found at the end of the article.69
70PIERRECONNESI. 68)Born within a few days of each other, Fizeau and Foucault at first tackled several fundamentalproblems of experimentaloptics together; after they split, in 1849, they went on in competition.and produced equally brilliant results, We are concerned here with a minor part of that work: theircontributionto interferencespectroscopy.Fizeau and Foucaultinitiatedtwo distinct lines ofresearch which were much later to converge and make present-dayFTS possible: the productionof interferencesat high path d@erence, and the recording of IR int fi renceJringes, leading to thefirst measurementof IR wavelengths.Prior to 1845, no interferencephenomenaseem to have been observed, or at least understoodand properly analysed, for path differences greater than a few wavelengths.Then Fizeau andFoucaultpublishedtogether two brief Notes”’ “ Sur le phinomenedes interferencesentre deuxrayons de lumiere dans le case des grandes differences de marche”. The authors introduce a newtechnique: the observationof channelled spectra (thanks to a much improved prism spectroscope)and its systematic use for the measurementof path differences. The source was the sun, and brightand dark bands were counted in between the Fraunhoferlines. Three different interference deviceswere used (Fig. 1):“With Fresnel mirrors, we have observed interferencewhen the path difference forblue rays near line F was 1737 waves. Through reflexion upon both surfaces of a thinplate, interference was noticed when the path difference went up to 3406 waves. Withcrystallineplates the phenomenonhas been followed for remarkablyhigh thicknesses . . . ‘*In the second Note, the not-so-thinisotropic plate thickness went up to 1 mm and path differenceto “seven or eight thousand times the fundamentalinterval A”, thanks to the use of up to five prismsin series. (See Note 3.)Fourteen years later, Fizeau (by then no longer paired with Foucault), was to take up again thequestion of large path differences, but with a different source. His paper,“’ “Note sur la lumieredu sodium brulant dans lair”, was about a popular subject at the time; indeed, he refers to the“many and importantresults present in the work of M. M. Kirchhoff and Bunsen”. Fizeau is heremostly concerned with his own discovery of an inuerteci pair of D lines from a piece of burningsodium; but he mentions almost incidentallythat from an ordinary sodium flame he has obtained:i‘the phenomenonof Newton rings, observed with that very simple light, bynormal reflexion on the two surfaces of plates that are relatively very thick for suchphenomena,since the thickness went up to 10.058 mm, correspondingto a ring oforder 52193.”.A detailed account is promised “in my next work”. Thanks to the fat pile of scribbled laboratorynotes preserved at the Academic,we can follow Fizeau’s progress: he was buildingthe firstvariable-pathinterferometerfor wavelength measurementby fringe counting (Fig. 2) surely theancestor of all present so-called “Fourier interferometers”(a particularlyabsurd contraction).Theresults were presented a few months later, somewhat hidden away within a paper on interferencebuiltmeasurementof refractive index thermal variation for various solids. lh) The small instrumentby Duboscq is described, together with the now familiar sight of Newton’s rings (here observedas “Fizeau fringes” between a plane and spherical glass surface) expanding or contractingwhenthe separation is changed. Fizeau notices and explains correctly the successive coincidences betweenthe fringes from the two D lines, up to the 52nd period of the phenomenon,i.e. 50,000 fringes anda plate separationof 15 mm. The red line of lithium is also observed. and the wavelength givenfrom the coincidenceswith the D lines. There is no attempt yet to deduce wavelengthsfrom theknown pitch of the screw. However, in,fine, the remarkable stability of fringes seen on a thick glassplate (at constant temperature)is ncticed; it is estimated that with the path difference being about50,000 fringes and a 1/2&h of a fringe motion being easy to detect, the stability must be betterthan 10. ‘. Fizeau concludes by expressing the hope of importantapplications.From this remark.all of modern length metrology was to arise.
fi
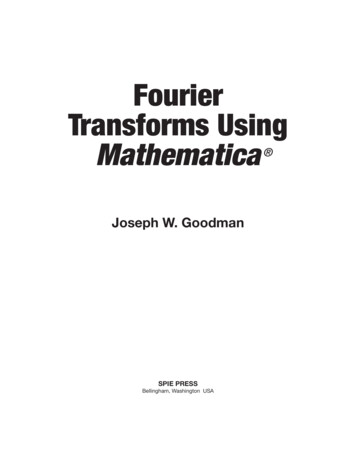
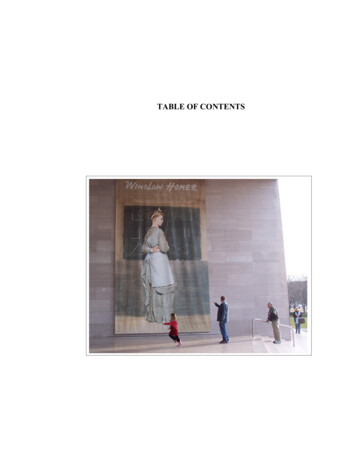
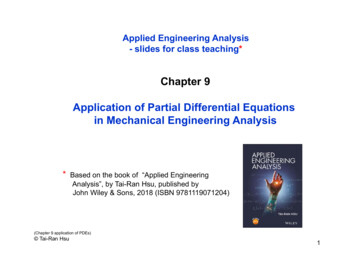
PIERRE CONNESFig. 2. Laboratorynote of Fizeau, dated 3 February1862, illustratingthe mechanical design of the firstvariable-pathinterferometerfor wavelength measurementby fringe counting: “I have made an agreementwith Mr Duboscq for constructinga small instrument suitable for measuring the wavelengths of light. .”The device shown is a differential screw with two nuts, one fixed (pitch 0.5 mm) and one mobile (pitch0.5 x 20/21 mm). For sodium light Fizeau computes a count of 85 fringes/revolution.Also preserved isthe draft of a letter to Duboscq (a well remembered instrument maker), discussing some points and endingwhichwith the plea: “. I rely on your promise of actively pushing the work on this small instrument1 find quite indispensable at present. .“. Results were to be given soon after. in Ref. (6). (Reproducedcourtesy of Archives de 1’Acadimie des Sciences. Paris.)As soon as Fizeau and Foucault had perfected their technique they applied it to the detectionof IR radiation,and to measuringIR wavelengths.In the first paper,(‘) “Recherchessur lesthe source was the sun again, and the detector an alcoholinterfkrencesdes rayons calorifiques”,thermometerwith a 1 mm dia spherical bulb; a 1” temperaturechange induced 8 mm of columnexpansion, which was followed with a microscope; one micrometer division correspondedto l/400-.
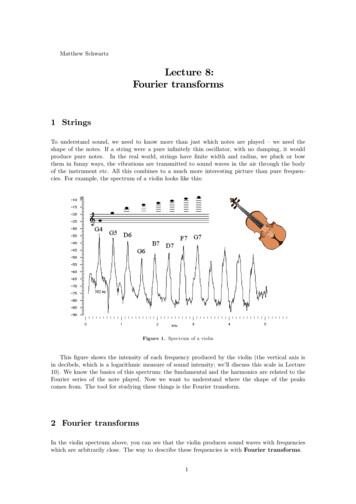
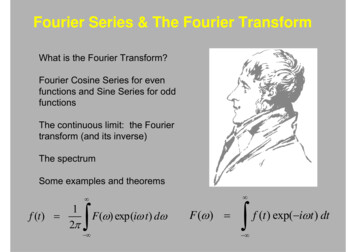
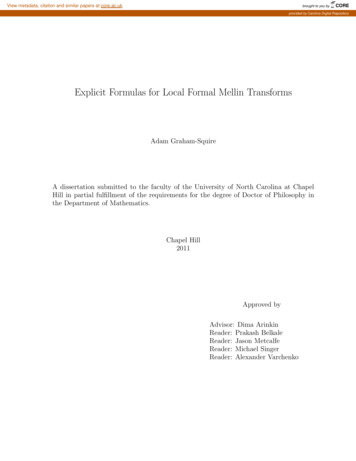
Earlyhistoryof FTS73Fringes were observed, and followed into the IR, again from a pair of Fresnel mirrors, and nextfrom crystal plates; Fresnel diffraction from a straight edge was also observed.Shortly before, Fizeau and Foucaulthad presentedtheir first daguerreotypesof the solarspectrum (here they had been preceded by Draper) to the Societe Philomathique.In their paper,@)they discover that the red rays have an inhibitingeffect on the mercury vapour condensationprocess. Furthermore:“beyond the visible spectrum,which is. . the inverse action begins noticeablyaffected up to the orange rays region; it is most intense near the A line (i.e. near7600 A); the part extending outside the visible spectrum is about as wide as the red,and, like the rest of the spectrum, is marked by lines.”Hence, members of the Societe had been offered the very first IR photographic spectrum, albeitin negative form. There was more to come. At the end of the same year, 1847, Fizeau (this time,alone) discussed before them the “Longueursd’onde des rayons calorifiques.“(4) He had been ableto use the channelledspectrum technique, but only with a crystal plate cut parallel to the axisbetweenpolarizers.We are not told why, nor which crystal was used. The influenceofdouble-refractiondispersion is described and taken care of by extrapolationof results collected inthe visible part of the spectrum. Fizeau ends by giving wavelengths:“ . for the principal points of the obscure region: those presenting a maximum, aminimum or a linein millionths of a millimeter . . . We find for the invisible heatrays 1011, 1196, 1320, 1445; this last correspondsto a remarkableline; for a moredistant point, 1745; then, for the limit of sensible heat, when the spectrum is producedby a flint prism, 1940.”0.2 5.-0.2-7I,I,I,I,,,,,,I,(,I,,,,,,I,o-0.1 5-SolarIrradiationCurve ckbadyAtmosphereot Sea Levelat 59OO’KEzI a,O-0.0 g. 3. A modern solar energy curve [reproducedfrom Handbook of Geophysics and Space Environments(1965), courtesy of McGraw-Hill,New York] compared with the wavelengthsof the successive maximaand minima measured by Fizeau, using his channelledspectrum interference technique.
14PIERRECONNESAs Fig. 3 shows, Fizeau was indeed scanning a recognizablesolar spectrum; let us not forgetthat all the time he had to follow an alcohol column with a microscope and that a channelledspectrum was superimposed.With his resolution,the 1.I 5 and 1.4 pm water vapour bands couldnot be distinguishedfrom Fraunhoferlines and his practicallimit, 1.94 pm, was due to acombinationof decreasing solar energy and prism dispersion.Even so, the first quantitativeIRspectrum had been measured by an interferencetechnique!Hence, Fizeau and Foucault initiated the long quest for extension of the IR range that was tobe concluded by Nichols and Tear in 1923; at the same time they laid the groundworkfor all futureFTS. One may well ask the question: Why no IR wavelengths had ever been measured before withFraunhofergratings, just like visible wavelengths? The difficulties, although not clearly fo ulatedand set into print at the time, must have been the same that were to plague later experimenters:overlappingof orders is highly confusingif suitable filter materials have not been found andstudied. Also the poor efficiency of gratings already gave a definite advantage to the interferometricmethod.However,the prism specfroscope played an essentialrole in the Fizeau-Foucaultexperiments.Indeed the physical display of bright and dark interference bands in a spectrum, eitheron a screen or within an eyepiece, must have been an unavoidableintermediarybefore the laterformulationof FTS. Anyway,it remains one of the prettiest shows in optics. Today, thatchannelled spectrum is still there, plainly visible in the mathematicalformula we use for depictingour interferograms;however (discountingthe astute but somewhat myopic gropings of Rubens).an even century was to elapse before we grasped that neither slit nor prism had ever been neededto start with.II.ALBERTABRAHAMMICHELSON(1851-1931)There is no question of recountinghere the fulI story of Michelson, nor even of that Proteantype of inteferometerthat now bears his name. The initial goal, starting in 1881, had been thesolution of the ether drag puzzle. However, 6 years later we find Michelson (now ensconced at theCleveland Case School of Applied Science) turning his energies in a wholly new direction. In thePhilosophical Magazine of 1887, immediatelyafter the full account by Michelson and Morley oftheir famous experiment,is found a short note by Michelson,“On a method of making thewavelength of sodium light the actual and practical standard of length “,(‘) in which the essentialsof the fringe-countingtechnique are given. After recalling that “Fizeau was unable to observeinterference when the difference of path amounted to 50,000 wavelengths”(see Note 4). Michelsonpresents his own results:“‘With metallic sodium in an exhausted tube provided with aluminumelectrodes, itwas found possible to increase this number to more than 200,000. . . Among othersubstances tried in the preliminaryexperiments were thallium, lithium and hydrogen.All of these gave interferenceup to fifty to one hundred thousand wavelengths,andcould therefore all be used as checks on the determinationwith sodium. It may benoted that in case of the red hydrogen-line,the interference phenomenadisappearedat about 15,000 wavelengths, and again at about 45,000 wavelengths;so that the redhydrogen-linemust be a double line with the componentsabout one sixtieth asdistant as the sodium-lines.”We see how, from a goal that had been metrology, Michelson was being drawn into s ec r . cop by the very nature of things. The two subjects are conceptuallyworlds apart, but closely connectedby the trivialities of technology:if some atomic line is to be used as length standard, it must beboth sharp and symmetrical,hence we have to plot the profile, find satellites etc. The mere ideaof absolute wavelength determinationby fringe counting was obviously straightforwardenough,once Michelson had his interferometerin hand; truly, it had been Fizeau’s idea. However, for fullnovel and conceptuallyfar more complexline-profileanalysis,primarilya wholly distinct,technique had to be evolved. Fortunatelyfor the historian,several Michelson papers in closesuccession enable us to follow the path he took. In his 1890 “Measurementby light waves”,‘*’ hecalls attention to three closely-relatedforms of the two-beam interferometer,still called at this stagea “refractometer”(a vestige of the ether drag epoch): the tool may be used as a microscope,
telescope or spectroscope. The first of the three proposais was not to be implemented, for lack ofsuitable star-like microscopic objects. Full demonstration of the second in the astronomical fieldwas still 30 years away, for essentially practical reasons: only the Mount Wilson 250 cm reflectorwould prove rigid enough to carry the device. By contrast, spectroscopy (which remainedMichelson’s immediate concern anyway), was to benefit immediately.Nevertheless, the description of the essence of the method was to be given !ith t mtwthingspectroscopy in the next two papers: “On the application of interference methods to astronomicalmeasurements”(g) and “Visibility of interference fringes at the focus of a telescope”.“O’ Michelson,making use of the Rayleigh treatment of diffraction, introduces visibility as a measurable quantityfrom which source intensity distribution may be inferred. The now classical cases of a slit, a uniformor non-uniform disk, or two disks as sources are treated. Some details of the instrument neededto observe the fringes are given; but the aztempt was still in the distant future.The next tw5 papers, dated 1X91 and 1892, “On the a l caiion of interference methods tospectroscopic measurernents” “,‘*’ obviously play the centrai role in our attempted historicalaccount. They are also classical, and sufficiently well known nat to require detaiIed analysis [a fulltreatment, using modernized notations, is found for instance in Ref. (37)]. We shall merely try tofollow the flow of ideas. The main point of interest is that Michelson proceeded from the conceptof a spatial visibility curve ta that of a spectral one:“In the present paper it is proposed to show that the same principle holds inspectroscopic observations and even with greater force,In fact, a spectral line might be viewed by a telescope converted into a refractometer, and the “line” could be studied in precisely the same way as a nebufous star.Such a method, however would multiply the necessary im rf ctions of lenses andprisms or gratings.Fortunately both spectroscope and telescope msy be dispensed with, by substituting the refractometer in any form which allows a considerable and steadyalteration in the diEerence in path between the two interfering streams of light fromany approximately homogenous source.““‘)In other words, that very same tool the interference ‘“refractometer” that had already beenproposed for the wavelength determination of the meter, also proved suitable for spectroscopicanalysis. However, this discovery was at the time never more than a happy coincidence, a fact whichmust be stressed if one wants to understand both the brilliance and the limitations of cbelso sinterference spectroscopy achievements. The modern form of FTS is readily seen today as anaccomplished technique for spectral analysis n& accurate wavelength d terrn na io . ForMichelson and all his readers, the two problems remained conceptually separate, because separateindeed had been the ways by which both had entered the scene; and no point was ever seen insearching for the complete a.nd unique solution we are now familiar with.Let us now comment on the main points. A brand new technique had been introduced whichhas “extraordinary advantages. . in consequence of the almost complete freedom from errorsarising from defects in optical or mechanical parts.” This is indeed fundamental, and the ensuingadvantage over on ent o a spectroscopic devices should, irs all fairness, bear Michelson’s nametoday But he never even rn d tk facquinot and Feligett advantages that his own interfervmeter exhibits-whew properly used. fndeed the question could hardly arise at all, consideringthe limitations of the technique he was using: his only detector was the eye, and the best he coulddo was estimafe friprge rsi;ribility, not record fringe inrensixy. He did it in an elegant manner,calibrating his own eye with fringes of known visibility, but this essential limitation explains whyhis whole treatment of interferometer data, geared to the sole use of the eye, was to remainincomplete. In particular, he had no concern at all with what today is the physically importantparameter, i.e. the light flux (or power} available at interferometer output: what he dealt with wasmerely illumination. Hence there could be no point at all in speculating about the increase in Nuxcompared with gratings.
76PIERKE CONXESNext, we have an explicit statement showing that Michelson not only never considered thepossibility of multiplexing, but found his method comparatively s10w:‘ ”“*The examination of spectral lines by means of the interferometer, while in somerespects ideally perfect, is still objectionable for several reasons. In particular, itrequires a very long time to make a set of observations, and we can examine onlyone line at a time.”How did Michefson treat the problem ma hematically The very first expression he gives for theintensity as a function of path difference D from a spectrum (n) between wave numbers rri andf22is:,,?@(tt) cos%c Dndn,i “Ii.e. exactly the one we use today for our interferograms. However, he immediately introduces thesimplifying assumption of a very narrow spectral range (he never, even much later, considered thegeneral case), and proceeds to compute fringe visibility, introducing in the process two quantitieshe calls C and S: these are actually the cosine and sine Fourier transforms of his narrow spectralfunction. But he is not aware of treading familiar ground: the name of Fourier is written nowhere.and the subsequent treatment is wholly correct onfy for futly symmetrical lines or groups of lines.He is dimly aware of the difficulty:i, . . . in many cases it is difficult or impossible to decide between two or moredistributions of lines which give very nearly the same visibility curve; and when thereare many lines in the source, the combination of intensities and arrangements of thesefrom which a type may be selected is enormously great. Indeed, even when thenumber of lines is greater than three. . . the resulting visibility-curve becomes socomplex that it is very difficult to analyse”.“”Almost immediately Lord Rayleigh pointed out the deficiency in the analysis.‘131Introducingright from the start “Fourier’s theorem”, he shows that reconstructing an asymmetricai spectrumrequires separate measurements of C and S, and adds:“However, the visibility curve by itseff gives, not both C and S, but only t’ S’;so that we must conclude that in general an indefinite variety of structures isconsistent with a visibility curve given in all its parts.”The difficulty was fundamental: no mere increase in accuracy could solve it. Indeed Michelsonhad”--somewhat imprecisely-indicatedhow a solution could be found in principle:“”“In the case of an unsymmetrical source, it is possible to determine the position ofthe brighter portion by gradually increasing the difference in path from zero. If thefringes are thereby displaced in the positive sense from the position calculated fromthe mean wavelength, then the brighter edge lies toward the violet.”Indeed, but no practical means are even suggested for measuring Jiinge sj ,an entirelydifferent kettle of fish from fringe viddity. As Lord Rayfeigh was to put it:“I suppose that a complete determinationwould be an extremely difficult task.”of C and S, though theoretically possible,The discussion of Rubens method (to be given a little later) will prove that the “extremedifhculty,” that neither Michelson nor Rayleigh were ever to solve, was not due to availabletechnology, or at least not primarily so. We have to take as an historical fact that a conceptualstumbling block lay on the road between those deceptively close-looking neighbours: reconstruction of a small group of lines from the visibility curve, and that of a whole spectrum fromthe interferogram. The full solution was to be found only 50 years Iater; however we must note,in all fairness to Michelson that it indeed lay in “gradually increasing the path difference fromzero.”
Fig. 4. Michelson’s own interferometer. In 1892 he took it to the Bureau International des Poids et Mcsures, Sivres, France; a letter from him to the Director, DrBenoit, is still preserved, where he announces his arrival at Le Havre with the crates. The instrument here is as depicted in the account of the famous measurementof the meter!‘4’ It is stlli in use at BTPM today with only minor modifications (in particular, inclusion in a vacuum tank), but of caurse, using phatomultipl ers.
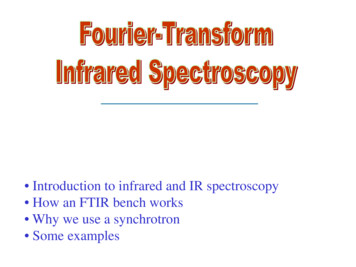
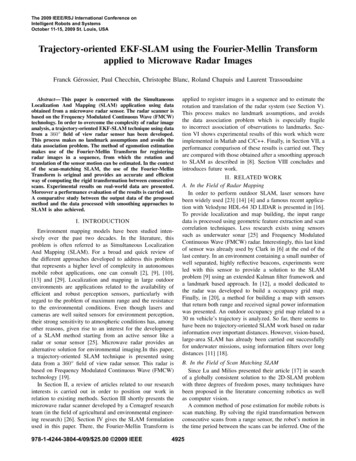
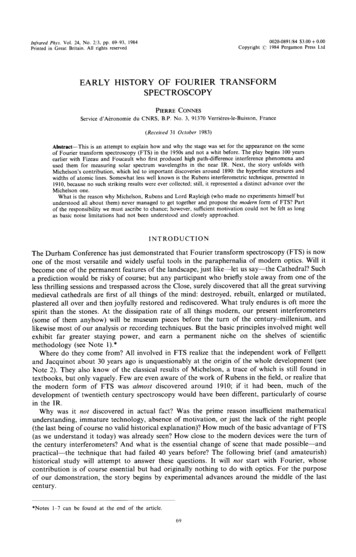
-I-.*-I*.-. ---.---:‘------I.‘--Tl*-5350I-----&200 mmmm”’*--.i-L- --y-. ‘. x-*-k -p-y. -, r4358from Michelson’s fundamentalpaper.“” The solid line visibility curve is measured. and the dotted one computedMichelsondiscoveredand studiedtwo andtemperature-pressure-limitedline widths.Cd 6438Fig. 5. Visibility curves and reconstructedstructuresfrom the supposedstructure.In this way,, 1I‘i- .
Early history79of FTSMFPVBIFabry and PBrot (1899)GSMichelson (1982)Gr.fGale and Lemon (1910)Dufour(1951)Blaise and Chantrel (1957)fu(?“%g Lla307.493Gerstenkorn et al. (1982)Fig. 6. The saga of the mercury green line through the spectroscopicages. Michelson (f892): same as inFig. 5. Fabry and P&or (1899): first visual results from multiple-beaminterferometer. 19) Gale and Lemon( 191#):‘2*) an early review of available results (see Note 7). M: Michelson, from the visibility curve. FP:latest Fabry-Perotdata. VB, J. G, S: results from various authors using the MicheIson echelon andLummer plates. In all of these cases there is some ambiguity due to overlappingof orders. GR: resultsby the authorsusing the latest Michelsongratings.Dufaur (1951 : I321first recordingby scanningphotoelectricFabry-Perotetalon; for the first time we have correct intensities.Blake and Chantrel(1957):‘36’ best results from double FabryyPCrot,with a liquid-hydrogen-cooledhollow cathode source.Gerstenkorn et al. (1982):‘43’ a recent FTS spectrum, but merely from a room temperaturesource (purposeof the study was not analysis of hyperfine structure).At last the result is totally free from overlappingof orders.The immediatepractical consequencewas that only the very simplest structuresplotted byMichelson were approximatelycorrect. Even with just a pair of lines, he could not tell on whichside the strongest of the two lay. The most complex structure he attempted to unravel was thatof the green mercury line, in which he thought he’d detected four peaks, one with a complex shape.Fig. 7. The difficult mercury green line case for three different source pressures as given in Ref. (12). Noreconstructedstructure is provided;the figure illustrates well how complex were the visibility curvesMichelson had to deal with in the worst cases.
80PIERRECONNESFigure 6 follows the full saga of the mercury green line from those heroic times to the present dayand shows how fact was-slowly--disentangledfrom fancy. Still Michelson did his best to useproperly that visibility curve; at the beginning,the lines were found by pure guesswork followedby trial and error; in his paper”” two curves, one measured and one computed from the supposedstructureare always given (Fig. 4). Clearly the process became laboriousand the residualdifferences markedly increased, for the most complex structures. He soon felt the need for a moresystematic approach and in 1898 described his “New Harmonic Analyser”,(‘h) a magnificentfullymechanicaldevice which represents a distinct improvementover Lord Kelvin’s perhaps betterknown “Tide predictor”.It could generate the sum of up to 80 Fourier terms, and produce bothsine and cosine transforms;in modern terms, it was able to reconstructan 80-element spectralrange. Michelsonwas pleased with the performance:“. . it would be feasible to increase thenumber of elements to several hundreds or even a thousand with a proportionalincrease in theaccuracy of the integration”.Indeed the many tests reproduced in the paper show that accuracywas fairly good.Almost immediatelyan opportunityarose for demonstratingthe instrument’susefulness:‘“A little over a year ago the scientific world was startled by the announcementthatProfessor Zeeman had discovered a new effect of magnetism on light.It occurredto me at once to try this experiment by the interference method, which is particularlyadapted to the examinationof just such cases as this, in which the effect to beobserved is beyond the range of the spectroscopicrnethod.“( Indeed, where Zeeman had at first seen only a b uu i nin of the lines, Michelson was at onceable to shown that there was a splitting. He published two papers in quick succession. For thelirst,(‘s) in 1897, the analyser was not yet available; but it came in very handy for the second”” in1898. Here we have the best and most elaborate results ever given by fringe visibility. Michelsonappears to have even attempted,in this particular case, to derive the complete, correct solution(for a narrow band spectrum), using Lord Rayleigh’s lesson to the full:“”“In genera1 the phase curve is troublesometo observe on account of the difficultyin securing a sufficiently homogeneouscomparisonsource, but in the present instancethis is furnished by the non-magnetizedradiations.Usually, however, the assumptionwas made that the spectrum was symmetrical,and in only a few cases was thesolution verified by the complete analysis.”Indeed, no results from phase analysis were ever given. Still, as a consequenceof that fortunatesymmetry in the phenomenon,his Zeeman patterns (unlike his hyperfme structures) look all rightto the modern eye (Fig. 8). “Fifty o
of Fourier transform spectroscopy (FTS) in the 1950s and not a whit before. The play begins 100 years earlier with Fizeau and Foucault who first produced high path-difference interference phenomena and used them for measuring solar spectrum