Transcription
LIU1 LAYOUT.qxp Layout 1 7/17/14 2:07 PM Page 32Monitoring and AnalyzingBig Traffic Data of a Large-ScaleCellular Network with HadoopJun Liu, Feng Liu, and Nirwan AnsariAbstractNetwork traffic monitoring and analysis is of theoretical and practical significancefor optimizing network resource and improving user experience. However, existingsolutions, which usually rely on a high-performance server with large storagecapacity, are not scalable for detailed analysis of a large volume of traffic data. Inthis article, we present a traffic monitoring and analysis system for large-scale networks based on Hadoop, an open-source distributed computing platform for bigdata processing on commodity hardware. This system has been deployed in thecore network of a large cellular network and extensively evaluated. The resultsdemonstrate that the system can efficiently processes 4.2 Tbytes of traffic data from123 Gb/s links with high performance and low cost every day.With the proliferation of powerful mobiledevices, innovative mobile applications,and increased spectrum availability, cellular networks are emerging as the primarymeans for accessing the Internet. In order to support theexplosive growth of data volume, cellular network operatorsneed to manage and plan their network resources accordingly.Hence, the ability to accurately and extensively monitor andanalyze network traffic is a fundamental necessity for networkoperations and optimization.Over the years, a number of methodologies and toolshave been developed for traffic monitoring and analysis.They can be categorized into two disciplines: active and passive approaches. The active approach generates probe traffic to induce measurable effects for extracting informationof network status. Drawbacks of the active approach includeinterference to the normal traffic by injected probes and thequestionable precision of inferred conclusions about theoverall network. In contrast, the passive approach studiesthe network as an unperturbed system. Passive tools do notgenerate probes into the network or change the originaltraffic, but silently observe and analyze the traffic in thenetwork. They are preferred in managing and planning commercial networks.Essentially, the enablers for passive monitoring and analysisof commercial networks are high-speed traffic acquisitiondevices, large-capacity storage hardware, and high-performance computing servers. In general, the traffic acquisitiondevices collect traffic data at two levels, the packet and flowlevels. Both of them require the network management systemJun Liu and Feng Liu are with Beijing University of Posts and Telecommunications.Nirwan Ansari is with the New Jersey Institute of Technology.320890-8044/14/ 25.00 2014 IEEEto employ a large storage system and high-performance computing server to store and analyze the traffic data from a hugenumber of network devices. However, as networks grow exponentially, administrators face the big data challenge, that is,managing and processing a huge amount of traffic data (e.g.,terabyte or petabyte packets or flow records). Traditional network measurement systems, which usually rely on a centralized high-performance server, can no longer handle this hugeamount of data. An efficient and scalable traffic monitoringand analysis system is thus called for.In contrast, the explosive growth of the Internet’s population and data-intensive applications has advanced theresearch and development of scalable platforms and technologies for data mining, commonly used by large Internetcompanies. Two of the major emerging technologies are GFS[1] and MapReduce [2] developed by Google. The combination of GFS and MapReduce allows developers to manageand process a massive amount of data in a distributed manner over thousands of commodity computers. Inspired byGFS and MapReduce, the open source community producesthe Apache Hadoop [3] sponsored by Yahoo!. Due to its lowcost and high efficiency, Hadoop is widely used as a distributed computing framework to conduct large-scale data processing. Hadoop possesses several valuable features: efficientdistributed parallel computing, low-cost scale-out capability,and high fault tolerance. These features enable Hadoop to bea suitable platform for large-scale network measurements.However, it is a great challenge to tailor Hadoop for networkmeasurements because it was originally developed for batchoriented tasks, such as text mining and web page indexing.Nevertheless, some efforts have been made toward this goal.For example, Lee and Lee [4] developed a Hadoop-basedtool to process libcap packet trace files in a parallel manner.RIPE [5] aims to provide a library based on Hadoop to analyze PCAP files. They made the first attempt to process theraw packet data in Internet. In addition, authors in [6, 7]IEEE Network July/August 2014
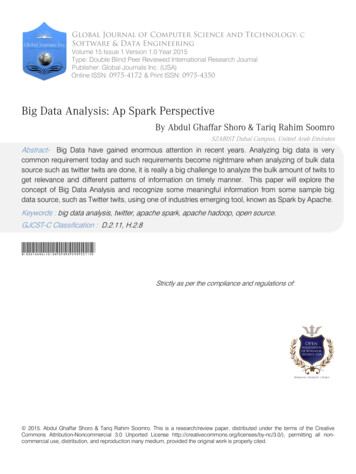
LIU1 LAYOUT.qxp Layout 1 7/17/14 2:07 PM Page 33BTSTrafficanalysis MRApplicationanalysis MRUser behavioranalysis MRCLIPlanningBinaryinput/output AdminInternetSGSNNode-B ersGiFigure 1. System architecture.investigated how to analyze large volumes of network data byHadoop-based tools like MapReduce and Pig. Althoughthese initial works have demonstrated the viability of usingHadoop for analyzing network traffic data, some importantissues in large-scale commercial telecommunication networkshave not been addressed.In this article, we propose a Hadoop-based scalable network traffic monitoring and analysis system for big trafficdata. The system is designed and implemented following amulti-layer architecture with functional components includinghigh-speed traffic monitors, traffic collectors, data store,MapReduce analysis programs, result presentation interfaces,and a cluster manager. To prove the viability of the proposedsystem, we deploy the system into the core network of a largescale second/third generation (2G/3G) cellular network. Theresults demonstrate that Hadoop is a promising enabler forbuilding an efficient, effective, and cost-efficient large-scalenetwork traffic monitoring and analysis system.Hadoop-Based Large-Scale Network TrafficMonitoring and Analysis SystemFigure 1 shows the architecture of our proposed Hadoopbased network traffic monitoring and analysis system. Anexposition of its major components is offered next.Cellular Data NetworkGenerally, the cellular data network can be divided into twodomains: access and core. The access is composed of a number of radio access networks (RANs) including Global Systemfor Mobile Communications (GSM)/Enhanced Data Rates forGlobal Evolution (EDGE, 2G) and Universal MobileTelecommunications System (UMTS)/High-Speed Data Packet Access (HSDPA, 3G) RANs. A mobile device communicates with a transceiver station in the access network, whichforwards its data service traffic to a serving general packetradio service (GPRS) support node (SGSN). The SGSNestablishes a tunnel on the Gn interface with a gateway GPRSsupport node (GGSN) that provides connectivity to the Internet via the Gi interface. Through this path, the requestingIEEE Network July/August 2014message of a mobile device enters the Internet and reachesthe serving server. Data responding from the server to themobile device traverse in the reversed path.Traffic MonitorTo meet the increasing bandwidth requirement, mobile operators are deploying more network lines at the gigabit level,such as 10G (OC-192) and 40G (OC-768). In such a highspeed environment, even with offloading network interfacecards and optimized kernel code, software-based traffic monitoring systems are still inadequate to achieve real-time monitoring. The hardware-based tailor-made collector system is theonly option for networks with multiple 10 Gb/s links.We design and implement a flexible monitoring systembased on a scalable hardware/hardware-combined architectureto cope with the modification and addition of monitoringrequirements as well as future rate increase. The hardwarecomponent, named Traffic Monitor, is in charge of the performance-critical tasks such as deep packet inspection, flowrecord composition, and basic packet statistics. Otherresource-intensive tasks like application-specific record generation are executed by software components. We utilize thereconfigurable capabilities of field programmable gate arrays(FPGAs) and parallel processing techniques to achieve bothflexible and high-speed concurrent packet processing.Key features of Traffic Monitor are:1. Line-speed packet parsing: The objective of packet parsingis to extract expected attributes of header and contents ofpayload. We implement a set of parsing algorithms withinterpretation rules for different types of protocol formatslike PPPoE and GRE to capture packets at various networkinterfaces, such as Gb, Gn, and Gi.2. Accurate flow composition: A flow is a collection of packetsbetween two end nodes defined by specific attributes, suchas the well-known TCP/IP five-tuple. Metrics of flows canillustrate more useful information than individual packets.The flow manager component generates and updates theflow records stored in the flow cache. Completed flows,which are terminated by TCP FIN packets or time-outevents, are exported by the flow exporter as Flow RecordFrame in a predefined binary format.33
LIU1 LAYOUT.qxp Layout 1 7/17/14 2:07 PM Page 34Viewingp1 t3p2r3p3.User t20r19r20t21.r14 r15r16t14 t15 t16r21p3t170t18Tr182Tp2New tab3T4T5Tr22 r23r24t22 t23t246Tt333O8O232233O13O4O632O71.User Cr171O51p3r12r13t12 t133O3tr8User Br9311t7T (s)(a)(b)Figure 2. HTTP click request identification: a) web browsing behavior; b) HTTP request dependence graph.3. Real-time traffic classification: Traffic classification is fundamental to numerous network management tasks. Thetraffic classifier component provides real-time traffic classification with 14 service classes and 129 sub-service classesby combining port-based application deduction, deep packet inspection, deep flow inspection, and statistical patternsbased technologies. Classification results are exported intotwo fields of a Flow Record Frame.4. Multi-level traffic statistics: The Traffic Monitor supportstraffic statistics at three granularities: packet, flow, andaggregated. At the packet level, information on each packet, such as bytes and arrival time, is accumulated to produce the statistics report. The flow-level statistics providedetailed information of each observed flow like durationand number of packets. Statistics at the packet and flowlevels can be aggregated from different perspectives to generate various aggregated reports, such as by user identityand service class.5. Fine-grained traffic shaping: To support QoS differentiation, traffic shaping can be conducted from differentaspects, such as subscriber, IP range, and service class,which can be configured through a web interface. Hardware-based cascade token bucket architecture and algorithms facilitate real-time traffic shaping with 1 kb/sgranularity at a multi-gigabit line speed.6. Packet mirror: To support offline traffic analysis, packetpassing through the traffic collector can be mirrored toother devices like our Traffic Collector via a cable splitter ordumped into trace files.Traffic CollectorThe Traffic Collector receives two kinds of input from thetraffic monitor via Gigabit Ethernet: flow record frames asUDP stream data and specific mirrored packets as encapsulated Ethernet frames. With these inputs, the Traffic Collectorperforms three functions: extracting flow records from flowrecord frames, generating application-layer session records,and uploading records to the Data Store.To improve the performance of processing and transmission, flow record frames produced by the traffic monitor areencapsulated in binary format at the bit level; that is, a fieldof a flow record may reside in one or multiple bits. Moreover,each flow record frame consists of 16 flow records with acommon header, which includes several common attributeslike sampling rate and link identity. This compact formathelps save the transmission bandwidth, but presents chal-34lenges for subsequent analysis tasks. To tailor the flow recordframe for Hadoop processing, the traffic collector extractsinformation from the flow record frame and translates each ofthem into 16 flow records. Each flow record consists of a fixedlength of 92 bytes of flow information, such as sample rate,timestamp, TCP/IP five-tuple, and number of packets.As network applications become increasingly complex andheterogeneous, there is an increasing need for application-oriented traffic analysis. However, most existing network trafficmonitoring systems just capture and store raw packets. Thecomplex application-layer operations like HTTP sessionreassembly are left to back-end analysis. This leads toincreased analysis complexity and reduced performance dueto excessive packet copies between the traffic probe and theanalysis subsystem. To bridge this gap, we develop a pluggablegenerator to produce application-layer session records inLength-Value (LV) binary format. It addresses the followingkey challenges:1. It can handle massive traffic data generated from multigigabit network links in real time. We use the PF RING, atechnology that can dramatically improve the packet capture speed, to achieve high-speed packet capturing.2. It supports parallel processing of packets and sessions onmulti-core machines. The record generator transparentlycreates a number of worker threads, which equal the number of allocated cores, to process packets and applicationsessions.3. It flexibly supports variable application-layer protocols. Toefficiently keep track of known and potentially growingapplication-layer protocols, the session assembling rules ofdifferent protocols are defined in configuration files, whichare loaded into memory at runtime. Multiple protocol modules can process the same packet in a shared memory toavoid unnecessary data copies and improve the overall performance. Based on this scalable and flexible architecture,the record generator can produce HTTP session records fora 10 Gb/s network line using an 8-core machine.The last function of the Traffic Collector is to transmitextracted flow records and generated application-layer sessionrecords to HDFS. The transmission task is performed by anHDFS uploader, which is an isolated Java process. Theuploader reads the buffered flow records and applicationlayer session records, and exports them to HDFS by using theHadoop stream writer. To expedite the parallel processing oftraffic data, the flow and session records are aggregated everyfive minutes and saved into HDFS.IEEE Network July/August 2014
LIU1 LAYOUT.qxp Layout 1 7/17/14 2:07 PM Page 012100 644830f12056204848i42 646g20 00cjk980d90lk9090High(a)MedLow(b)(c)Figure 3. Website community identficiation: a) example of user distribution among websites; b) example sparsified affinity graph;c) identified website communities.Data StoreIn addition to real-time capturing packets, the scalability ofstoring a huge amount of traffic data is another significantrequirement for large-scale network monitoring and analysis.To address this issue, we build a distributed data store byleveraging HDFS and HBase for managing unstructured andstructured data, respectively.HDFS, a core component of Hadoop, is designed forstoring data in low-cost hardware with scalability and faulttolerance. It provides high-throughput and reliable access topetabytes of big data on thousands of commodity machines.HDFS is well suited to process the massive network trafficdata. In our system, flow record and application-layer session record files are saved into HDFS via an HDFS streamwriter application programming interface (API). These filesare parallel processed by MapReduce programs, and someof the analysis results are written back into HDFS for presentation.Although HDFS is suitable for storing large files, its documentation oriented design does not support fast random readand write records in files. For network monitoring and analysis, this limitation is unacceptable in some cases, such assearching flow records by TCP/IP five-tuple and updating traffic counting records of a given user indexed by the user identity. That is why we take HBase as another data store moduleto manage structured data. HBase is built on top of HDFS bystoring data in indexed HDFS StoreFiles. Data stored inHBase is organized as key/value pairs in a columnar manner.It supports a flexible data model, fast access to rows indexedby the row key, and low-latency update to given records withina large data set.ed flow records and application-layer session records provide us an opportunity to investigate some data miningalgorithms for extracting application layer information andstudy the traffic characteristics from the application perspective.3. Web service provider analysis. We investigate web trafficover cellular data networks from the service providerperspective, which plays a critical role in the mobileInternet.4. User behavior analysis. Improving user experience is theultimate goal of network operators, and thus it is critical tounderstand user behavior and mobile service usage. Therefore, we characterize and model the traffic from the perspectives of the mobile client and the end user.Result Presentation InterfacesTo present the analysis results in a flexible and user-friendlymanner, we provide three kinds of interfaces: command line,Pig Latin scripting, and web graphic user interfaces (GUIs).Experienced developers who are familiar with Hadoop canuse Hadoop commands to access results stored in HDFS files.If they want to investigate results from MapReduce programsrunning in different conditions, they can execute the programsby command line with various parameters. For analysts with acertain degree of scripting skills, they can explore the data byPig Latin scripting with built-in functions and extended userdefined functions, thus simplifying application development inthe MapReduce framework by high-level data processing taskabstractions. The last presentation interface is a web GUI forease of viewing, comparing, and analyzing a data set with various interactive options.Analysis ProgramsCluster ManagerTo analyze the captured massive traffic data, we develop a setof programs based on the powerful MapReduce programmingmodel. Each MapReduce program consists of a set of jobscomposed by distributed Map and Reduce tasks. These taskstake a number of key/value pairs as inputs and produce otherkey/value pairs by user defined logics.The developed MapReduce programs analyze traffic datafrom four aspects:1. Network traffic statistics. We compute the traffic statistics interms of byte, packet, and flow number according to different grouping indices, such as IP addresses, transport-layerprotocols, and TCP/IP five-tuple.2. Application-layer analysis. The traditional network-layerand transport-layer traffic analysis cannot keep pace withthe growing emerging networked applications. The generat-Surveillance of Hadoop nodes to keep track of cluster healthand maintain fault alert is critical to deploying Hadoop components into the production environment for running missioncritical applications. Although there are a number ofexperimental tools for Hadoop cluster management likeApache Ambari, providing an easy-to-use integrated Hadoopmanagement system is still an open issue. We develop a toolnamed ZooManager based on two open source tools, Gangliaand Nagios, to ease the most important management task,Hadoop cluster monitoring. Ganglia can collect and aggregateperformance metrics of servers such as CPU, memory, anddisk and network utilization. We extend Hadoop’s built-inplugins to publish performance metrics of Hadoop components like NameNode and DataNode to a Ganglia daemon.Based on these metrics of individual components, we defineIEEE Network July/August 201435
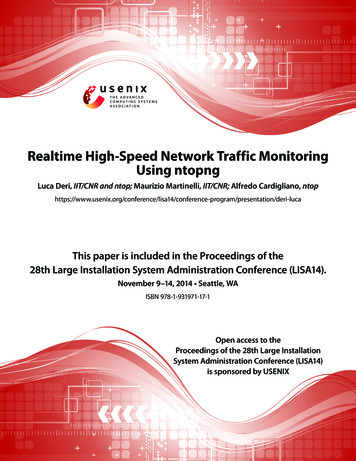
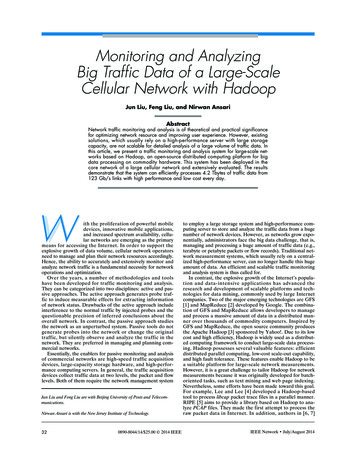
LIU1 LAYOUT.qxp Layout 1 7/17/14 2:07 PM Page 36MetricValueLink speed12*10G POS 3*GE Average traffic rate24.5 Gb/sMax traffic rate50 Gb/s Bytes of flow record frame per day875 GbytesNumber of flow records per day13.3 billionNumber of HTTP records per day17.3 billionSize of HDFS files per day4.2 TbytesAccuracy of traffic statistics100%Accuracy of HTTP session records100%Average CPU Util of traffic collector40.6%Average Mem Util of traffic collector21.9%Average time for uploading 5 minrecords98 sMax time for uploading 5 min records290 s (10 PM)MapReduce jobs per day18Computing time per day11 h 15 minCost of per gigabyte link speed 201.2Table 1. Overview of workload and performance.several aggregated indicators to represent the overall status ofthe whole cluster and display them as time series via the webGUI. In addition, key metrics and indicators are fed intoNagios to produce real-time alerts to administrators via emailsand SMS.Traffic Analysis AlgorithmsApplication-Layer AnalysisMining the logs of HTTP, the most widely used applicationlayer protocol, is an effective way for service providers tounderstand user behavior and interests. For modern websites,a click usually triggers a number of HTTP requests for downloading embedded objects. Therefore, identifying clicks froma large number of captured HTTP requests is the prerequisitefor web usage mining. However, the prevalent parallel webbrowsing behavior caused by multi-tab web browsers, shownby an example in Fig. 2a, presents great challenges to clicksidentification. Hence, we propose a novel click identificationalgorithm based on dependency graph.We model the complex browsing behavior as a dependency graph, which is a directed and weighted graph G (O, S,E, W). Each node o i in the graph represents a web objectidentified by a URL. We divide the request sequence ofeach user into a number of sub-sequences. The rule of36dividing the sequence is to make the interval between thefirst request in a sub-sequence and the last request in theprevious sub-sequence bigger than t, called lookahead timewindow. Then we can construct a set of edges E pointingfrom the first node to other nodes in each sub-sequence.The weight w(o i , o j ) of the edge e(o i , o j ) is the occurrencecount of the pair o i , o j appearing in all sub-sequences.Figure 2b shows the dependence graph derived from thebrowsing behavior example shown in Fig. 2a. For each nodein the dependence graph, we define a dependence probability, which is the value of the weighted in-degree divided bythe occurrence count of this node. We can determinewhether a request is a click by comparing the dependenceprobability with a threshold, which is self-learned from thegraph structure.The algorithm is implemented as a MapReduce programexecuted on the cluster once every day for HTTP data preprocessing. It outputs URLs marked as click or non-click andtheir relationships into HBase for further web usage mining.Web Service Provider AnalysisA website community structure is an essential means todescribe the relationships among websites. Although there area number of solutions for identifying website communitiesbased on hyperlink structure [9] and content similarity measurement [10], the relationships between user behaviors andcommunity structures are far from being understood.We develop a three-step algorithm: measuring affinity,sparsifying a graph, and identifying communities, to extractcommunities by affinity measurement derived from useraccess information [12]. Formally, we model the mobileInternet websites as an affinity graph G (O, E, W), whereO is the set of nodes representing websites and E is the setof directed edges with weights W denoting the affinity relationships between websites. The affinity weight from oi to ojis derived by dividing the number of common users betweenthem by the total number of users of oi. To reduce the computational workload and improve identification quality, theoriginal dense affinity graph is transformed into a directedand unweighted G (O, E ) called a sparsified affinitygraph. The structure of G is determined by a rule of satisfying a scale-free fitting index fit, which is computed by thei to be largerfrequency distribution of node in-degree d inthan a threshold t. Figure 3a shows an example of user distribution among websites. Nodes from a to l represent 12websites. The number in bold close to each node is thenumber of users accessing this website. The number in italicclose to each dashed line between two nodes is the numberof common users of the two websites. This example can betransformed into a sparsified graph with t 0.69, as shownin Fig. 3b. After generating the sparsified affinity graph, theaffinity rate from node oj to oi is defined as the value of thenumber of users accessing website o j divided by the outdegree of oj if there is an edge from oj to oi. Then the influence score inso i of node (o i) can be calculated by summingthe affinity rates affr(oj, oi) of all neighbor nodes oj aroundo i in the sparsified affinity graph. At last, all nodes areranked by the influence score, and the top-k scorers areselected as the seed set R. Each node oi in R and the set ofnodes o j having a directed edge from o j to o i in the sparsified affinity graph G are grouped together as the ith community Ci.A MapReduce program is implemented based on this algorithm with several parameters to be set by operators, such asscale-free index threshold t and the number of top communities to be produced k. The identified website communities arepresented to data analysts as graphs by a GUI tool.IEEE Network July/August 2014
LIU1 LAYOUT.qxp Layout 1 7/17/14 2:07 PM Page 37WebsiteUser Behavior 940.910.970.920.850.930.92With the high penetration rate of cellular devices and increasing number ofDC0.280.270.330.330.190.290.28fancy mobile applications, cellularsohu.comdevices are becoming indispensable toDG0.960.890.950.790.900.900.90our daily lives; a cellular device and itsusage data can thus be regarded as theDC0.340.370.380.290.350.330.34natural extension of an individual [13].ifeng.comTherefore, mobile operators are interDG0.850.730.880.790.770.890.82ested in knowing the attributes of cellular devices including models, prices,Table 2. F1 scores of click identification results.and features, and understanding related user behaviors. As the first step toaddress this challenge, it is imperativeis linearly proportional to the size of a data set to be uploadto extract the model information of cellular devices to detered. The average CPU and memory utilization of the trafficmine features and device prices. Therefore, we design a novelcollector are 19.9 and 21.9 percent, respectively. The trafficJaccard-based learning method to recognize cellular devicegenerates 4.2 Tbyte HDFS files every day. They are promodels to help the operator build a model database. Thecessed by 18 MapReduce jobs that require 11 h and 15 minmain idea is to identify an appropriate keyword that repreto complete all analysis works. The performance result andsents a cellular device model from unformatted textual headthe cost per gigabyte link speed of 201.2 have substantiateders of HTTP requests in three steps:the high performance and cost efficiency of the Hadoop1. Extract all keywords pertaining to the description of abased solution.device model.2. Filter candidate keywords by evaluating the conditionalUser Click Identificationprobability value between each keyword and device model.3. Calculate the Jaccard coefficient index using statisticalWe measured the accuracy of our proposed user click identifiinformation, and select the keyword with the highest Jaccation algorithm by F1 score, which considers both the precicard index to represent the device model.sion p and the recall r as F1 2 p r/(p r) [14]. F1To handle billions of HTTP records, we implement the proscores of the identification results of three well-known webposed method as a MapReduce program running on the clussites in China are shown in Table 2. The results show that ourter. Recognized results and related information are stored inmethod (DG) achieves higher accuracy than the widely usedHBase for further analysis.data cleaning (DC)-based method [15].Experimental ResultsSystem EvaluationTo evaluate the accuracy and performance of the proposedsystem, we constructed a cluster with only six servers at themost economical cost and deployed it in a commercial cellularnetwork of a leading mobile operator in China. All machinesare connected by 1 Gb/s Ethernet lines and configured withtwo 8-core 2.4 GHz Intel Xeon processors. Memory and harddisks of the NameNode and two traffic collectors are configured with 16 Gbytes and 4 2 Tbytes, respectively. ThreeDataNodes are configured with 16 Gbytes of memory and 8 2 Tbyte hard disks. The software environment of all nodesemploys Linux CentOS 6.4, the 64-bit version, and Hadoop1.0.4 with a block size of 64 Mbytes and replication parameterof two. Table 1 shows the overall workload and performancein this environment.Before the deployment, we use a high-speed packet simulator to generate massive traffic for each traffic monitor to testthe monitoring and analysis functions. From 100 Mb/s to 1Gb/s generating speed, we examined the accuracy by comparing logs of the simulator and records in HDFS, and observed100 percent accuracy for traffic statistics and HTTP sessionrecord generation.Then the cluster is deployed into the production environment which covers 12 10G POS and 3*Gigabit Ethernetports in the core network of a 2G/3G cellular network. Theaverage and maximum traffic rates going through these linksare 24.5 Gb/s and 50 Gb/s, respectively. Each link is a
Network traffic monitoring and analysis is of theoretical and practical significance for optimizing network resource and improving user experience. However, existing . traffic monitor via Gigabit Ethernet: flow record frames as UDP stream data and specific mirrored packets as encapsulat-ed Ethernet frames. With these inputs, the Traffic Collector