Transcription
2015 SPE Membership Salary SurveyHIGHLIGHT REPORTSPE Research speresearch@spe.org
2015 SPE Membership Salary Survey Highlight ReportOn 29 July 2015, Society of Petroleum Engineers (SPE) sent invitations to 89,102 professional members to participate in the annual SPEMembership Salary Survey by completing an online survey. By the close of the survey on 26 August 2015, 5,553 members responded, of which4,340 provided valid compensation data, resulting in a 6.2% response rate. This sample of completed responses produces a margin of error of 1.27% at a 95% confidence level. Salary information and other data in the report are entirely self-reported.Participants in the 2015 SPE Membership Salary Survey are based in 87 countries and 37 US states. More than three-fourths (77.2%) are citizens ofthe countries in which they work. Their employers’ headquarters are based in 79 countries. Approximately 49.0% of the respondents are based incountries outside of the United States. The percentage of female participants remained the same in 2015 (13.3%) as in 2014, compared with 12.2%in 2013, 11.3% in 2012, and 9.6% in 2011.Respondents were asked to provide their work status in 2015. The majority (95.6%) of respondents indicated that they are full-time, regular payrollemployees. About 2.4% are contract, freelance, or part-time employees, and about 1.7% are self-employed or business owners.One-fifth (20.2%) of participants in this year’s survey are primarily engaged in Reservoir Engineering, while 11.2% specialize in Production andOperations, and another 10.9% are involved in Drilling.Nearly one-third (31.3%) of respondents work for an independent oil and gas company, while one-fourth (26.7%) are employed by a service ormanufacturing company, one-fifth (20.6%) are employed by an integrated oil and gas company, and almost one-tenth (8.3%) work for a national oiland gas company.
General FindingsAll compensation data presented in this Highlight Report is expressed in US dollars (USD). Data collected in local currencies has been converted toUS dollars using the exchange rate as of 26 August 2015, which is the effective date of this year’s data.Any table figures in bold text have a base size of 30 or more respondents and the data is more likely to be statistically significant.Petroleum industry professionals reported an average calculated total compensation of USD 206,020 in 2015, lower than reported in 2014 (USD214,328), and similar to compensation reported in 2013 (USD 203,557).Although 2015 reported compensation is lower than in 2014, more than half (58.5%) of this year’s respondents indicated their base pay increasedfrom 2014 to 2015. However, this is a significantly smaller percentage than the 82.2% who reported an increase from 2013 to 2014. Those whoexperienced a gain in base pay saw their pay increase by an average of 8.0% over the past year. For respondents whose base pay decreased, thedecline was by an average of 18.4% since 2014.Calculated mean base pay reported in 2015 (USD 153,492) was down compared with 2014 (USD 156,439) and similar to 2013 (USD 153,620). Othercompensation (including bonuses) has been declining since 2013 (USD 64,000). This year, members reported an average of USD 52,931 in othercompensation; the average in 2014 was USD 57,889.The number of professionals receiving a car allowance has also continued to decline. One-fourth (26.3%) of the respondents receive a carallowance, which is down from 28.4% in 2014 and 31.0% in 2013.The average age of energy and petroleum professionals reported in the survey is 43 years, which is consistent with the previous four years.However, this varies by gender; males’ average age of 44 is slightly higher than the overall average and significantly higher than females’ averageage of 37.The level of experience professionals have in the industry remains consistent this year with previous years, with the average at 18 years. Likely as aresult of varied average age, experience also varies by gender with male professionals having significantly more experience than females. Theaverage years of experience for males in 2015 is 18.9, similar to 2014 at 18.8, and females is 11.8, up from 11.1 in 2014.The number of professionals who reported an education level higher than a bachelor’s degree (44.2%) this year is comparable to 2014 (43.2%).More than three-fourths (76.6%) of industry professionals indicated that they are citizens of the countries in which they work in 2015.2015 SPE Membership Salary Survey 2
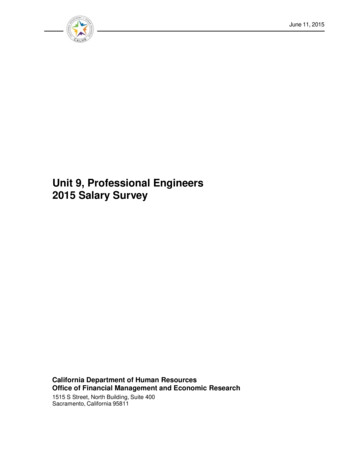
Figure 1Summary of Results by Work Region (All compensation data is expressed in US dollars)Africa(n 121)Oceania,Australia,and NewZealand(n 172)Canada(n 340)MiddleEast(n 233)North Seaand NorthAtlantic(n 590)NorthernandCentralAsia (n 77)SouthAmerica,Caribbean,and Mexico(n 308)South,Central, andEasternEurope(n 107)SoutheastAsia(n 235) 177,675 154,178 180,373 110,124 151,640 139,270 104,704 93,491 116,583 110,349 138,365 165,000 132,650 143,640 98,504 123,398 120,900 52,800 70,400 90,654 81,145Mean 52,931 69,218 93,197 36,217 36,220 41,335 32,960 42,083 21,561 33,056 25,977Median 23,040 36,000 13,500 15,120 19,000 18,324 14,301 3,000 4,780 6,564 8,400Mean 206,020 246,518 246,572 216,377 145,908 192,975 172,058 146,787 114,540 149,639 135,761Median 167,120 205,000 153,768 163,780 118,940 153,500 141,050 64,000 80,000 108,920 85,800Average Base Pay % .8%% With Car 62.4%84.6%32.9%65.4%68.0%76.3%62.7%56.1%Total(n 4,477)United Statesof America(n 2,290)Mean 153,492MedianBase PayOther CompensationTotal CompensationAverage AgeAverage Years of Experience% With Education BeyondBachelor's Degree% Citizens of Work Region2015 SPE Membership Salary Survey 3
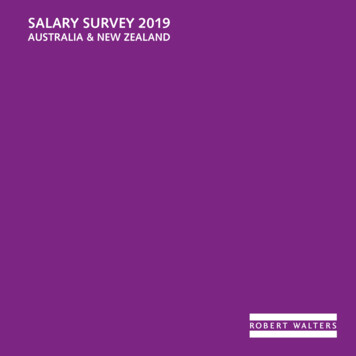
Figure 2Base Pay and Other Compensation by Work Region (USD) 300,000 250,000 36,217 33,056 151,640 42,083 25,977 21,561 110,349 36,220 110,124 180,373 154,178 177,675 50,000 153,492 100,000 32,960 116,583 41,335 150,000 93,491 52,931 104,704 93,197 139,270 69,218 200,000 0TotalUnitedStates ofAmericaAfricaOceania,Australia,and NewZealandAverage Base (USD)Canada Middle East North Sea NorthernSouthSouth,and North and Central America, Central,AtlanticAsiaCaribbean,andand Mexico EasternEuropeSoutheastAsiaAverage Other Compensation (USD)2015 SPE Membership Salary Survey 4
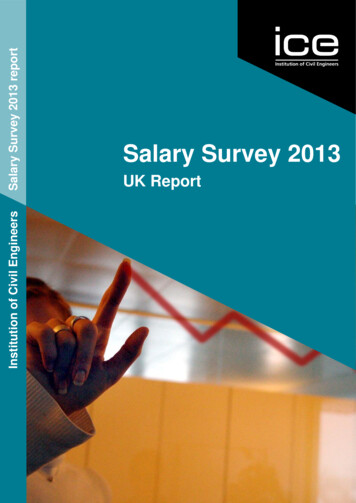
Figure 3Job Categories and Total CompensationThe mean total compensation among the top tier of professionals declined from 2014, but this was not seen across all regions. The most markeddeclines are from the United States of America, Canada, and the North Sea and North Atlantic regions. Lower category professionals were able tomaintain their level of compensation.Africa(n 121)Oceania,Australia,and NewZealand(n 172)Canada(n 340)MiddleEast(n 233)North Seaand NorthAtlantic(n 590)NorthernandCentralAsia (n 77)SouthAmerica,Caribbean,and Mexico(n 308)South,Central, andEasternEurope(n 107)SoutheastAsia(n 235)GlobalMean 429,052 560,000 585,675 252,973 328,217 290,001 430,487 380,400 648,033 113,186 391,947Manager/Director 298,088 404,985 269,188 198,558 239,882 244,233 185,000 191,170 172,335 199,932 268,936Supervisor/Superintendent/Lead 237,784 177,866 209,315 153,447 195,937 182,228 162,454 121,614 150,800 160,771 194,591Professional/Individual Contributor 201,605 185,342 160,294 118,673 166,079 129,759 110,952 74,617 104,388 99,378 165,750Technician/Specialist/Support Staff 154,651 105,596 71,904 130,896 180,709 108,865 55,198 95,504 92,483 55,191 122,611Total Compensation by JobCategory and Work RegionUnitedStates ofAmerica(n 2,290)Executive/Top Management2015 SPE Membership Salary Survey 5
Figure 4Job Function and Work RegionBase Pay by Job Function and Work RegionUnitedStates ofAmerica(n 2,290)Africa(n 121)College/University/Academic 147,346Computer or Information TechnologyOceania,Australia,and NewZealand(n 172)Canada(n 340)North Seaand NorthAtlantic(n 590) 78,210 116,787 135,069 87,620 148,735 200,000 95,135 96,960 90,775 51,220 77,490Earth Science/Geology 187,140 123,596 166,840 107,344 190,619 138,907 132,260Engineering – Chemical/Chemistry 151,217 113,615 83,547 130,413 131,408 30,750Engineering – Civil/Construction/Facilities 175,940 107,517 207,128 106,096 114,280 153,732 70,560Engineering – Completions 177,619 157,458 129,247 104,076 147,725 162,554 101,760Engineering – Drilling 190,711 185,460 180,834 118,570 148,395 142,188 142,375Engineering – Health/Safety/Environment 165,266 97,248 112,912 88,616 101,010 120,873Engineering – Production 170,144 159,383 206,692 100,969 145,799 133,619 93,637Engineering – Reservoir 189,605 169,170 146,650 113,488 141,276 154,291 101,791 85,798Engineering – Other or Combination of Above 187,617 190,961 157,464 118,368 200,989 129,883 152,085 84,238Finance or Administration 198,924 146,657 187,200 128,620 184,733 41,600 75,581Geophysics/Petrophysics/Physics 180,094 78,059 161,620 138,510 122,810 129,265 81,100 93,508Non-Engineering Technical 144,969 87,500 115,200 74,290 84,619 102,548Professional Training 161,939Research 148,162 75,500 82,176 90,725 250,248 104,865 24,000Sales or Marketing 146,955 129,393 123,600 105,817 140,544 131,531Other or Combination of Above 184,678 208,656 421,714 129,976 199,297 157,781 106,400NorthernandCentralAsia (n 77)SouthAmerica,Caribbean,and Mexico(n 308)MiddleEast(n 233)South,Central, andEasternEurope(n 107)SoutheastAsia(n 235)GlobalMean 21,840 115,170 58,580 34,560 117,415 90,175 124,152 140,407 154,265 60,229 54,317 145,561 129,228 61,443 34,916 146,194 145,679 119,840 125,880 116,153 159,223 126,974 208,271 145,892 166,371 34,600 155,626 119,233 135,375 79,976 96,752 86,445 143,938 91,933 90,692 157,055 165,611 121,449 162,155 200,837 181,571 175,454 169,360 92,669 144,041 56,486 75,144 118,110 58,380 116,177 45,000 123,217 64,467 84,414 121,701 114,366 135,463 178,339 149,626 77,526 147,736 183,695 36,933 96,300 115,000 138,8502015 SPE Membership Salary Survey 6
Figure 5The Impact of Gender – Experience Level and CompensationBase pay and total compensation varies by gender, with male professionals earning more than their female counterparts. This disparity can beattributed in part to male professionals having more reported experience than females, on average.Compensation by Gender and rt tributorTechnician/Specialist/Support StaffAverage Yearsof Experience2120149123024191516Number ofRecords156484351502698526571,750149Average BasePay (USD) 161,129 163,239 125,878 109,989 88,788 257,057 192,212 156,217 134,828 104,592Average OtherCompensation(USD) 26,015 45,321 33,072 25,269 13,952 147,647 82,866 44,608 38,440 25,275Average TotalCompensation(USD) 187,143 207,852 158,556 135,114 102,740 404,155 274,787 200,757 173,049 129,8682015 SPE Membership Salary Survey 7
Figure 6The Impact of Gender – Base Pay Increase and DecreaseThe majority of professionals of both genders experienced an increase in their salary since 2014. However, the number of respondents reporting anincrease has declined significantly since 2014 (81.2% in 2014 compared to 58.4% in 2015 among male respondents). Those reporting no change or adecrease has risen, with 7.0% of males now reporting a decrease compared with only 1.7% in 2014, while those reporting no change has risen from17.1% in 2014 to 34.6% in 2015. Female professionals were more likely to experience positive salary growth than their male counterparts and werealso less likely to experience a decrease.Respondents' Change in Salary Since July 2014 by %20%10%7.0%4.6%0%IncreaseNo ChangeDecrease2015 SPE Membership Salary Survey 8
Figure 7Change in Base Pay by RegionOverall, 6.6% of respondents’ base pay went down and 58.5% received an increase in 2015. An even higher percentage (64.4%) of respondents inthe South America, Caribbean, and Mexico region received a base pay increase. This could, at least in part, be attributed to the currencydevaluation in Venezuela.Base RegionDecrease in Base PayNo change in Base PayIncrease in Base PayUnited States of America5.1%34.3%60.6%Africa7.8%36.2%56.0%Oceania, Australia, and New Zealand10.0%43.5%46.5%Canada10.8%37.3%51.8%Middle East10.1%27.6%62.3%North Sea and North Atlantic5.1%37.8%57.1%Northern and Central Asia22.7%33.3%44.0%Southeast Asia3.5%35.7%60.9%South America, Caribbean, and Mexico8.8%26.8%64.4%South, Central, and Eastern Europe7.8%44.1%48.0%2015 SPE Membership Salary Survey 9
Figure 8The South America, Caribbean, and Mexico region received the largest percentage increase of any region; besides that region, salary increaseshovered around 6%. The region of Northern and Central Asia had both the largest percentage of respondents who received a decrease in their basepay (22.7%—see figure 6), and experienced the largest reduction in base pay (21.9%).Average Base Pay Change by Base .7%-21.9%-20.1%-20.7%-20%-30%UnitedStates ofAmericaAfricaOceania,Australia,and NewZealandCanadaMiddle East North Sea Northern SoutheastSouthSouth,and North and CentralAsiaAmerica, Central, andAtlanticAsiaCaribbean, Easternand Mexico EuropeDecreaseIncrease2015 SPE Membership Salary Survey 10
How to Learn MoreThis report represents a sample of current compensation in the industry. A detailed summary report containing charts and descriptive statistics oftrends and more information on the jobs, geographies, and employer types will be available through the SPE Bookstore at www.spe.org/store inearly November 2015.SPE will make the detailed PDF summary report available to download through the SPE Bookstore at a USD 50 member price and USD 125nonmember price.A file containing the raw data from the survey responses will be made available to download through the bookstore to provide the opportunity forindividual analysis and localization of data. Pricing for access to data for analysis will be USD 225 for SPE members and USD 425 for nonmembers,also available in early November 2015. The data file comes bundled with the detailed summary report.In addition to our annual reports, SPE publishes a historical summary of SPE Membership Salary Survey Highlights, updated each year, dating backto the first survey in 1967. The SPE Membership Salary Survey became an annual study beginning in 1984, with previous editions having beenconducted in alternate years. The archive document includes the highlights through 2015. The archive PDF document will be available through theSPE Bookstore at a price of USD 125 for SPE members and USD 325 for nonmembers.Inquiries regarding purchase may be addressed through the SPE Bookstore website. Other questions regarding the survey can be addressed tosperesearch@spe.org.Thank you for your interest in this important project and your continued support of SPE.The SPE Research Team2015 SPE Membership Salary Survey 11
Membership Salary Survey by completing an online survey. By the close of the survey on 26 August 2015, 5,553 members responded, of which 1.27% at a 95% confidence level. Salary information and other data in the report are entirely self-reported. Participants in the 2015 SPE Membership Salary Survey are based in 87 countries and 37 US states.