Transcription
TABLEAU SERVERQUICK START GUIDEOctober 2, 2015Heidi Hiemstra, PhDNeed an account? http://go.uky.edu/GetTableau(CON department code is E7100)Request a new workbook: Heidi.hiemstra@uky.eduMore training and resources: e/faculty/faculty-governance-resources/tableau
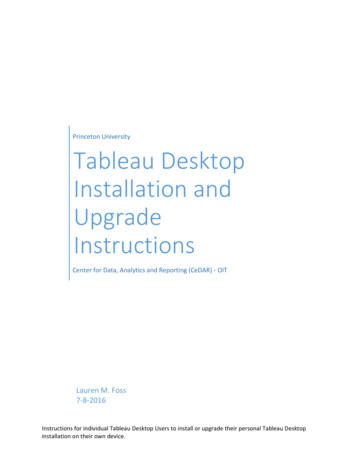
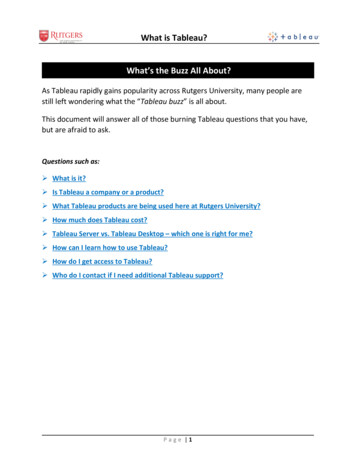
In short HANA is a repository of university data. Tableau is the primary reporting tool for HANA.Data generated by UK’s Integrated Resources Information Systems (IRIS)Student Life Cycle Management (SLCM)Financials (FI)Grants Management (GM)HR/Payroll (HR)Procurement/Materials Management (MM)Supplier Relationship Management (SRM)Plant Maintenance (PM)Are collected in a data warehouse (SAP BW)and accessed through:BW Web ReportingSome SLCM data from SAP BW hasmoved to the HANA data repository –with more to come.HANA data are then accessed through:The university is slowly migrating the reporting functions for all IRIS systems from BW Web Reporting toTableau over the next few years.9/171
Getting into Tableau1. Open any web browser and navigate tohttps://analytics.uky.edu2. Enter your windows/linkblue user name and passwordas directed. ** If you are on the medical campus (mc)domain, put an mc\ in front of your username **3. Tableau will open to the screen below. Most CONusers will have access to the four “projects” listedbelow, which function like folders in windows.“College of Nursing” contains highlevel summary reports with noidentifying student data. Thesereports can be viewed in meetingsand presentations.“CON Administration” containsdetailed reports which displayidentifying student data. Only thosewith job responsibilities requiringaccess to student-level data haveaccess.These two projects are maintained by university Advanced Analytics staff, andhave not been adapted for CON use.** USE AT YOUR OWN RISK **9/172
Navigating Projects, Workbooks and ViewsClicking on the titleof a Project opens itand displays theWorkbooks (reports)in the ProjectClicking on a Workbookopens the views (pages)inside. Some workbooksonly have one viewUse thebreadcrumbs atthe top of thepage to navigateto anotherWorkbook orProject.9/173
Finding a Workbook or View1. Use the search feature at the top of the Tableau window. You can navigate directly to one of the views orworkbooks listed, or click on “See all X views” to view thumbnails of all related views.2. Use the filters located on the right-hand side of most screens.a. Tags are keywords added to a workbook when it is published tothe server. The Tag dropdown is not very helpful because it listsall tags used across the university.3. Add a workbook or view to your favoritesa. Hover over a thumbnail to view the white star below and to theright of the thumbnailb. Click on the star to turn it orangec. The workbook or view will be availableat the favorites list the top right ofevery screen.9/174
Expporting Daata from a List Vieew (Tablee or Crossstab)A listt, graphic, dasshboard or vieew can be exported eitherr as an MS Exxcel file to maanipulate or share, or as a printable PDFFreport.11. Click on thhe export icon at the top, center of thee view.22. The exporrt menu has fourfoptions. Only the last two, Crossta b and PDFare recommmended.33. Crosstab isi useful for generatingglistts in Excel.a. Click on the “CCrosstab” option, and the ExportEDialogg box will opeen:ownload” will open the doownload dialoog box:b. Clicking on “DoOor Save thet .csvc. Openfile, which shouldopen automatically inMSM Excel. Be surestosaave it as an Exxcelworkbookwbefooremanipulatingmorofoorwarding thee list!d. Note that the ExportoCrosstab will onlyworkwon tabulaarviiews.
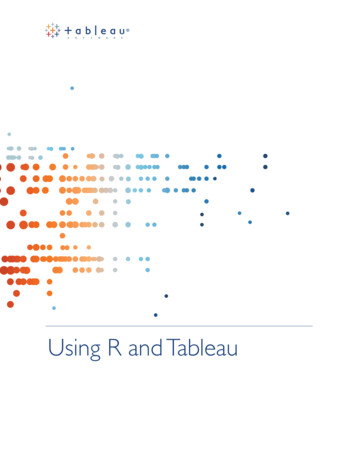
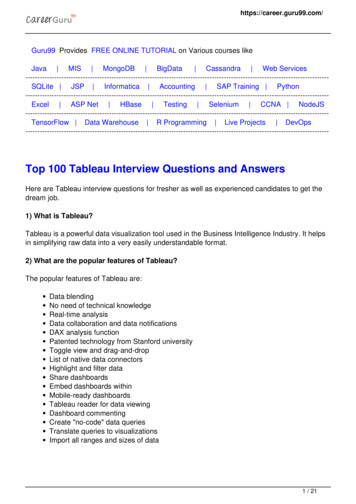
Expporting Graphical ViewsV11. To export a dashboard oro other graphhical view, select the “PDFF” optione. A “Export PDF”” dialog box willw open.b. Click on “Expport” to geneerate aPDF file for download.c. Then selectt “Download””d. You will gget the same downloaddialog boxx to open or ssave the PDF.22. There are several optionns on the firstt Export PDF dialogdbox.f.t selection of page orienntationLaayout allows theg. Paaper size deteermines the sizes of paper the graphic wwill fit onto, and how largee the PDF will print.h. Sccaling allows the graphic to be printed smaller or larrger, or to be fit automaticcally onto onee or morepiece of paperr.i.ort allows an entire dashbooard or indiviiduals sheets (views) to bee exported.Content and Sheets to Expo33. To print an attractive PDDF report fromm Tableau, exxperiment! Foor instance, tthis DEW trennds report didd not lookggood with thee Portrait orieentation, but Landscape worked well (s ee next page).
Students'DEWFailWithdraw (DEW)RatesDEW ing ntsenrolled.CON150029/177
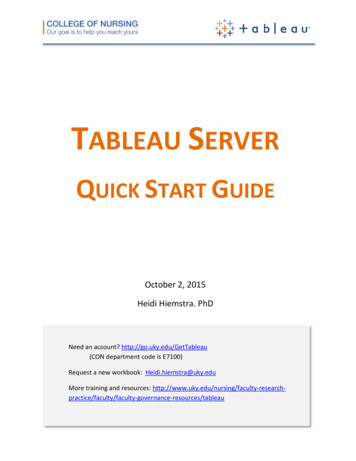
Expporting thhe Data UnderlyinUg a Graphhical ViewwWhatt if you need the detailed data behind a summary taable orgraphhic? This cann easily be expported into exxcel.11. Left click ono a cell or number that inncludes all thee casesyou want to export. A small windoww will pop upp withncluding a datta‐table icon.actions, in22. The view data windoww will open as below. This windowhas two taabs:a. Suummary – thiis tab will shoow the same summarysinnformation ass in the original view.b. Underlying – this tab will display the undderlying, detaailed data on which the report was built.33. Click on thhe Underlyingg tab, and youu will notice thattonly the fields displayyed on the summary view are included.Sometimees this is all yoou need, but you can also display the eentire underlyying data table for all studeents (units)included ini the view byy clicking the “Show all collumns” box.44. Once you have the datta you want, clickcon “Dowwnload all rowws as a text fille” and open or save it as above.55. Caution: Most Tableau reports linkk directly to HANAHtables, wwhich are verry large. Dowwnloading all columns ofthe underrlying HANA datadcan result in a very large file that ttakes a long tiime to downlload and mayy containhundreds of fields you do not want.
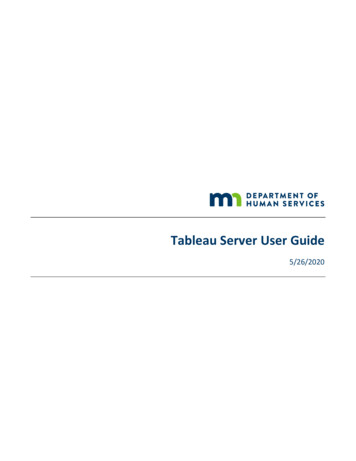
Sharing Views with Tableau UsersIt is easy to share a worksheet or view with other Tableau users.When a view or dashboard is open, there is a “Share” option at thetop left of the window.A hyperlink is then generated that can becopy and pasted into an email or document.The embedded html option is notrecommended for public-facing websites, asreports on Tableau Server are not publicallyaccessible. Access to Tableau Server isrestricted to authorized users, so most webvisitors will dead-end at a login screen theycan’t use.9/178
Feb 15, 2010 · Tableau, ex Landscape w lect the “PDF ialog box. tation the graphic w smaller or lar entire dashbo periment! Fo orked well (s ” option b. c. ill fit onto, a ger, or to be ard or indivi or instance, t ee next page Click on “Exp P