Transcription
Importance OfAccelerated Stability StudyAccelerated stability testing All medicinal products decompose with time. Paradoxically, when thisdecomposition is being assessed the skilled formulator becomes a victim of his ownexpertise, as a good formulation will take a long time to decompose. Instability in modern formulations is often detectable only after considerable storageperiods under normal conditions. To assess the stability of a formulated product it is usual to expose it to “high stress”,i.e. condition of temperature, humidity and light intensity that cause break down. High stress conditions enhance the deterioration of the product and so reduce thetime required for testing. Thus these are the studies designed to increase the rate of chemical degradationand physical change of a drug by using exaggerated storage conditions as part ofthe formal stability testing programme. This enables more data to be gathered in shorter time, which in turn will allowunsatisfactory formulation to be eliminated early in a study and will also reduce thetime for a successful product to reach a market. It must be emphasized that extrapolation to normal storage condition must be madewith care, the formulator must be sure that such extrapolation are valid. The results of accelerated testing studies are not always predictive of physicalchanges.Significant change occurs due to accelerated testing 1.2.3.4.5.6.7.Significant change at the accelerated conditions is defined as:A 5% potency loss from the initial assay value of a batch.Any specified degradants exceeding its specified limit.The product exceeding its pH limits.Dissolution exceeding the specified limits for 12 capsules or tablets.Physical Changes under Accelerated conditions of Temperature & HumidityUnder Light, both Primary and Secondary packaging affected, and fading ofcontainer color, and the print is fading.Effervescent Tablet : Gain of moisture, loss of integrityCapsule: Color fading in Blister and Sticking in a Glass bottle.Powder : Spread within strip pocketsSuppositories : SofteningChange in Viscosity of a Gel, Jelly, Cream & OintmentLozenges : melting
8. Emulsions : Phase separationObjective1. Main aim of accelerated stability study to predict the stability profile of a drugproduct that prediction of self life of the product before launching into market.2. The rapid detection of deterioration different initial formulations of the sameproduct. This is of use in selecting the best formulation from a series of possiblechoices3. Prediction of shelf life, which is the time a product will remain satisfactory whenstored under expected or directed storage condition.4. The provision of rapid mean of quality control, which ensures that no unexpectedchange has occurred in the stored product. Good formulation will invariably break down more slowly than poor ones. When theperceived optimal formulation is decided, attempts can be made to predict its likelystability at proposed storage conditions. These may be at 250C for ambient roomtemperature (or 3000C for use in hot climates), or 0-400C for a refrigerator. The amount of decomposition that is acceptable in fixing an expiry date depends onthe particular drug. This will be small if therapeutic index is low or if thedecomposition products are toxic.Stability Profiles: Accelerated stability studyStorage ConditionTesting ConditionControlled room temperature20-250CRefrigerated condition2-80CFreezer condition-20 to -100C400C and 75% RH for 6 months250C and 60% RH for 6 months50C for 6 monthsPrediction of shelf life from accelerated stability dataBased on the principle of chemical kinetics demonstrated by Garret and Carper method Free and Blythe methodShelf Life Determination Based on Arrhenius Plot (Garret and Carper method) The mathematical prediction of shelf life is based on the application of thearrhenious equation, which indicates the effect of temperature on the rateconstant, k, of a chemical reaction of thermodynamic temperature, 1/T, is astraight line.
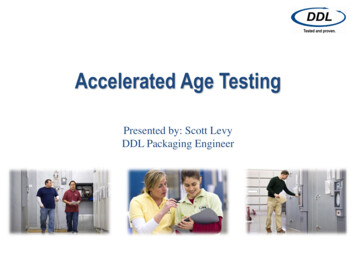
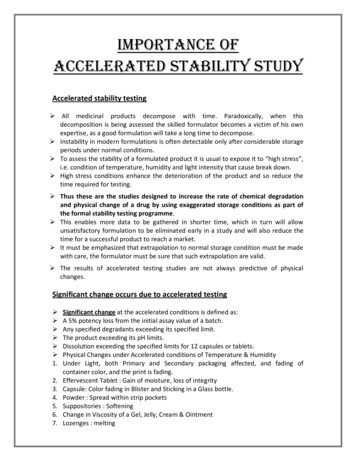
If the slope of this line is determined from the results of temperature byextrapolation, the k value obtained. And this k value is substituted in appropriateorder of reaction allows the amount of decomposition after a given time.Preliminary experiments are there for necessary to determine this order. K Ae-Ea/RTLog K Log A - Ea/2.303*RTWhere, K rate constantR gas constant 1.987 cal/moleT absolute temperatureA frequency factorEa energy of activationT10% (2.303/K)*(log100/90)T90% (2.303/K)*(log100/10)Garret and Carper method)1. Keep several samples of the drug product at atleast three temperatures, such as 40oC,50 oC and 60 oC.2. Determine the drug content at all three storage points by taking a number ofsamples and take the mean drug content. We do this for a few weeks.3. At each temperature we plot a graph between time and log percent drug remaining.If the decomposition is first order this gives a straight line. If it is zero order, percentdrug remaining versus time will give a straight line.4. Next we take the log K or log of reaction constant on Y axis and 1/T x 10-3 on X axisand draw a best fit line. This line is the Arrhenius Plot, extrapolate this line to get k at 25oC and from this we calculate the shelf-life.Arrheniusplotforpredicting drug stabilityat room temp.
If the reaction is following zero-orderExpiration date at 25 oC Initial potency – minimum potency / reaction rate at 25 Ctx Yo - Yx/ Ko If the reaction is following first orderExpiration date at 25 oC (tx) Log initial potency – log minimum potency/reaction rateat 25tx log Yo – log Yx / K1Where Yo initial potencyYx final potencyKo zero order constantK1 first order constant Limitation of arrhenious relationship for stability prediction: There are varieties of situation in which arrhenious equation can be erroneous orinvalid. Higher temperature may evaporate solvents thus producing unequal moistureconcentration at different temperature. At higher temperature stability for drugs sensitive to the presence of moisture andoxygen. For dispersive systems viscosity decrease as a temperature increases and physicalcharacteristic may alter and resulting in potentially large errors in predicting ofstability. In spite of these difficulties the application of accelerated testing to pharmaceuticalproduct is often useful, and predicted shelf lives are sufficiently accurate.SHELF LIFE DETERMINATION Based on t90 values (Free and Blythe /method)In this method the fraction life period is plotted against a reciprocal temp. and the timein days required for drug to decompose to some fraction of its original potency at roomtemp. this approach clearly illustrate in below fig.
the log% of drug remaining is plotted against time and days and the time for the lossline at several temp. to reach 90% of the theoretical potency is noted by the doted line.Shelf life and expiration date are estimated in this way.The log time to 90% is then plotted against 1/T and the time for 10% loss of potency atroom temp. can be obtain from the resulting straight line by extrapolation to 25 0CLimitation of accelerated stability studies Accelerated stability studies are valid only when the breakdown depends ontemperature. Accelerated stability studies are valid only the energy of activation is about 10 to 30kcal / mol. In solution phase most reaction has heat of activation in the range of 10to 30 k.cal / mole. if energy of activation is less than 10 kcal / mol its rate would befast at room temperature .in such cases elevated temperature has little influence onthe decomposition .if energy of activation is higher than 30 kcal / mol very hightemperature are required to enhance the degradation . Reaction at such hightemperature may not have any relevance, because they do not reflect ambientstorage condition. The result obtained for one set of condition for a preparation cannot be applied toother preparation of same drug. Stability prediction at elevated temperature is of little use when degradation is dueto diffusion, microbial contamination, and photo-chemical reaction. Stability studies are meaningless when the product looses its physical integrity athigher temperature like coagulation of suspending agent, denaturation of proteins. Prediction will become erroneous when the order changes at elevatedtemperatures, as in case of suspension (zero order) which at higher temperature getconverted to solution which follow 1st order.
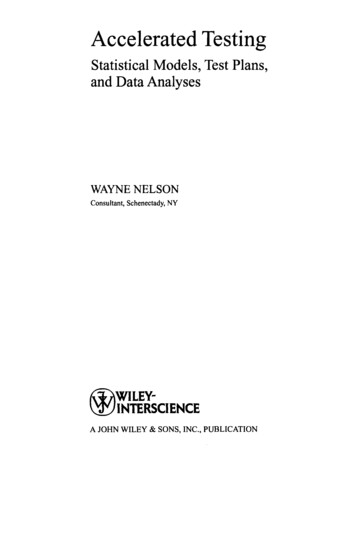
SHELF LIFE DETERMINATION BASED ON REAL TIME TESTINGAnother method which involves real time testing and statistical analysis, followed fordetermining shelf life.1. Keep three batches for stability study at least for 1 year at one fixed temperature.2. Test them at 0, 1, 3, 6, 9, and 12 months for drug content. At each testing time test anumber of samples, so that you have a mean and a standard deviation value of theresult.3. Now plot the graph of % drug content on Y axis and time on X axis along withconfidence intervals. Where the lower 95% confidence curve intersects minimumpotency, there you fix the shelf life.As an example we can see the data and figure given in Tablets, Volume 3, by Hebet ALieberman and Leon Lachmann.Vitamin Tablets Stability Confidence Intervals at 40oCFig: Plot of In potency against time showing 95% confidence limit lineTable: Vitamin Tablets Stability Confidence Intervals at 40 .882.5969.161.278.21263.053.674.0
Where estimate of the standard error of regression(s)y1 predicted value at t1n sample sizeSy standard error of the lineα 0.1 two-sided0.05 One-sidedThis method also helps formulation scientists in fixing the amount of overages to beadded to vitamin products.Q10 method for Shelf life estimation.Q10 approach taken by Simonelli & DresbackQ10 is the factor by which the rate constant increases for a 100C temp. increase.It is the ratio of two different reaction rate constants.Commonly used Q values OF 2, 3 & 4 relate to the energy of activation of reaction fortemperature for room temperature (25 C)For an Arbitrary temp. change TAs is evident from this relationship, an increase in T will decrease the shelf life and adecrease in T will increase shelf life.
Scientists has found out thatActivation energy (Ea) of all chemical decomposition reaction usually fall in the range12 to 24 Kcal/mol.With a typical value of 19 to 20 Kcal/mol.Ea ( K cal/mol. )Q10 ( 300 to 200C)12.22.019.43.024.54.0Q10 4 provides the higher estimate for the increase in rate with increasing temp.,where asQ10 2 provides the lower estimate for the decrease in rate with decreasing temp.Q10 4 will estimate the maximum likely decrease in shelf life with increasing temp. andQ10 2 will provide the most conservative estimate of the increase in shelf life withdecreasing temp.The value Q10 3 gives our most likely estimate. T T2-T1,T2 T1 TWhere,
t90 (T2) is the estimated shelf life,t90 (T1) is the given shelf life at given temp., and T is the difference in the temp. T1 and T2Note : the estimate of t90(T2) is independent of the reaction order.Example:An antibiotic solution has a shelf life of 48 hrs. in the refrigerator (5 0C). What is itsestimated shelf life at room temp.(250C)?using a Q10 value of 3.Importance of Q10 method in shelf life estimationIt solves many problems like one t90 (T1) is the given shelf life at given temp., todetermine the shelf life at another temp. t90 (T2).Some specific examples are. The expiration date is given for room temp. What is the expected extension ofthe shelf life in a refrigerator? The expiration date is given for refrigeration condition. How long the productmay be left at room temp.? The expiration date is given for room temp. And it is desired to heat the product,what percent decomposition can be expected at higher temp.? The expiration date is given for refrigeration condition; the product is stored fora period of time at room temp. And is then returned to the refrigerator. Whatwill be the corrected expiration date?OveragesThe excess quantity of drug that must be added to the preparation to maintain at least100% of labeled amount during the expected self life of drug can be easily calculatedand added to the preparation at the time of manufacture.The international pharmaceutical federation has recommended that overage belimited to a maximum of 30% over the labeled potency of an ingredient. While addingover-age safety and toxicity should also be considered.
By convention overage to the of 10 % of excess dose of drug is added to theproduct at the time of manufacture. This is to ensure that the product contain 100 %labeled amount during the shelf life period. In other word at the end of one shelf periodthe concentration of drug of about 100 %. The same product will now take one moreshelf life period in order to decrease the drug content to 90 % of labeled amount. Thusproduct will now take twice the shelf life as an expiry date.Stress testing Stress testing to elucidate the intrinsic stability of the drug substance is part ofthe development strategy and is normally carried out under more severeconditions than those used for accelerated testing. The testing typically includes the effects of temperature (in 10oC increments(e.g. 50oC to 60oC) above that accelerated testing), humidity (e.g. 75%relativehumidity or greater) where appropriate oxidation and photolysis on the drugsubstance. Stress testing of the drug product is undertaken to assess the effect of severecondition of the products. Such studies include photo stability testing andspecific testing of the certain products.Common high stresses or challenges Temperature challengeAn increase in temperature causes an increase in the rate of chemicalreactions. The products are therefore stored at temperature higher than roomtemperature. Sample is removed at various time inter
SHELF LIFE DETERMINATION BASED ON REAL TIME TESTING Another method which involves real time testing and statistical analysis, followed for determining shelf life. 1. Keep three batches for stability study at least for 1 year at one fixed temperature. 2. Test them at 0, 1, 3, 6, 9, and 12 months for drug content. At each testing time test aFile Size: 683KBPage Count: 12