Transcription
The Use of Credit Scoring Modelsand the Importance of a CreditCultureDr. Edward I. AltmanStern School of BusinessNew York University
Evolution of Scoring Systems Qualitative (Subjective) Univariate (Accounting/Market Measures) Multivariate (Accounting/Market Measures)– Discriminant, Logit, Probit Models (Linear, Quadratic)– Non-Linear Models (e.g., RPA, NN) Discriminant and Logit Models in Use––––––Consumer Models - Fair IsaacsZ-Score (5) - ManufacturingZETA Score (7) - IndustrialsPrivate Firm Models (eg. Risk Calc (Moody’s), Z” Score)EM Score (4) - Emerging Markets, IndustrialOther - Bank Specialized Systems2
Evolution of Scoring Systems(continued) Artificial Intelligence Systems– Expert Systems– Neural Networks (eg. Credit Model (S&P), CBI (Italy)) Option/Contingent Claims Models– Risk of Ruin– KMV Credit Monitor Model Blended Ratio/Market Value Models– Moody’s Risk Cal– Bond Score (Credit Sights)– Z-Score (Market Value Model)3
Problems With Traditional Financial Ratio Analysis1 Univariate Technique1-at-a-time2 No “Bottom Line”3 Subjective Weightings4 Ambiguous5 Misleading4
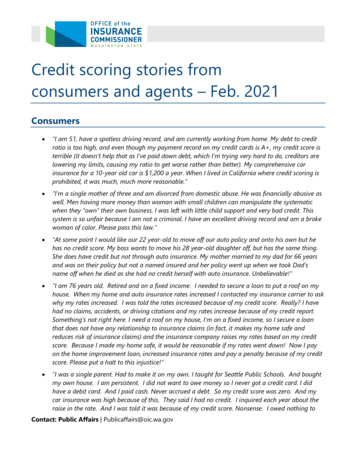
Forecasting Distress With Discriminant AnalysisLinear FormZ a1x1 a2x2 a3x3 anxnZ Discriminant Score (Z Score)a1an Discriminant Coefficients (Weights)x1xn Discriminant Variables (e.g. Ratios)ExamplexxxEBITTAxxxxxxxxxxxxxxxx xxxx xx xx xx xxxxx xx x xxEQUITY/DEBT5
“Z” Score Component DefinitionsVariableX1DefinitionWeighting FactorWorking Capital1.2Total AssetsX2Retained Earnings1.4Total AssetsX3EBIT3.3Total AssetsX4Market Value of Equity0.6Book Value of Total LiabilitiesX5SalesTotal Assets1.06
Z ScoreBankruptcy ModelZ .012X1 .014X2 .033X3 .006X4 .999X5e.g. 20.0%Z 1.2X1 1.4X2 3.3X3 .6X4 .999X5e.g. 0.20X1 Current Assets - Current LiabilitiesX4 Market Value of EquityTotal AssetsX2 Retained EarningsTotal AssetsTotal LiabilitiesX5 Sales( # of TimesTotal Assetse.g. 2.0x)X3 Earnings Before Interest and TaxesTotal Assets7
Zones of Discrimination:Original Z - Score ModelZ 2.99 - “Safe” Zone1.8 Z 2.99 - “Grey” ZoneZ 1.80 - “Distress” Zone8
Average Z-Score by S&P Bond RatingS&P 500: 1992 - 2001RatingAAA1996-2001#AverageFirms Z rageAverageZ Score SD Z Score SD Z Score SD Z Score 1.962.3390.331.16CCC CC9
Estimating Probability of Default and Probability of LossGiven Defaults Credit scores on new issues to estimate Bond ratings equivalents on new issues and then, Utilize mortality rates to estimate annual andcumulative defaults10
Marginal and CumulativeMortality Rate EquationMMR(t) Total value of defaulting debt in year (t)total value of the population at the start of the year (t)MMR Marginal Mortality RateOne can measure the cumulative mortality rate (CMR) over a specifictime period (1,2, , T years) by subtracting the product of the survivingpopulations of each of the previous years from one (1.0), that is,CMR(t) 1 - Π SR(t) ,t 1hereCMR (t) Cumulative Mortality Rate in (t),SR (t) Survival Rate in (t) , 1 - MMR (t)11
Mortality Rate Concept(Illustrative Calculation)For BB Rated IssuesSecurityNo.IssuedAmountYear 1DefaultCallSFYear mountStart ofPeriod1,5001,325- 34012345678910-175- Year 1Year 2MarginalMortalityRate50/1,500 3.3%100/1,325 7.5%Cumulative Rate3.3%1 - (SR1 x SR2 ) CMR21 - (96.7% x 92.5%) 10.55%985NE No longer in existenceSF Sinking fund12
Mortality Rates by Original RatingAll Rated Corporate Bondsa1971-20031234Years after % 2.55% 1.10% 1.65% 0.88% 1.72% 3.70%9.87% 12.17% 13.14% 14.57% 15.15% 16.61% 19.69%BMarginalCumulative3.06%3.06%6.92% 7.48% 8.58% 6.08% 4.18% 3.74% 2.31% 2.00% 0.88%9.77% 16.52% 23.69% 28.32% 31.32% 33.89% 35.41% 36.70% 37.26%CCCMarginalCumulative8.18% 15.57% 19.15% 12.18% 4.26% 10.25% 5.65% 3.15% 0.00% 4.28%8.18% 22.48% 37.32% 44.96% 47.30% 52.70% 55.37% 56.78% 56.78% 58.63%(a) Rated by S&P at IssuanceBased on 1,719 issuesSource: Standard & Poor's (New York) and Author's Compilation13
Mortality Losses by Original RatingAll Rated Corporate Bondsa1971-20031234Years after %6.78%1.40%8.08%0.75%8.78%0.99%9.68%0.28% 0.94% 1.18%9.93% 10.78% 11.83%BMarginalCumulative2.13%2.13%5.05% 5.60% 6.00% 4.56% 2.51% 2.74% 1.64% 1.10% 0.67%7.07% 12.38% 17.54% 21.30% 23.38% 25.00% 26.23% 27.04% 27.53%CCCMarginalCumulative5.48% 11.68% 15.37% 9.72% 3.20% 8.21% 4.80% 2.52% 0.00% 3.22%5.48% 16.52% 29.35% 36.22% 38.26% 43.37% 46.05% 47.41% 47.41% 49.10%(a) Rated by S&P at IssuanceBased on 1,535issuesSource: Standard & Poor's (New York) and Author's Compilation14
Classification & Prediction AccuracyZ Score (1968) Failure Model*1969-19751976-19951997-1999Year PriorTo FailureOriginalSample (33)HoldoutSample (25)PredictiveSample (86)PredictiveSample (110)PredictiveSample (120)194% (88%)96% (72%)82% (75%)85% (78%)94% g 2.67 as cutoff score (1.81 cutoff accuracy in parenthesis)15
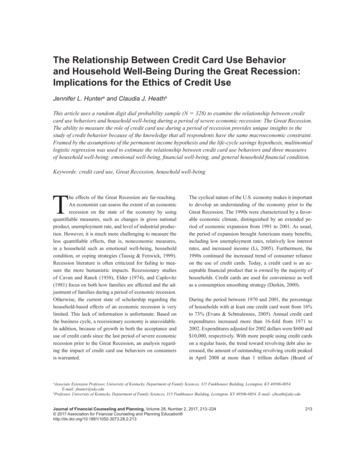
Z Score Trend - LTV Corp.Z Score3.52.99 32.51.8 21.510.50-0.5-1-1.5Safe ZoneGrey ZoneDistress Zone1980198119821983Year198419851986BankruptJuly ‘8616
Z ScoreInternational Harvester (Navistar)Z Score (1974 – 2001)3.532.521.510.50-0.5Safe ZoneGrey ZoneDistress Zone'74 '76 '78 '80 '82 '84 '86 '88 '90 '92 '94 '96 '98 '00Year17
Chrysler CorporationZ Score (1976 – 3Q 1998*)4Safe Zone3.5Z Score3Operating Co.2.5Grey Zone21.5Consolidated Co.10.5Gov’t Loan *Third quarter figures for 1998 are annualized18
Z ScoreIBM CorporationZ Score (1980 – 2001)65.554.543.532.521.510.50Operating Co.Safe ZoneJuly 1993:Downgrade AA- to AConsolidated Co.Grey ZoneBBBBBB1/93: DowngradeAAA to AA-1980 1982 1984 1986 1988 1990 1992 1994 1996 1998 2000Year19
Enron Credit Risk : A. Saunders and L. Allen, Credit Risk Measurement; J. Wiley, 200220
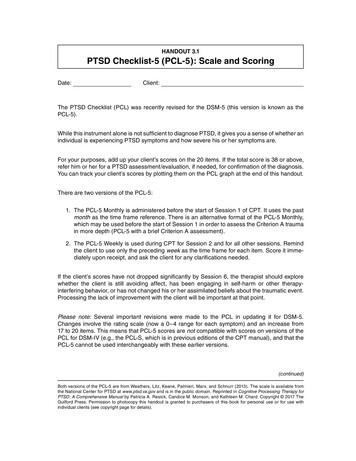
Worldcom Credit Risk MeasuresZ" SCORES AND EDF'S FOR WORLDCOM(Q4'1999 - Q1'2002)0.01AAA7.00S&P RatingA-BBBBBB6.00AABEQ*Z" Scores5.000.10BBBB-B B EDFBB1.00CCC B3.00EDF ScoreZ" arter- YearDQ2'00Q3'00Q4'00Z" UnAdjQ1'01Q2'01Z" Adj:3.85BQ3'01Q4'01Q1'02Z" Adj:7.2B&50BQ2'02100.00Q3'02EDF*BEQ Z" Score Bond Equivalent RatingSources: Compilation by the author (E. Altman, NYU Stern), the KMV(Moody's) Website and Standard & Poor's Corporation.21
Key Industrial Financial Ratios U.S.Industrial Long-term DebtThree Year (1998-2000) MediansEBIT interest coverage (x)EBITDA interest coverage (x)Funds from operations/total debt (%)Free operating cash flow/total debt (%)Pretax return on capital (%)Operating income/sales (%)Long-term debt/capital (%)Total debt/capitalization A10.112.955.425.521.722.128.237.729A BBB6.1 3.79.1 5.843.2 30.815.0 8.519.4 13.618.6 15.433.9 42.542.5 48.2136 218BB2.13.418.82.611.615.957.262.6273B CCC0.8 0.11.8 1.37.8 1.6-3.2 -12.96.6 1.011.9 11.969.7 68.874.8 87.728122Standard & Poor's, Corporate Ratings Criteria, Ratings and ratios.22
Xerox Credit Quality: Z Score Analysis 501.000.5012/98Bond Rating Equivalents:12/98 A12/99 BB06/00 B12/99Actual Rating (S&P / Moody’s):12/98 A / A212/99 A / A207/00 A- / A312/00 BBB- / Ba15/02 BB / B16/0023
Z’ ScorePrivate Firm ModelZ’ .717X1 .847X2 3.107X3 .420X4 .998X5X1 Current Assets - Current LiabilitiesTotal AssetsX2 Retained EarningsTotal AssetsX3 Earnings Before Interest and TaxesTotal AssetsX4 Book Value of EquityTotal LiabilitiesX5 SalesZ’ 2.90 - “Safe” Zone1.23 Z’ 2.90 - “Grey” ZoneZ’ 1.23 - “Distress” ZoneTotal Assets24
Z’’ Score Model for Manufacturers, Non-ManufacturerIndustrials, & Emerging Market CreditsZ’’ 6.56X1 3.26X2 6.72X3 1.05X4X1 Current Assets - Current LiabilitiesTotal AssetsX2 Retained EarningsTotal AssetsX3 Earnings Before Interest and TaxesTotal AssetsX4 Book Value of EquityTotal LiabilitiesZ’’ 2.60 - “Safe” Zone1.1 Z’’ 2.60 - “Grey” ZoneZ ” 1.1 - “Distress” Zone25
AN EMERGING MARKETCORPORATE MODEL
US Bond Rating Equivalent Based on Adjusted Z” Score ModelZ” 3.25 6.56X1 3.26X2 6.72X3 1.05X4US Equivalent RatingAAAAA AAAAA AABBB BBBBBBBB BBBBB BBCCC CCCCCCDAverage EM Score Sample 01.75601427
An Emerging Market Credit Scoring System Step 1- Calculate the EM Score and its Bond Rating Equivalent (BRE) comparedto the U.S. Bond Market Step 2 -Adjust (modify) the Bond Rating Equivalent for Forex RevaluationVulnerability High vulnerability -1 rating class (3 notches) Neutral vulnerability -1 notch Low vulnerability no change Step 3 -Adjust BRE for Risk of Industry in the Emerging Market vs. Risk of theIndustry in the U.S. - 1 or 2 notches28
An Emerging Market Credit Scoring System Step 4 -Adjustment of BRE for Competitive Position Dominant firm in industry 1 notch Average firm in industry no change Poor competitive position -1 notch Step 5 -Special Collateral or Guarantees Impact on BRE Step 6 -Assess the yield in the U.S. market on the modified BRE of the emergingMarket credit, then add the sovereign yield spread. Finally, compare theresulting required yield with the yield in the market.29
Z-Score Models and Bond Rating EquivalentSelected Auto and Telecom CompaniesDateGMFordFiatDaimlerTelefonicaDeutsche TelecomTelecom ItaliaFrance 531.190.69EquivalentRatingCCC CCCCCC CCC BCCCCCC entRatingBBCCCB BB BCCCB CCCRevisedRatingBBBBBB BBBBBBBB BS&PRatingBBBBBBBBBBBABBB BBB BBB 30
Z-Score Models and Bond Rating EquivalentGeneral Motors Co.Z-ScoreDec 2003Dec 2002Dec 2001Dec 20000.840.790.750.81EquivalentRatingCCC BBBBBCCC RevisedRatingBBBBBBBBB 31
Z-Score Models and Bond Rating EquivalentFord Motors gRevisedRatingDec 20030.43CCC2.33CCCBDec 20020.44CCC2.44CCCBDec 20010.36CCC1.87CCC-B-Dec 20000.53CCC1.93CCC-B-32
Z-Score Models and Bond Rating EquivalentFiat Auto S.p.A.Z-ScoreDec 2003Dec 2002Dec 2001Dec 20001.070.840.870.92EquivalentRatingCCC CCC CCC CCC Z''-Score4.644.504.324.09EquivalentRatingB BBB-RevisedRatingBB BBBBBB-33
Z-Score Models and Bond Rating EquivalentDaimler-ChryslerZ-ScoreDec 2003Dec 2002Dec 2001Dec 20001.381.151.071.46EquivalentRatingBCCC CCC B-Z''-Score5.413.933.555.08EquivalentRatingBB BCCC BBRevisedRatingBBBBBB BBB-34
Z-Score Models and Bond Rating reEquivalentRatingRevisedRatingDec 20031.58B-4.16BBBDec 20021.02CCC 3.60CCC BDec 20011.32B-3.98B-B Dec 20001.27CCC 3.91B-B 35
Z-Score Models and Bond Rating EquivalentDeutsche atingRevisedRatingDec 20030.53CCC2.27CCCBDec 20020.29CCC-2.01CCCBDec 20010.67CCC3.21CCC BDec 20001.04CCC 3.34CCC B36
Z-Score Models and Bond Rating EquivalentTelecom tingRevisedRatingDec 20031.19CCC 4.64B BB Dec 20020.71CCC4.23BBBDec 20010.64CCC4.10B-B Dec 20000.58CCC3.72CCC B 37
Z-Score Models and Bond Rating EquivalentFrance atingRevisedRatingDec 20030.69CCC2.36CCCBDec 2002(0.19)D0.40CCC-B-Dec 20010.42CCC2.71CCCBDec 20000.70CCC1.93CCC-B-38
Mexican Firms Z-Score Analysis39
Mexican Corporate Issuers – EM Scores and ModifiedRatings (December ESCEmpresas ICAFemsaGemexGIDUSA (Durango)GMDGrumaGrupo DinaHylsamexIMSAKimberly-Clark de MexicoLiverpoolModernaPonderosaSan erateConstructionBottlingBottlingPaper and Forest ProductsConstructionFood ProcessingAuto ManufacturingSteelSteelPaper and Forest ProductsRetailConglomeratePaper and Forest ProductsAutopartsConglomerateSteelHotel and TourismTextile/ApparelSteel PipesTelecommunicationsCable and BBBBBBBABB B BBBBBBBBBBBBBBAAAAAABB ACCCB
– KMV Credit Monitor Model Blended Ratio/Market Value Models – Moody’s Risk Cal – Bond Score (Credit Sights) – Z-Score (Market Value Model) 3. Problems With Traditional Financial Ratio Analysis 1 Univariate Technique 1-at-a-time 2 No “Bottom Line” 3 Subjective Weightings 4 Ambiguous 5 Misleading 4. Forecasting Distress With Discriminant Analysis 5 Linear Form Z a1x1 a2x2 .