Transcription
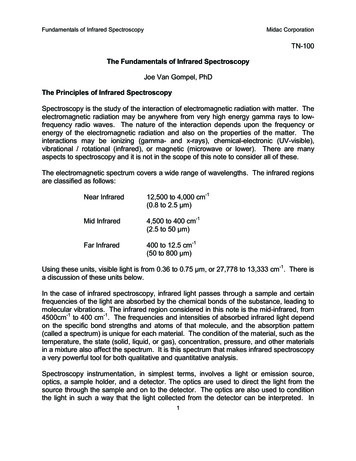
Fundamentals of Infrared SpectroscopyMidac CorporationTN-100The Fundamentals of Infrared SpectroscopyJoe Van Gompel, PhDThe Principles of Infrared SpectroscopySpectroscopy is the study of the interaction of electromagnetic radiation with matter. Theelectromagnetic radiation may be anywhere from very high energy gamma rays to lowfrequency radio waves. The nature of the interaction depends upon the frequency orenergy of the electromagnetic radiation and also on the properties of the matter. Theinteractions may be ionizing (gamma- and x-rays), chemical-electronic (UV-visible),vibrational / rotational (infrared), or magnetic (microwave or lower). There are manyaspects to spectroscopy and it is not in the scope of this note to consider all of these.The electromagnetic spectrum covers a wide range of wavelengths. The infrared regionsare classified as follows:Near Infrared12,500 to 4,000 cm-1(0.8 to 2.5 μm)Mid Infrared4,500 to 400 cm-1(2.5 to 50 μm)Far Infrared400 to 12.5 cm-1(50 to 800 μm)Using these units, visible light is from 0.36 to 0.75 μm, or 27,778 to 13,333 cm-1. There isa discussion of these units below.In the case of infrared spectroscopy, infrared light passes through a sample and certainfrequencies of the light are absorbed by the chemical bonds of the substance, leading tomolecular vibrations. The infrared region considered in this note is the mid-infrared, from4500cm-1 to 400 cm-1. The frequencies and intensities of absorbed infrared light dependon the specific bond strengths and atoms of that molecule, and the absorption pattern(called a spectrum) is unique for each material. The condition of the material, such as thetemperature, the state (solid, liquid, or gas), concentration, pressure, and other materialsin a mixture also affect the spectrum. It is this spectrum that makes infrared spectroscopya very powerful tool for both qualitative and quantitative analysis.Spectroscopy instrumentation, in simplest terms, involves a light or emission source,optics, a sample holder, and a detector. The optics are used to direct the light from thesource through the sample and on to the detector. The optics are also used to conditionthe light in such a way that the light collected from the detector can be interpreted. In1
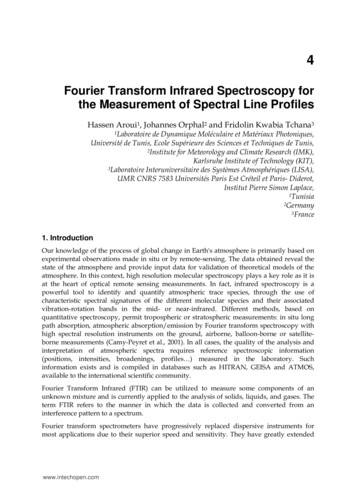
Fundamentals of Infrared SpectroscopyMidac Corporationsome cases this involves breaking the light up into component wavelengths so that thesample is exposed to only a narrow region of the spectrum at any one time. In this formof infrared spectroscopy the wavelength of light incident on the detector at a given time isknown. This is called DISPERSIVE spectroscopy because the light is dispersed into itscomponent wavelengths. In many cases, however, the optics are more complex. In thecase of Fourier Transform infrared spectroscopy (FTIR), the optics include anINTERFEROMETER, which modulates the infrared light such that the sample is exposedto the entire spectrum simultaneously. The individual wavelengths are then determinedusing mathematical operations (specifically the Fast Fourier Transform) to interpret themodulated light. This arrangement, while more complicated, leads to great advantages interms of collection time, resolution, and signal-to-noise ratio. The mechanical andoperational details of the interferometer are discussed in another applications note.The infrared spectrum is measured by either absorbance or percent transmittance on they-axis and by either the wavelength (um) or wavenumber (cm-1) to measure the positionof an infrared absorption on the x-axis. Most compounds have characteristic absorptionsin the infrared region. Tables of characteristic IR absorptions of functional groups can befound in most organic chemistry text books. A simple spectrum showing an idealizedband is shown in Figure 1.Figure 1. An idealized absorbance band in transmittance on the y-axis.2
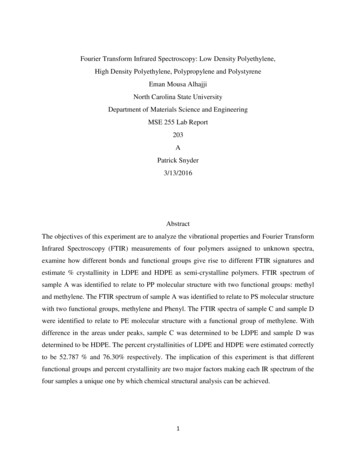
Fundamentals of Infrared SpectroscopyMidac CorporationIn this case, the y-axis shows transmittance, in which case the line at the top indicates allof the light at that wavelength is making it to the detector. The absorption band pointsdownward. The strength of the absorption band is often reported as a value from 0 to100 in percent transmittance. The light at that frequency or wavelength is beingabsorbed, or soaked up, by the chemical bond, causing it to vibrate more. The light thatis absorbed by the chemical bond does not make its way to the detector, and so thetransmitted light is reduced at that frequency. The intensity of the absorption is describedin Equation 1:TransmittanceT I/IoEquation 1Io Intensity of incident radiation from the infrared source at that frequencyI Intensity of transmitted radiation that reaches the detector at that frequencyAn infrared spectrum is often viewed in absorbance, with the peaks pointing up from thebaseline instead of downward. The relationship between transmittance and absorbanceis logarithmic, as described in Equation 2. That is, 100% transmittance is 0 absorbanceunits, 10% transmittance is 1 absorbance units, 1% transmittance is 2 absorbance units,etc.Absorbance A log(1/T) log(Io/I) ecLEquation 2e molar extinction coefficient (or molar absorptivity)c concentrationL sample pathlengthAn absorption band can be characterized by two parameters; the wavelength at whichmaximum absorption occurs, and the intensity of absorption at this wavelength. In anabsorption spectrum, the intensity of the band is proportional to the number of molecules(i.e. the concentration) of the material being sampled. Similarly, the sample pathlengthterm means that a longer (or thicker) sample will absorb more strongly. Both of thesefactors make infrared spectroscopy a very powerful tool for quantitative analysis.The units commonly used on the x-axis in infrared spectroscopy are either thewavelength in micrometers or microns, using the Greek letter mu (μ), or wavenumbers,also referred to as reciprocal centimeters (cm-1). Consider the wave properties of light.The wavelength is simply the distance between one wave maximum and the next. SeeFigure 2.3
Fundamentals of Infrared SpectroscopyMidac CorporationFigure 2. Wavelengths and wavenumbers.In this case, the sine wave has maxima at 1.4, 7.7, and 14.0 micrometers, so thewavelength is 6.3 micrometers. If this drawing were extended out to fill one entirecentimeter (10,000 micrometers per cm), then there would be a total of 10,000/6.3 1587.3 of these maxima. This is the wavelength as measured in reciprocal centimeters;6.3μ 1587.3 cm-1. Spectroscopists use both wavelength and wavenumbers, butwavenumbers are preferred because the energy of light varies directly with wavenumber.In other words, the energy of light increases (red to blue) as the wavenumber valueincreases.Wavelengths were used extensively in the early days of infraredspectroscopy, but wavenumbers are used almost exclusively today. Wavenumbers willbe used exclusively in the remainder of this note.Fundamental Vibrations of MoleculesAs mentioned, infrared light matches the vibrational frequencies of the molecular bonds.When infrared light is incident on the molecule, the frequency which corresponds with thenatural vibrational frequency may be absorbed by the molecule, increasing the magnitudeof the natural molecular vibrations. Some bonds absorb more strongly than others, andsome compounds give very complex spectra. The details governing the specifics of anabsorption band can be described mathematically and are couched in quantummechanical terms. In order for a vibration to be “infrared active”, it is necessary for achange in the dipole moment to occur during the absorption of the infrared light. In otherwords, the electronic charge distribution from one side of the bond to the other mustoccur. Consider hydrogen chloride, HCl. When HCl vibrates along the bond, the chlorinetakes on a slightly more negative charge, and the hydrogen takes on a slightly morepositive charge. Consequently, a change in dipole moment of the HCl molecule occurs.In some molecules, such as homonuclear diatomics (O2, N2, H2, F2, Cl2, Br2, I2) there isno induced dipole moment, and these compounds are considered IR-inactive. Similarly,the noble gases (He, Ne, Ar, Kr) and most vaporized elements (e.g. Hg) are monatomicand have no bonds at all. These compounds are few and there are other techniques formeasuring them.4
Fundamentals of Infrared SpectroscopyMidac CorporationThe actual frequency of the vibrational modes for simple molecules can be calculatedusing the harmonic oscillator or “weight on a spring” model, which considers the atomicmass of both atoms as well as the strength of the bond. The traditional “weight on aspring” involves an object of some mass m hanging from spring attached to a fixed ceilingor support. Since molecules are not fixed in space, the reduced mass is used instead,Equation 3. For diatomic molecules, the absorption frequency can be calculated.Equation 3m1, m2 masses of vibrating atoms, gc velocity of light, 3x1010 cm/secv wavenumber, cm-1k force constant (bond strength), dynes/cmBond StrengthFor a single bond k 5 x 10⁵ dynes/cmdouble bond k 10 x 105 dynes/cmtriple bond k 15 x 105 dynes/cmExample: Calculate the fundamental frequency expected in the infrared absorptionspectrum for the C-O stretching frequency using Equation 3.Avogadro's number 6.023x10²³ atoms/moleCarbon-oxygen single bonds span a range from 1000 cm-1 to 1250 cm-1 depending on therest of the molecule. Using this calculation for carbon-oxygen double bonds, we obtain1571 cm-1 (typical carbonyls are from about 1675 cm-1 to 1800 cm-1) and for the carbonoxygen triple bond at 1925 cm-1 (carbon monoxide is centered at about 2145 cm-1). Thevariation depends on many factors, not the least of which is that the C-O and C O bondsare not diatomic, but the fundamental idea of a weight-on-a-spring is still valid forcalculation of bond frequencies.5
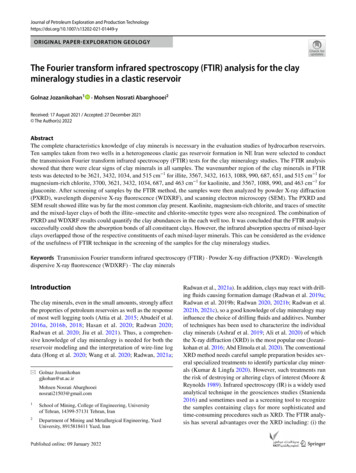
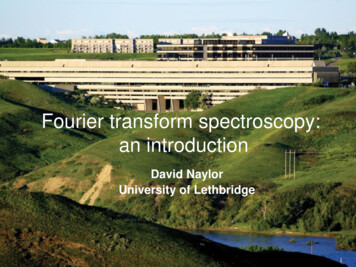
Fundamentals of Infrared SpectroscopyMidac CorporationSome modes of vibration:Stretching - distance between 2 atoms increases or decreases.Bending - position of the atom changes relative to the original bond axis.Scissoring – a bent molecule (e.g. H2O) bends inward and outward.Rocking – a twist of a bond with several other adjacent atomsAs molecules get more complex, the number of possible modes increases as 3n-6, wheren is the number of bonds. Bear in mind that these are primary motions; there are alsocombination bands, overtones, and rotational bands (gas phase). In addition, sometransitions are considered “forbidden” for quantum mechanical reasons.The CO2 molecule is a typical example that illustrates the stretching and bending vibrationmodes, as shown in Figure 3. A symmetrical vibration along the axis produces nochange in the dipole moment and therefore is infrared inactive. The unsymmetricalstretching gives a charge separation (change in the dipole moment) and thus is capableof interacting with light of the same frequency; absorption is observed. Bending motionscan also occur as shown. The bending motions are at a lower frequency.Figure 3: Vibrational modes of CO2.As a consequence of the multiplicity of bending and stretching modes, the infraredspectra get very complicated. Most organic chemistry and spectroscopy books havetables of common infrared absorbance bands. In addition, there are many excellentbooks on infrared spectral interpretation that can be used as guides for analyzing infraredspectra.The Infrared SpectrumAs mentioned earlier, the primary optical component of an FTIR spectrometer is theinterferometer. The interferometer has a moving mirror, a fixed mirror, and abeamsplitter. A further discussion of these components is presented in an ApplicationsNote called FTIR Hardware: Interferometers. This note discusses both the modulatedlight seen by the detector, called the interferogram, and how it is changed to the singlebeam spectrum, and then on to the transmittance spectrum.The interferogram looks like a cross (double-sided interferogram), or a sideways letter T(single-sided interferogram) with an intense signal at one point and much smaller signalsfor the rest of the spectrum. In the interferogram, all of the wavelengths of light arecombined in such a way that the Fourier Transform can convert them into an infrared6
Fundamentals of Infrared SpectroscopyMidac Corporationspectrum. A background interferogram (without sample) will be taken first. Thebackground interferogram will show the spectral response of the FTIR; source emissions,reflection and transmission efficiencies of the interferometer, the response of the detector,and the effects of the electronics. The sample is then placed in the path of the light, anda second interferogram is collected. This interferogram will be more complex. It will havethe actual spectrum of the sample compound superimposed onto the backgroundinterferogram. See Figure 4.Figure 4. Background and sample interferograms.Both of the interferograms are converted to single-beam spectra using the FourierTransform, a mathematical operation that “decodes” the interferogram into individualwavelengths called single beams, Figure 5. This name was originally employed todistinguish from early dispersive “double-beam” spectrometers, where the optical pathwas duplicated and the reference and sample spectra were collected simultaneously (andslowly). In the case of FTIR, the background and sample are collected separately andmathematically combined later.Figure 5. Interferogram and single beam.7
Fundamentals of Infrared SpectroscopyMidac CorporationThe single beam spectra reflect the spectral response of the optics and electronics of theFTIR spectrometer, such as the emission of the source, the detector response, theefficiencies of the mirrors and beamsplitters, and effects of electronics (such as bandpass filters). See Figure 6. The background single beam is relatively featureless exceptfor sharp bands from water vapor and CO2. These are also present in the sample singlebeam, so they will effectively cancel out in the final spectrum.Figure 6. Background and sample single beams.The single beams are then ratioed, or divided. Specifically, the sample spectrum isdivided by the background spectrum (I/Io, Equation 1) at every wavelength, data point bydata point. The resultant transmittance spectrum will show relative intensities of thedifferent bands dropping from a baseline at the top of the spectrum, Figure 7. In thiscase, a point on the spectrum that is close to the top means that very little light is beingabsorbed by the sample at that wavelength (or wavenumber), whereas the bands thatapproach the bottom of the transmittance spectrum are very strong and nearly all of thelight is being absorbed. While this class of infrared spectrum is qualitatively useful, thefinal step is typically conversion from % Transmittance to Absorbance according toEquation 2, as absorbance is linear with concentration.Figure 7. Transmittance and absorbance spectrum of polystryrene.8
Fundamentals of Infrared SpectroscopyMidac CorporationAn example of an absorption being linear with concentration is seen with carbonmonoxide in Figure 8.Figure 8. Carbon monoxide at 20, 50, 100, 150, and 300 ppm.Some common spectraAn infrared spectrum can be collected of nearly any compound or sample.Figure 9. Hydrogen chloride, high resolution.9
Fundamentals of Infrared SpectroscopyMidac CorporationFigure 10. Nylon-6Figure 11, Water vapor (top), liquid water (bottom).10
Fundamentals of Infrared SpectroscopyMidac CorporationSummaryInfrared spectroscopy is a technique which measures the infrared absorbances of variousmaterials in gas, liquid, or solid phases using suitable sampling techniques. The infraredspectrum is qualitatively useful in determining the identity of a compound, as all materialshave different infrared signatures. The infrared spectrum is also quantitatively useful asthe strength of the infrared absorbances vary with concentration.Gas phasemeasurements using infrared spectroscopy are especially powerful as sampleconcentrations can be analyzed over 12 orders of magnitude, from parts-per-billion levelsup to pure materials where trace impurities are of interest. The technology of infrared gasanalysis is very mature and well-established in both industrial and research applications.11
Using these units, visible light is from 0.36 to 0.75 μm, or 27,778 to 13,333 cm-1. There is a discussion of these units below. In the case of infrared spectroscopy, infrared light passes through a sample and certain frequencies of the light areabsorbed by the chemical