Transcription
Fourier transform infrared spectroscopy analysis ofvarious solvent extracts of Caralluma fimbriyataPackialakshmi N*, Naziya S1PG and Research Department of Microbiology, Jamal Mohamed College (Autonomous),Tiruchirappalli-620 020, Tamil Nadu, India.Received on: 20/08/2014Accepted on: 30/09/2014Published on: 15/10/2014Packialakshmi NAssistant Professor, PG and ResearchDepartment of Microbiology,Jama lMohamed College (Autonomous),Tiruchirappalli-620 020, Tamil Nadu,India.Email: naziyanaz12@gmail.com.AbstractCaralluma fimbriyata an edible succulent cactus is a perennial herbgrowing in dry parts of Tamil Nadu, India. It belongs to the familyApocynaceae. Caralluma have found medicinal uses in the treatment ofRheumatism, Diabetes, Leprosy, Antiseptics and Disinfectants. The mainobjective of the study is to observe the salient features exhibited by theFourier Transform Infrared Spectroscopy the vibrational assignments,intensities and wave number of dominant peak were obtained fromabsorption spectra. Various functional groups like halogen, alkanes,carboxylic acid, aldehydes etc were identified by the various solventextractions of Caralluma fimbriyata. This article attempts to reveal the useof Fourier Transform Infrared Spectroscopy and at the same time creatinginterest among the prospective researcher in herbal analysis and thisstudy creates a platform to screen many bio active components to treatvarious diseases .Keywords: Caralluma fimbriyata, crude, column, polar and nonpolarextracts, IR Spectra analysis.QR Code for Mobile usersDOI: 10.15272/ajbps.v4i36.569Cite this article as:Packialakshmi N, Naziya S. Fourier transform infrared spectroscopy analysis of various solvent extracts of Caralluma fimbriyata.Asian Journal of Biomedical and Pharmaceutical Sciences; 04 (36); 2014 , 20-25.
Packialakshmi N et al: Asian Journal of Biomedical and Pharmaceutical Sciences; 4(36) 2014, 20-25.INTRODUCTIONMedicinal plants are good sources of antioxidants, andused as adjunctive therapy in the treatment of diabetes,diarrohoea, hyperlipidemia1. The main constituents ofmedicinal plants, such as saponins, flavanoids, andpolyphenols are known to be major bioactivecompounds in Ayurvedic medicine2. Most antioxidantsisolated from medicinal plants are polyphenols, whichshow biological activities include anti bacterial, antiinflammatory, anti obesity, antiviral, anti carcinogenicand immune stimulating effect. The use of herbalremedies for arthritis treatment has been gainingmomentum in recent years3.Caralluma, a cactus plant belongs to familyAsclepiadaceae is a succulent, perennial herb, grow to aheight of 1 to 10 ft and grow in different regions ofIndia. The members of genus Caralluma are erect andfleshy. They have quadrangular stem, devoid of leavesand small flowers in several varieties of dark colour.The species of Caralluma found in India are edible andform a part of traditional medical system of country4.Caralluma species present in India are edible and alsotake part in traditional medicine of our country 5.People in semi arid areas of Pakistan used the speciesof Caralluma for centuries as emergency foods 6.Caralluma extracts have also been found to be appetitesuppressant property which is well known to Indiantribal and hunters. In another report, it was observedthat C. fimbriata can be used in weight reductionCaralluma species is known for its antihyperglycemicactivity and C. edulisis for antidiabetic properties7.Theextract of C. attenuate and C. edulis had hypoglycemicproperties and provide synergistic effect incombination with the phlorizin extract whichbeneficially modified glucose transport, blood andurine glucose levels, blood insulin levels and helps inweight loss 8. The indiscriminate and destructiveharvesting of these plants continues unable despiteincreased governmental regulation, resulting in manyspecies becoming endangered. C. nilagiriana is asucculent medicinal plant depleted due to overexploitation, lack of organized cultivation andcompletely eaten by sheep and goats, the wildpopulation has become restricted to Nilgiris,Tamilnadu. Regrettably, this species has now beenadded to the list of Indian endemic plants 9.Many recent studies revealed that Caralluma is animportant medicinal plant. Keeping the values ofCaralluma in mind the present investigation wascarried out to screen the biomolecules present inaqueous, petroleum ether, chloroform, ethanol andacetone extracts of the aerial part of Carallumafimbriyata collected from Maruthvamalai, KanyakumariDistrict, Tamilnadu, India and to determine theirfunctional group using (FT-IR) spectral analysis.MATERIALS AND METHODSCollection of Plant Materials:Fresh young plants of Caralluma fimbriyata werecollected from Viralimalai, Pudukkottai district,Tamilnadu, India. The plants were identified in Rapinatherbarium, St josephs College, Tiruchirappalli. Thestem was separated from the collected plant. Then itwas air dried in shade for 15 days and then pulverizedto fine powder for further analysis.Chromatography:Column chromatography is used to purify liquids byseparating an organic solvent from a mixture ofsolvent.Preparation of Leaf Extract:The stem extract (5mg) was prepared by grinding themixture in mortar pistol containing 22 ml of acetone, 3ml petroleum ether and calcium carbonate. The extractwas filtered and mixed with 20 ml petroleum ether and20 ml of 10% aqueous sodium chloride solution. Theseparating funnel was shaken carefully and the lowerlayer was allowed to drain in to the beaker.Preparation of Column:A plug of cotton is placed to the bottom of the columnso that silica and soil won’t fall out. Slurry of silica wasprepared and poured into the column carefully. Aftersettling the silica the sand is added.Loading of Sample:The sample was added using a pasture’s pipettecarefully above the sand. The eluent is added to the topof the sand. The mobile phase slowly flows downthrough the silica gel column by gravity leaving behindzone of color and a component was eluted from thecolumn. The eluted compounds are allowed to air dryfor 5-10 days. The dried eluted substances aresubjected for FTIR analysis. This analysis is helps toknow the functional group present in the plant. In thepresent study of Caralluma fimbriyata plants ofdifferentpartswere analyzedbycolumnchromatography and then the eluted compounds arefurther analyzed by FTIR.The eluted compounds were compared for theirchanges in functional group and its activity.Fourier Transform Infrared Spectroscopic Analysis(FT-IR):The whole plant Caralluma fimbriyata was oven driedat 600C and ground into fine powder using a mortarand pestle. Two milligrams of the sample was mixedwith 100mg KBr (FT-IR grade) and then compressed toprepare a salt disc (3mm diameter). The disc wasimmediately kept in the sample holder and FT-IRspectra were recorded in the absorption rangebetween 400 and 400cm‾1. All investigations werecarried out with a Shimadzu FT-IR spectrometer. Asian Journal of Biomedical and Pharmaceutical Sciences, all rights reserved. Volume 4, Issue 36, 2014.21
Packialakshmi N et al: Asian Journal of Biomedical and Pharmaceutical Sciences; 4(36) 2014, 20-25.RESULTThe present study showed that different compoundswere separated from Caralluma fimbriyata by usingcolumn chromatography. The eluted sample is allowedto dry in air. These eluted compounds were subjectedto FTIR analysis. The FTIR spectrum was used toidentify the functional group of the active componentsbased on the peak value in the region of infraredradiation. The results of FTIR peak values andfunctional groups were represented in table 1, 2, 3 and4. The presence of various functional groups ofdifferent compounds was found. FTIR spectroscopy isproved to be a reliable and sensitive method fordetection of biomolecular composition.S.no1Peak value596.00StretchingC-Br stretchingInterpretationHalogen2675.09-C-Cl -C-F-C-CN ON 0C OC ON-HC-HO-HN-HHalogenAromaticsNitro compoundsNitro compoundsAcid AnhydridesAcid AnhydridesAminoacidsAlkanesAlcoholAmidesTABLE 1: Infra red spectrum analysis by Caralluma fimbriyataaqueous stem 9C-Br stretchingHalogen2675.09C-Cl stretchingHalogen3779.24C-H stretchingAromatic compounds4921.97C-O stretchingEthers51078.21C-O stretchingEthers61382.96C-H stretchingAlkanes71404.18C-H stretchingAlkanes81523.76N-H stretchingAmides91598.99C-H stretchingAldehydes101658.78C O stretchingKetones111728.22C O stretchingAcid Anhydrides121782.22C O stretchingAcid Anhydrides131809.23C O stretchingAcid Anhydrides141853.59C O stretchingAcid Anhydrides151901.81C C stretchingAlkynes162270.22N-H stretchingAminoacids172382.09N-H stretchingAminoacids182926.01C-H stretchingAlkanes193400.50N-H stretchingAmides203631.96O-H stretchingAlcohols213697.54O-H stretchingAlcohols223782.41O-H stretchingAlcoholsTable 2. Infra red spectrum analysis by Caralluma fimbriyatacoloumn compoundS.noPeak valueStretchingInterpretation1651.94C-Cl stretchingHalogen2673.16C-Cl stretchingHalogen3779.24C-H stretchingAromatic compounds4840.96C-Cl stretchingHalogen5921.97C-O stretchingEthers61078.21C-F stretchingHalogen71151.50C-F stretchingHalogen81384.89C-O stretchingAlcohol91462.04C-H stretchingAlkenes101494.83C-F stretchingHalogen111544.98C-H stretchingAldehydes121602.85C C stretchingAlkenes131658.78C-H stretchingAldehydes141707.00C O stretchingEsters151724.36C O stretchingLactones161739.79C O stretchingLactones171853.59C O stretchingAcid Halides181901.81C O stretchingAcid Halides192378.23N-H stretchingCarboxilic acids202852.72O-H stretchingCarboxilic acids212922.16O-H stretchingAmides223402.43N-H stretchingAmides233695.61O-H stretchingAlcohols243782.41O-H stretchingAlcoholsTABLE 3: Infra red spectrum analysis by Caralluma fimbriyatamethanol extractS.noPeak valueStretchingInterpretation1569.00C-Br StretchingHalogen2651.94C-Cl StretchingHalogen3673.16C-Cl StretchingHalogen4777.31C-Cl StretchingHalogen5931.62C-H StretchingAromatic compounds61041.56C-O StretchingEthers71085.92C-O StretchingEthers81120.64C-O StretchingEthers91263.37N O StretchingNitrocompound101321.24N O StretchingNitrocompound111382.96C-H StretchingAlkanes121406.11C-H StretchingAlkanes131425.40C-H StretchingAlkanes141463.97C-H StretchingAlkanes151527.62N O StretchingNitrocompound161589.34N O StretchingNitrocompound171656.85N O StretchingNitrocompound181705.07C O StretchingAldehydes191722.43C O StretchingKetones201739.79C O StretchingAcid anhydrides211782.23C O StretchingAcid anhydrides221809.23C O StretchingAcid anhydrides231853.59C 0 StretchingKetones241899.88C O StretchingCarboxilic acids252376.30N-H StretchingAminoacids262852.72C-H StretchingAlkanes272922.16C-H StretchingAlkanes283402.43N-H StretchingAmines293697.54O-H StretchingAlcohols303784.340-H StretchingAlcoholsTable 4: Infra red spectrum analysis by Caralluma fimbriyatapetroleum ether extract. Asian Journal of Biomedical and Pharmaceutical Sciences, all rights reserved. Volume 4, Issue 36, 2014.22
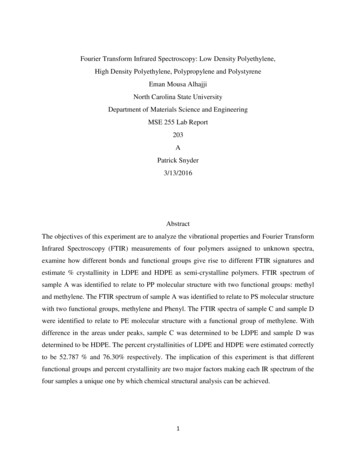
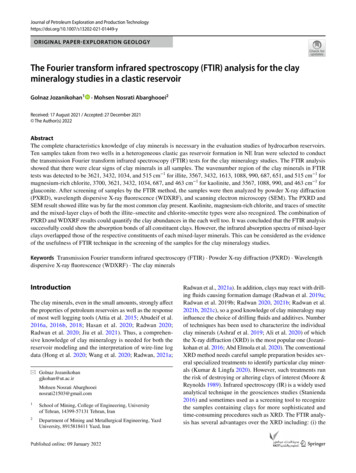
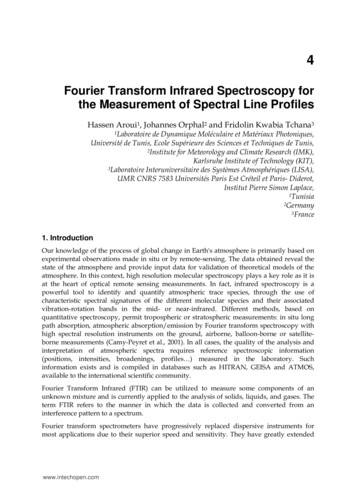
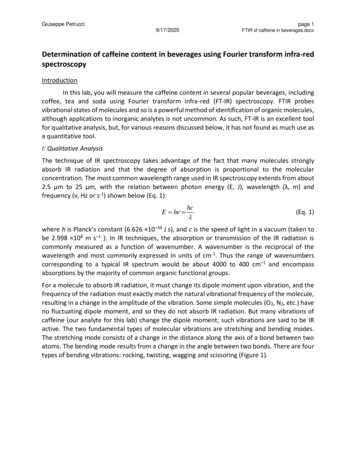
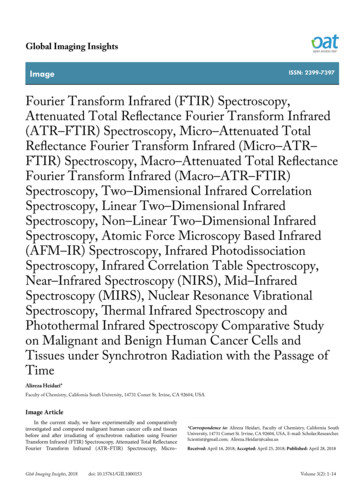
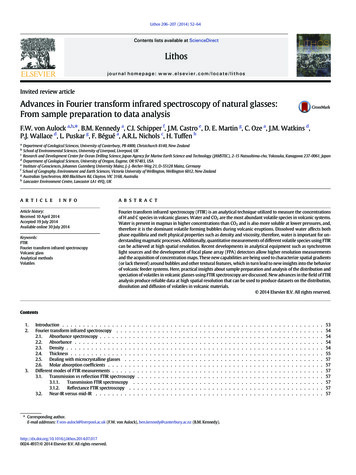
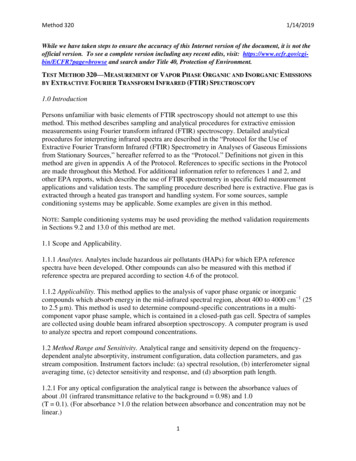
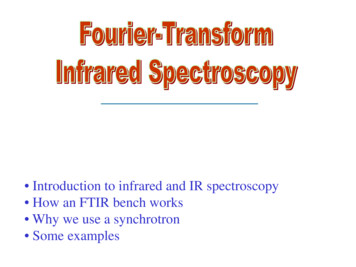
Packialakshmi N et al: Asian Journal of Biomedical and Pharmaceutical Sciences; 4(36) 2014, 20-25.The absorption spectra of aqueous sample stem areshow in fig.2. The dominant band in case of stem wasobserved at 596.00, 675.09, and 1116.78 cm-1represents halogens compound. The band at 1521.84,and 1560.41 cm-1 was due to nitro compound. The peakat 1743.00, and 1797.66 cm-1 representing Acidanhydrides. The peak at 3431.36 indicated alcoholgroup. The band at 2927.94 cm-1 was due to thepresence of alkanes. The band at 1413.82 showsAromatic compounds. The peak at 2289.59 cm-1 showsAmino acids. The band at 3726.47 cm-1 show representthe presence of Amides.The absorption spectra of the column compoundextracts sample are shown in fig.3. The strong bandwas observed at 501.49, 675.09 cm-1 was attributed tohalogens group. The band at 1382.96, 1404.18, and2926.01 cm-1 was due to C-H stretching of alkanes. Theband at 1728.22, 1782.22, 1809.23, and 1853.59 cm-1revealed the presence of C O stretching of Acidanhydrides . The band at 1901.81 cm-1 was attributedto C C stretching of alkynes. The band at 921.97 and107821 cm-1 was due to Ethers. Amides presence wasdetermined by the presence of band at 1523.76, and3400.50 cm-1. The band at 3631.96, 3697.54, and3782.41 cm-1 represent alcohols. The band at 779.24cm-1 shows Aromatic compounds. The peak at 2270.22,2382.09 cm-1 shows Amino acids.The absorption spectra of the methanol extracts ofstem sample are shown in fig.3. The band at 651.94,673.16, 840.96, 1078.21, 1151.50, and 1494.83 cm-1attributed to halogens group. The band at 1384.89,3695.61, and 3782.41 cm-1 represent alcohol. Theabsorption band at 1462.04, 1602.85 cm-1 representalkenes. The peak at 779.24 cm-1 indicates C-Hstretching of aromatic compounds. C O stretching wasfound to be Acid halides present due to the appearanceof absorption peak at 1853.59, and 1901.81 cm -1 . Theband at 921.97 cm-1 was due to ethers. The band at2922.16 and 3402.43 cm-1 represent amides. The peakat 2378.23 and 2852.72 cm-1 indicates carboxylic acids.The band at 1707.00 cm-1 represents esters. The bandat 1724.36 and 1739.79 cm-1 revealed the presence oflactones.The absorption spectra of petroleum ether sample stemare show in fig.4. The dominant band in case of stemwas observed at 569.00, 651.94, 673.16 and 717.31cm1represents halogens compound. The band at 1263.37,1321.24, 1527.62, 1589.34 and 1656.85 cm-1was dueto nitro compound. The peak at 1739.79, 1782.23 and1809.23 cm-1representing Acid anhydrides. The peakat 3697.54 and 3784.34cm -1 indicated alcohol group.The band at 1382.96, 1406.11, 1425.40, 1463.97,2852.72 and 2922.16 cm-1was due to the presence ofalkanes. The band at 931.62 cm-1shows Aromaticcompounds. The band at 1041.56, 1085.92 and 1120.64cm-1 was due to ethers. The peak at 2376.30 cm-1 showsAmino acids. The band at 3402.43 cm-1 showrepresents the presence of Amines. The peak at1899.88 cm-1 indicates carboxylic acids. The band at1705.07 cm-1 represents aldehydes. The peak at1853.59 cm-1 shows ketones. Significant changes havebeen recorded in the functional groups of differentsolvent extracts in Caralluma fimbriyata subjecting thesample for FTIR.Figure 1: Infra red spectrum analysis by Caralluma fimbriyataaqueous stemFigure 2: Infra red spectrum analysis by Caralluma fimbriyatacolumn compound Asian Journal of Biomedical and Pharmaceutical Sciences, all rights reserved. Volume 4, Issue 36, 2014.23
Packialakshmi N et al: Asian Journal of Biomedical and Pharmaceutical Sciences; 4(36) 2014, 20-25.Figure 3: Infra red spectrum analysis by Caralluma fimbriyatamethanol extractFigure 4: Infra red spectrum analysis by Caralluma fimbriyatapetroleum ether extractDISCUSSIONIn the earlier study Asha et al reported that Carallumageniculata is a medicinal plant, has been used as afolkloric medicine to treat amentia, anorexia, fever,swelling and rheumatism. In earlier studies reportedthat Caralluma fimbriyata has antileishmanial activityof acetone and methanol extract.C. umbellata also exhibited significant antinociceptiveactivity, this is due to the presence of novel pregnaneglycoside named Carumbelloside II and V, and antiinflammatory activity due to the presence of pregnaneglycoside Carumbelloside II and III 10, 11 . Similarly leafextract of Caralluma fimbriata exhibited analgesicactivity 12. Saivasanthi and her coworkers evaluatedand identified the analgesic, anti-inflammatory andanxiolytic activity of C. fimbriata 13. Leaf extract of C.fimbriata shows significant anti-nociceptive activity 14.Experimented the appetite suppressant andantiobesogenic effects of C. fimbriata extract on asample of rats fed with cafeteria diet and observed thepotential of CFE to curb obesity and the pathologieslinked to obesity. The gastroprotective effect of C.adscendens var. fimbriata due to its antioxidantproperty was proved 15.The present work identify the functional groups thesegroups do the wonderful role against the pathogens.CONCLUSIONAn attempt has been made in this work to study thefunctional derivatives of the sample. By observing theposition and relative intensities of the band in FTIR.The spectral analysis indicated that the specificfunctional groups. FTIR spectroscopy techniqueshowed that the presence of functional groups whichcan be isolated and further screened for different kindof biological activities depending their therapeuticuses. Further research will be needed to find out thestructural analysis of compound by use of differentanalytical method such as NMR and Massspectrophotometer.ACKNOWLEDGEMENTSThe authors are thankful to the Principal andManagement of Jamal Mohamed College (Autonomous),Trichirappalli for offering facilities to carry out thisresearch.REFERENCES1.Burits M, Bucar F. Antioxidant activity of Nigella sativa essentialoil. Phytotherapy Research. 2000; 008)14:5 323::AIDPTR621 3.0.CO;2-Q2.Andrzej L, Dawidowicz, Dorota Wianowska and Barbara. Theantioxidant properties of alcoholic extracts from Sambucus nigra L.(antioxidant properties of extracts). LWT- Food Science andTechnology. 2006; 39: 308-315.3.Matsui T, Tanaka T, Amura S, Toshima A, Miyata Y, TanakaK.Alpha-glucosidase inhibitory profile of catechins and theaflavins.Journal of Agricultural and Food Chemistry. 2007; 55: a MA, Abdel-Sattar E. Pregnane Glycoside from Carallumarusseliana. J.Nat.Prod., Chemical constitue . 2000; 63 (45):1453.5.Lawrence RM, Choudhary S.Caralluma fimbriata in the treatmentof obesity .12th annual congress on anti aging medicine. Wintersession December 2- 5. Las vegasNv USA.2004.6.Venkatesh S, Reddy GD, Reddy BM, Ramesh M, Rao AVNA.Antihyperglycemic activity ofCaralluma attenuate. Fitoterapia.2003; 74: 021-2 Asian Journal of Biomedical and Pharmaceutical Sciences, all rights reserved. Volume 4, Issue 36, 2014.24
Packialakshmi N et al: Asian Journal of Biomedical and Pharmaceutical Sciences; 4(36) 2014, 20-25.7. Wadood A,Wadood N,Shah SA .Effect of Acacia arabica andCaralluma edulis on blood glucose levels of normal and alloxandiabetic rabbits. J.Pak. Med. Assoc. 1989;9: 208-212.8.Khan AW, Khatoon S Ethnobotanical studies on some useful herbsof Haramosh and Bugrote valleys in Gilgit, northern areas ofPakistan. Pak. J. Bot.2008; 40:43-58.9.Ray S, Sharma A,Nagaiah K. International Journal ofComprehensive Pharmacy. 2012; 03(01): 1-2.10.Ray S, Nagaiah K. Journal of Pharmaceutical and BiomedicalSciences. 2011; 12 (13):1-311.Ray S, Nagaiah K, Khan FN. NSHM Journal of Pharmacy andHealthcare Management 2011; 02: 83-88.12.Ray S, Rahaman N, Basu A, Ray SG. Journal of Pharmaceuticaland Biomedical Science. 2012; 18(15): 1-3.13.Saivasanthi V, Gowthamigoud, Swathi K, Aakruthi S, Rani A,Gupta AS Rao. International Journal of Pharmacy. 2011; 1(1): 40-45.14.Kamalakkannan S, Rajendran V, Venkatesh RV, Clayton P,Akbarsha MA. Antiobesogenic and antiatherosclerotic properties ofCaralluma fimbriata extract. Journal of Nutrition andMetabolism.2010; 6 :1155.15.Malkapur MD, Gunagambire MV, Mahorkar NKR, Konduri P.Journal of Pharmacy Research. 2012;5(3): 1574-1577. Asian Journal of Biomedical and Pharmaceutical Sciences, all rights reserved. Volume 4, Issue 36, 2014.25
Fourier transform infrared spectroscopy analysis of various solvent extracts of Caralluma fimbriyata Packialakshmi N*, Naziya S1 PG and Research Department of Microbiology, Jamal Mohamed College (Autonomous), Tiruchirappalli-620 020, Tamil Nadu, India. Abstract Caralluma