Transcription
APPENDIXAG U I D E TOUSING MICROSOFTP R O J E C T 20 1 3Note 1: This Appendix is used with permission from Schwalbe Publishing. It waspublished as a stand-alone book on May 2, 2013 and as an appendix in Kathy Schwalbe’sHealthcare Project Management (co-authored with Dan Furlong) and Revised An Introduction to Project Management, Fourth Edition.Note 2: This guide was written using the free trial of Microsoft Office Project 2013Professional and Windows 7. Your screens may appear slightly different. You can download a free trial of Project 2013 Professional from www.microsoft.com/project. You canaccess updated information as well as the older version of this guide based on Project2007 or Project 2010 at www.intropm.com. You can purchase just this new Appendixfrom www.intropm.com in Kindle or hard-copy format. Also note that Microsoft nowprovides a cloud-based tool called Project Online, available for a monthly fee.IntroductionA.2Project Management Software ReviewsA.3Basic Features of Project Management SoftwareA.5What’s New in Project 2013A.6Using Project 2013A.7Before You BeginA.7Using the 60-day Trial of Project 2013A.8Overview of Project 2013A.9Starting Project 2013 and Getting StartedA.9Understanding the Main Screen ElementsA.12Using Project Help and the Project Web SiteA.14Exploring Project 2013 Using an Existing FileA.15Project 2013 ViewsA.17Project 2013 ReportsA.19Project 2013 FiltersA.21Creating a New File and Entering Tasks in a Work Breakdown StructureCreating a New Project FileA.23A.23
Appendix AA.2Creating a Work Breakdown Structure HierarchyA.25Creating Summary TasksA.26Numbering TasksA.27Saving Project Files Without a BaselineA.28Developing the ScheduleA.29CalendarsA.29Entering Task DurationsA.31Manual and Automatic SchedulingA.31Duration Units and Guidelines for Entering DurationsA.32Entering Task DurationsA.34Establishing Task DependenciesA.38Gantt Charts, Network Diagrams, and Critical Path AnalysisA.43Project Cost and Resource ManagementA.46Entering Fixed and Variable Cost EstimatesA.46Entering Fixed Costs in the Cost TableA.47Entering Resource Information and Cost EstimatesA.47Using the New Team Planner FeatureA.51Entering Baseline Plans, Actual Costs, and Actual TimesA.52Viewing Earned Value Management DataA.56Integrating Project 2013 with Other Applications and Apps for OfficeA.57Copying Information Between ApplicationsA.57Creating Hyperlinks to Other FilesA.59Using Project 2013 AppsA.60Discussion QuestionsA.63ExercisesA.63End NotesA.64INTRODUCTIONThere are hundreds of project management software products on the market today.Gartner estimated the project and portfolio management (PPM) software market to beover 1 billion in 2011, and it continues to grow. Unfortunately, many people who ownPPM software have no idea how to use it. It is important to understand the basic conceptsof project management, such as creating a work breakdown structure, determining task
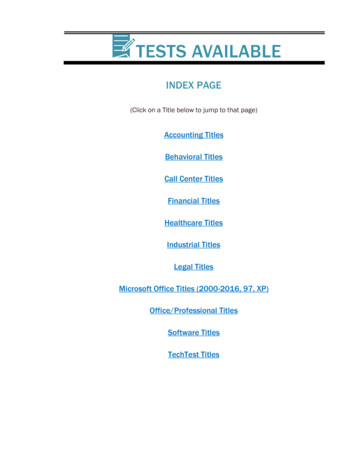
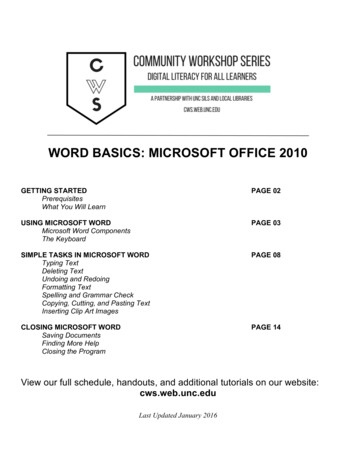
Guide to Using Microsoft Project 2013dependencies, and so on before making effective use of this software. Many project teamsstill use spreadsheets or other familiar software to help manage projects. However, if you canmaster a good project management software tool, it can really help in managing projects.This appendix summarizes basic information on project management software in general. Italso provides a brief guide to using Microsoft Office Project 2013 Professional (often referredto as Project 2013), the latest version of the most widely used PPM software.PROJECT MANAGEMENT SOFTWARE REVIEWSFigure A-1 provides a screen shot showing the top ten project management softwareproducts based on a June 2009 review by TopTenREVIEWS . That was the last year thata review was provided of non-online PPM software. Most PPM tools now offer totally onlineversions, including Project 2013.TopTenREVIEWS , “Project Management Software,” eviews.com)1(accessed June 17, 2009).FIGURE A-1Top ten project management software product comparisonsA.3
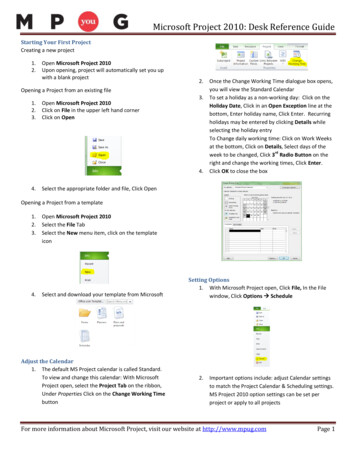
Appendix AA.4The products listed in the top ten include:1.2.3.4.5.6.7.8.9.10.Microsoft ProjectMindViewProject KickStartRationalPlan Multi ProjectFastTrack ScheduleService Desktop ProMilestonesMinuteManFusionDesk ProfessionalVIP Team To Do ListNotice that Microsoft Project is number one on the list. Also notice its steep price backin 2009 of over 500 for a single user. Remember that students can purchase MicrosoftProject and other software at greatly reduced rates from sites such as www.journeyed.com.You can also download a free trial of Project 2013 Professional (not Project Online, whichcost 45 per user per month without an annual subscription, as of April 2013) and othersoftware products or access them remotely via the Internet with your school’s softwarelicense. Check with your school’s IT department for more information.Below are descriptions of the criteria for comparing the software products: Collaboration: How information and issues are communicated with projectteam members, including email, conference calls, meetings, web-based locations, and more. Collaboration should be easy to use.Resource Management: Project management software should manage andcontrol the resources needed to run a project, such as people, money, time,and equipment.Project Management: The process, practice, and activities needed to performcontinuous evaluation, prioritization, budgeting, and selection of investmentsare key. Proper project management capabilities provide the greatest valueand contribution to the strategic interest of your company.Ease of Use: All project management software has a learning curve, but thebest have functions that are easy to find and simple enough for anyone to usefrom Day 1, Project 1.Help/Support: Project management software should offer a comprehensiveuser guide and help system. The manufacturer should provide emailaddresses or telephone numbers for direct answers to technical questions.1 In addition to reviewing project management software in general, TopTenREVIEWS also compared online products in a separate category. These products require an Internetconnection for use. Figure A-2 lists the top ten results for 2013.The top ten products listed include:1.2.3.4.5.6.7.ClarizenGenius ProjectDaptivTenroxCeloxisProject InsightAtTask
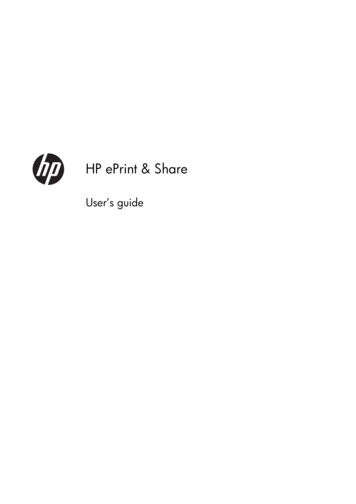
Guide to Using Microsoft Project 2013A.5TopTenREVIEWS , “Best Online Project Management Comparisons,” views.com/) (accessed April 7, 2013).FIGURE A-2Top ten online project management product comparisons28. EPM Live9. Liquid Planner10. Easy Projects.netTopTenREVIEWS only listed online project management tools in 2013, and theirreview was done before Microsoft’s Project Online was released. Tools in this list providethe ability to create Gantt charts, numerous reports and views, project dashboards, andintegrate with Microsoft Project files. See End Note 2 or visit the Web sites for any of theseproducts and use a free trial version. Also note that there are many other tools available.BASIC FEATURES OF PROJECT MANAGEMENT SOFTWAREWhat makes project management software different from other software tools? Why notjust use a spreadsheet or database to help manage projects?You can do a lot of project management planning and tracking using non-projectmanagement software. You could use a simple word processor to list tasks, resources,
Appendix AA.6dates, and so on. If you put that information into a spreadsheet, you can easily sort it,graph it, and perform other functions. A relational database tool could provide even moremanipulation of data. You can use email and other tools to collaborate with others.However, project management software is designed specifically for managing projects,so it normally includes several distinct and important features not found in other softwareproducts: Creating work breakdown structures, Gantt charts, and network diagrams:A fundamental concept of project management is breaking down the scope ofthe project into a work breakdown structure (WBS). The WBS is the basis forcreating the project schedule, normally shown as a Gantt chant. The Ganttchart shows start and end dates of tasks as well as dependencies betweentasks, which are more clearly shown in a network diagram. Project management software makes it easy to create a WBS, Gantt chart, and network diagram. These features help the project manager and team visualize the projectat various levels of detail.Integrating scope, time, and cost data: The WBS is a key tool for summarizingthe scope of a project, and the Gantt chart summarizes the time or schedulefor a project. Project management software allows you to assign cost and otherresources to tasks on the WBS, which are tied to the schedule. This allows youto create a cost baseline and use earned value management to track projectperformance in terms of scope, time, and cost in an integrated fashion.Setting a baseline and tracking progress: Another important concept ofproject management is preparing a plan and measuring progress againstthe plan. Project management software lets you track progress for each task.The tracking Gantt chart is a nice tool for easily seeing the planned andactual schedule, and other views and reports show progress in other areas.Providing other advanced project management features: Project management software often provides other advanced features, such as setting up different types of scheduling dependencies, determining the critical path andslack for tasks, working with multiple projects, and leveling resources. Forexample, you can easily set up a task to start when its predecessor is halfwayfinished. After entering task dependencies, the software should easily showyou the critical path and slack for each task. You can also set up multipleprojects in a program and perform portfolio management analysis with someproducts. Many project management software products also allow you toeasily adjust resources within their slack allowances to create a smootherresource distribution. These advanced features unique to project management are rarely found in other software tools.As you can see, there are several important features that are unique to project management software that make them worth using. Next you’ll learn what’s new in Project2013 and how to use its basic features.WHAT’S NEW IN PROJECT 2013If you are familiar with Project 2010 or an earlier version, it may be helpful to reviewsome of the new features in Project 2013.
Guide to Using Microsoft Project 2013 Improved reports: With Project 2013, you can create professional reports andadd pictures, charts, animation, and links to clearly share project statusinformation. An entirely new set of pre-installed reports are available, including burndown reports, a popular chart used for agile projects. The earnedvalue chart is also much easier to create.New collaboration features: You can stay in touch with team members bygetting progress updates, asking questions, or having strategy discussions, allwithout leaving Project 2013. You can hover over a name and start an IMsession, video chat, email, or phone call. You must have Lync 2010 or laterinstalled to take advantage of this feature.Task paths: You can now highlight any task and see its task path. All of thetask’s predecessor tasks show up in one color, and all of its successor tasksshow up in another color.Extended dates: You can set task and project dates up to 12/31/2149.Shared meetings: If you export Project 2013 reports, timelines, or data toother Office programs, you can use the new sharing feature to join onlinemeetings, share your PowerPoint slides, Word documents, Excel spreadsheets, and OneNote notes from any supported device, even if Office isn’tinstalled.Cloud storage: You can easily save files to your own SkyDrive or to yourorganization’s shared site. From there you can access and share your filesfrom Project 2013 and other Office applications. Note that Project Online isdelivered through Office 365 and used totally online.Easy access: If you have Project Online, Windows 7 (or later), and an Internet connection, you can access a full version of Project from any location,similar to the new Office applications.Next, you will learn some basic information about Project 2013 and explore the mainscreen elements and Help facility.USING PROJECT 2013Before you can use Project 2013 or any project management software effectively, youmust understand the fundamental concepts of project management, such as creatingwork breakdown structures (WBS), linking tasks, entering duration estimates,assigning resources, and so on. The purpose of this text is to provide specific instructions for using Project 2013 Professional. Consult Microsoft’s Web site for detailedinformation on other products and other resources to help you understand projectmanagement concepts.Before You BeginThis appendix assumes you are using Project 2013 with Windows 7 (or later) and arefamiliar with other Windows-based applications. Check your work by reviewing the manyscreen shots included in the steps, or by using the solution files that are available fordownload from the companion Web site or from your instructor.A.7
Appendix AA.8NOTEYou need to be running Windows 7 or later to use Project 2013, a 1 Ghz or greater x86/x64 processorwith SSE2 instruction set, 1 GB RAM (32 Bit) / 2 GB RAM (64 Bit), and an up-to-date browser. Certainfeatures require Internet connectivity. You can read more detailed system requirements and download afree trial from www.microsoft.com/project. Students can purchase a full version from sites like www.journeyed.com at a discount. Many colleges and universities provide the software to students either oncampus or through remote access. If you can use remote access, the main requirement is Internet connectivity. Check with your instructor for details. You might also want to pay for monthly access to ProjectOnline.This appendix uses a fictitious project—Project Aþ—to illustrate how to use the software. The WBS for Project Aþ uses the five project management process groups as level 2items (initiating, planning, executing, monitoring and controlling, and closing). Standarddeliverables under each of those process groups are included. Each section of the appendix includes hands-on activities for you to perform.NOTETo complete some of the hands-on activities in the appendix, you will need to download files from thecompanion Web site (www.intropm.com) to your computer. When you begin each set of steps, makesure you are using the correct file. Save the files you create yourself in a different folder so you do notwrite over the ones you download.In addition, you will create the following files from scratch as you work through thesteps: mywbs.mppmyschedule.mppYou will also use the following file to create a hyperlink: stakeholder register.docUsing the 60-day Trial of Project 2013If you plan to download the free trial, perform the following steps:1.2.3.Go to www.microsoft.com/project and click the Try on button under ProjectProfessional 2013.Enter your account information. You do need a Microsoft account. It used tobe called a Windows Live account, so you may already have one if you set itup for Xbox 360, SkyDrive, Office 2013, Office 365 or other items. If you donot have a Microsoft account, set one up for free.Install Project 2013. The installation for Project 2013 is a bit different frompast installations. Microsoft has you download some software (an image file)and then burn it to a CD or hard drive. You then run the software to installthe 60-day trial. Be sure to save the product key Microsoft provides and enter
Guide to Using Microsoft Project 2013it when prompted, and select the automatic upgrade. The trial software is runthrough Microsoft’s online environment, similar to Office 365.Next you will learn how to start Project 2013, review the Help facility and a templatefile, and begin to plan Project Aþ.Overview of Project 2013The first step to mastering Project 2013 is to become familiar with the major screen elements and the Help facility. This section describes each of these features.Starting Project 2013 and Getting StartedTo start Project 2013:1.2.Open Project 2013. There are slightly different methods for opening Project2013 depending on your operating system. For example, in Windows 7, clickthe Start button on the taskbar, and then click Project 2013 or type it in thesearch bar. Alternatively, a shortcut or icon might be available on the desktop; in this case, double-click the icon to start the software.Review the Get Started feature. Click Get Started, as shown in the upperright section of Figure A-3.Created using Microsoft Project, used with permission from Microsoft.FIGURE A-3Project 2013 initial options – access Get StartedA.9
Appendix AA.103.Start the introduction. Click Create, and then click Start, as shown in Figure A-4.Created using Microsoft Project, used with permission from Microsoft.FIGURE A-44.Project 2013 Get Started introductory screenReview the “4 simple steps” Microsoft lists for using Project 2013. Reviewthe first step, called Schedule your work, as shown in Figure A-5. Review theother steps by clicking Next, as shown in Figures A-6–A-8.Created using Microsoft Project, used with permission from Microsoft.FIGURE A-5Schedule your work screen
Guide to Using Microsoft Project 2013A.11Created using Microsoft Project, used with permission from Microsoft.FIGURE A-6Create a timeline screenCreated using Microsoft Project, used with permission from Microsoft.FIGURE A-7Report on progress screen
Appendix AA.12Created using Microsoft Project, used with permission from Microsoft.FIGURE A-85.Collaborate with your team screenExplore Help features. The last screen of Getting Started, Learn More, asshown in Figure A-9, provides links to the Project 2013 Getting StartedCenter (which includes a short video on what’s new that is worth watching)and the Project blog. The help feature (question mark in the upper right ofthe screen) also includes a lot of helpful resources.Created using Microsoft Project, used with permission from Microsoft.FIGURE A-9Learn More screenUnderstanding the Main Screen ElementsTo open a blank file:1.2.Open a blank file. Click the File tab, New, and then click the first option,Blank Project.Examine the main screen. Review the main screen elements, as shown inFigure A-10. Look at some of the elements of the screen.
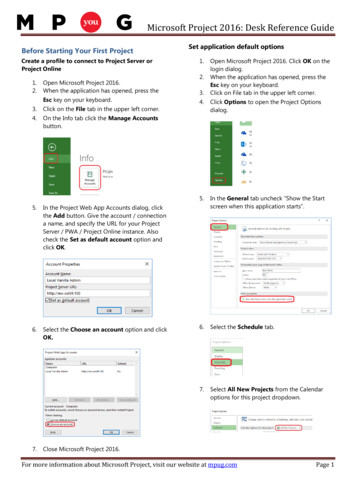
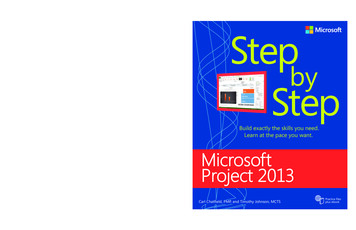
Guide to Using Microsoft Project 2013IndicatorscolumnTabsEntrytableGantt chart view(default view)Quick AccessToolbarRibbonTimelineSplit barManual/automaticschedulingCreated using Microsoft Project, used with permission from Microsoft.FIGURE A-10Project 2013 main screen The Ribbon, tabs, and Quick Access toolbar are similar to other Officeapplications.The timeline view is displayed below the ribbon.The default manual scheduling for new tasks is on the lower left of thescreen. You can click that option to switch to automatic scheduling.The default view is the Gantt chart view, which shows tasks and otherinformation as well as a calendar display. You can access other views byclicking the View icon on the far left side of the ribbon.The areas where you enter information in a spreadsheet-like table arepart of the Entry table. For example, you can see entry areas for TaskName, Duration, Start, Finish, and Predecessors.You can make the Entry table more or less wide by using the Split bar.When you move the mouse over the split bar, your cursor changes to theresize pointer. Clicking and dragging the split bar to the right revealscolumns for Resource Names and Add New columns.The first column in the Entry table is the Indicators column. The Indicators column displays indicators or symbols related to items associatedwith each task, such as task notes or hyperlinks to other files. The second column displays if a task is manually or automatically scheduled, asdescribed later in this appendix.The file name displays centered at the top of the screen. When you open aBlank Project after starting Project 2013, it opens a new file named Project1,which is shown in the title bar. If you open a second Blank Project, thename will be Project2, and so on, until you save and rename the file.A.13
Appendix AA.14Using Project Help and the Project Web SiteTo access information to help you learn how to use Project 2013:1.Access Project Help. Click the question mark/help icon on the upper side ofthe ribbon. The Project Help screen displays, as shown in Figure A-11.Remember that this feature requires an Internet connection.Created using Microsoft Project, used with permission from Microsoft.FIGURE A-112.3.Topics under Project helpExplore various help topics Click the Project Help link called “What’s newwith Project 2013.” Microsoft provides short videos, steps, templates, articles, and other features to help you learn to use this powerful software.Watch the short video, read the other information on the page, and explorelinks for more help.Close Project 2013. Click the Close icon (X in the upper right of the screen)to exit Project 2013.Many features in Project 2013 are similar to ones in other Windows programs. Forexample, to collapse or expand tasks, click the appropriate symbols to the left of the taskname. To access shortcut items, right-click in either the Entry table area or the Ganttchart. Many of the Entry table operations in Project 2013 are very similar to operationsin Excel. For example, to adjust a column width, click and drag between the columnheading titles.
Guide to Using Microsoft Project 2013Next, you will get some hands-on experience by opening an existing file to explorevarious screen elements. Project 2013 comes with several template files, and you can alsoaccess templates from Microsoft Office Online or other Web sites.EXPLORING PROJECT 2013 USING AN EXISTING FILETo open a template file and adjust Project 2013 screen elements:1.Note IndicatorOpen Project 2013 and select the Customer Service template file. Click theStart button on the taskbar, select Project 2013, click Customer Service, andthen click Create. These screen shots were taken on April 3, 2013, so youcan enter that date if you like. Your screen should resemble Figure A-12.(Note: If you cannot find the template, you can download it from www.intropm.com and open it. To open an existing file, click the File tab, thenselect Open, and browse to find the file.)Widen ColumnSplit BarTimeline NotesCreated using Microsoft Project, used with permission from Microsoft.FIGURE A-122.3.Customer Service template fileWiden the Task Name column. Move the cursor between the Task Name andDuration columns, and then double-click to widen the Task Name column soall of the text shows in one line.Move the Split Bar. Move the Split Bar to the right so the entire Task Namecolumn text is visible, but not the Duration column. The default table view isthe Entry table.A.15
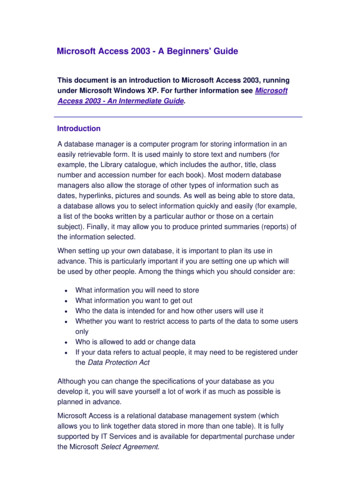
Appendix AA.164.View the first Note: Move your cursor over the yellow Notes symbol in theIndicators column for Task 1 to read it. You can insert notes by any task.To show different WBS levels:1.2.Expand/Collapse SymbolSelect Outline Level 1 to display WBS level 2 tasks. Click the View tab andthen the Outline button’s list arrow, and then click Outline Level 1. Noticethat only the level 2 WBS items display in the Entry table. The black bars onthe Gantt chart represent the summary tasks. Recall that the entire projectis normally referred to as WBS level 1, and the next highest level is calledlevel 2.Adjust the timescale. Click the Zoom out button (minus sign) on the left sideof the Zoom slider on the lower right of the screen, as shown in Figure A-13.Notice the milestone task in row 143 indicating the project completion date.Recall that the black diamond symbol on a Gantt chart shows milestones.OutlineSummary TasksTimelineMilestoneZoom outCreated using Microsoft Project, used with permission from Microsoft.FIGURE A-133.Showing part of the WBS on the Gantt chartExpand a task. Click the expand symbol to the left of Task 2, Initial Assessment, to see its subtasks. Click the collapse symbol to hide its subtasks.Experiment with expanding and collapsing other tasks and resizing othercolumns.
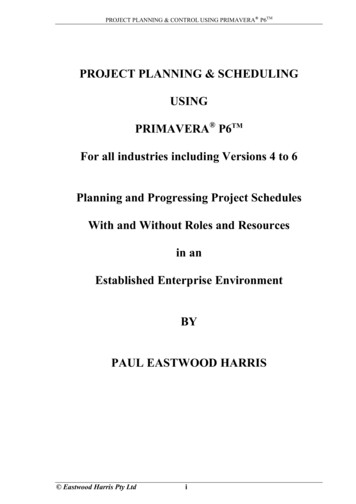
Guide to Using Microsoft Project 20134.5.6.View all tasks. Click the Outline button and select All Subtasks to see all ofthe items in the Task Name column again.Remove the Timeline. Click the Timeline checkbox on the Ribbon to unselectit. Click it again to display it.Close the file without saving. Click the Close icon in the upper right of thewindow, and select No when prompted to save the file.Project 2013 ViewsProject 2013 provides many ways to display or view project information. In addition tothe default Gantt chart, you can view the network diagram, calendar, and task usageviews, to name a few. These views allow you to analyze project information in differentways. The View tab also provides access to different tables that display information invarious ways. In addition to the default Entry table view, you can access tables that focuson data related to areas such as the Schedule, Cost, Tracking, and Earned Value.To access and explore different views:1.Explore the Network Diagram for the Customer Service file. Open theCustomer Service file again. Click the Network Diagram button under theView tab, and then move the Zoom slider on the lower right of the screenall the way to the left. Your screen should resemble Figure A-14. Criticaltasks display in red.Network DiagramZoom sliderCreated using Microsoft Project, used with permission from Microsoft.FIGURE A-14Network diagram view of Customer Service fileA.17
Appendix AA.182.3.Explore the Calendar view. Click the Calendar button (under the NetworkDiagram button). Notice that the screen lists tasks each day in a calendarformat.Change the table view. Click the Gantt Chart button on the ribbon, click theTables button under the View tab, and then click Schedule. Figure A-15shows the table view options.Created using Microsoft Project, used with permission from Microsoft.FIGURE A-154.Table view optionsExamine the Schedule table and other views. Select the Schedule table viewand move the Split bar to the right to review the Total Slack column. Noticethat the columns in the table to the left of the Gantt chart, as shown inFigure A-16, now display more detailed schedule information, such as LateStart, Late Finish, Free Slack, and Total Slack. Remember that you canwiden columns by double-clicking the resize pointer to the right of that column. You can also move the split bar to reveal more or fewer columns.Experiment with other table views, then return to the Entry table view.
Guide to Using Microsoft Project 2013A.19Created using Microsoft Project, used with permission from Microsoft.FIGURE A-16Schedule table viewProject 2013 ReportsProject 2013 provides many ways to report project information as well. In addition to traditional reports, you can also prepare visual reports, with both available under the Reporttab. Note that the visual reports often require that you have other Microsoft applicationsoftware, such as Excel and Visio. Project 2013 automatically formats reports for ease ofprinting.To access and explore different reports:1.2.Explore the Reports feature. Click the Report tab to see the variety of reportsavailable in Project 2013.View the Project Overview report. Click Dashboards, and then click ProjectOverview. Review the report and new options on the ribbon, as shown inFigure A-17.
Appendix AA.20Created using Microsoft Project, used with permission from Microsoft.FIGURE A-173.Project Overview reportOpen the Resource Overview report. Click the Report tab again, clickResources, and then click Resource Overview. Review the report, as shownin Figure A-18.Created using Microsoft Project, used with permission from Microsoft.FIGURE A-18Resource Overview report
Guide to Using Microsoft Project 20134.5.Examine the report and experiment with others. Click the Report tab, clickIn Progress, and then click Critical Tasks to display the Critical Tasks report,as shown in Figure A-19. Examine other reports.Return to the Gantt chart. Click the View tab, and then click Gantt Chart toreturn to the Gantt chart view. You can close the file without saving it if youwish to take a break.Created using Microsoft Project, used with permission from Microsoft.FIGURE A-19Critical tasks reportProject 2013 FiltersProject 2013 uses a relational database to filter, sort, store, and display information. Filtering project information is very useful. For example, if a project includes thousands oftasks, you might want to view only summary or milestone tasks to get a high-level view ofthe project by using the Milestones or Summary Tasks filter from the Filter list. You canselect a filter that shows only tasks on the critical path if that is what you want to see.Other filters include Completed Tasks, Late/Overbudget Tasks, and Date Range, whichdisplays tasks based on dates you provide. As shown earlier, you can also click the Showbutton on the toolbar to display different levels in the WBS quickly.To explore Project 2013 filters:1.Access filters. Click the View tab, if necessary, and make sure the CustomerService file is in the Gantt Chart: Table Entry view. Click the Filter list arrow(under the Data group), as shown in Figure A-20. The default filter is No Filter, which shows all tasks.A.21
Appendix AA.22Filter list arrowCreated using Microsoft Project, used with permission from Microsoft.FIGURE A-202.3.4.5.Using a filterFilter to show milestones. Click Milestones in the list of filters. Notice thatthe Gantt chart only shows the summary tasks and milestones for the project. Your screen should resemble Figure A-21. Recall that milestones are significant events.Show critical tasks. Select No Filter from the Filter list box to rev
published as a stand-alone book on May 2, 2013 and as an appendix in Kathy Schwalbe’s Healthcare Project Management (co-authored with Dan Furlong) and Revised An Intro-duction to Project Management, Fourth Edition. Note 2: This guide was written using the free trial of Microsoft Office