Transcription
Paper ID #25816Tolerance Stack-up Analysis in Manufacturing-Based Capstone ProjectsDr. Mustafa Shraim, Ohio UniversityDr. Mustafa Shraim is an Assistant Professor in the Department of Engineering Technology & Management at Ohio University in Athens, Ohio. He received both of his B.S. and M.S. degrees from OhioUniversity in 1986 and 1989, respectively. He received his Ph.D. in Industrial Engineering from WestVirginia University in 1996.Dr. Shraim’s research interests are in the area of quality engineering. Specifically, they cover Lean/ Six Sigma methods and including incorporating experimental design to optimize operations. Otherresearch interests include the Deming System of Profound Knowledge (SoPK), developing continuousimprovement programs as well as sustainable management systems based on ISO 9001, ISO 14001, andother international standards.He has over 20 years of industrial experience in the quality management field as a quality engineer,corporate quality manager, consultant and trainer. His experience is extensive in quality managementsystems as wells as Lean and Six Sigma methods. In addition, he coached and mentored Green & BlackBelts on process improvement projects in the manufacturing and service industries.Dr. Shraim is a Certified Quality Engineer (CQE) & a Certified Six Sigma Black Belt (CSSBB) by TheAmerican Society for Quality (ASQ). He is also a certified Quality Management Systems (QMS) LeadAuditor by the International Register of Certificated Auditors (IRCA) in London. He was elected a Fellowby ASQ in 2007.Dr. Neil Littell, Ohio UniversityDr. W. Neil Littell is an Assistant Professor at Ohio University within the Russ College of Engineeringin the department of Engineering Technology and Management. Dr. Littell earned a Doctorate of Philosophy in Instructional Systems and Workforce Development (2013) from Mississippi State University.Dr. Littell also received a Masters in Technology from Mississippi State University (2005). Additionally, he holds Bachelor of Science degrees in both Industrial Technology and Trade and Technical Studiesfrom Mississippi State University (2004). Dr. Littell also has an Associate of Applied Science degree inDrafting and Design from Holmes Community College (2002).Dr. Littell is an accomplished manager with more than 10 years of experience providing results-orientedleadership. His previous positions include the PLM Coordinator at the Center for Advanced VehicularSystems at Mississippi State University from 2004-2008. He was Director at Large for COE, the World’slargest users group of Dassault Systemès PLM products from 2008 to 2012, where he was acknowledgedwith the BJ Fries Award of Merit for making balanced contributions to the organization’s activities andgrowth. His most recent position was as the Engineering Program Manager and CAD/PLM Administratorat Viking Range LLC, located in Greenwood, Mississippi from 2008 to May 2014.c American Society for Engineering Education, 2019
Tolerance Stack-up Analysis in Manufacturing-Based Capstone ProjectsAbstractMost manufactured products typically consist of multiple components assembled in specifiedconfigurations. Such components have specifications for important dimensional characteristics toensure adequate performance once assembled. The specifications are typically given astolerances within which components must be produced. Consequently, parts produced outsidethe specifications are rejected and not used in the assembled product. As dimensional variation isto be expected in produced components, it may accumulate, or stack up, to cause unwantedvariation in the assembled product. When this happens, additional costs in scrap and reworkwould result and may extend to warranty charges and customer dissatisfaction shouldunacceptable products find their way to the customer.In this paper, issues resulting from tolerance stack-up in capstone production will be addressed.The questions this paper will attempt to answer are: (1) Are students aware of the impact oftolerance stack-up in product development, and (2) What can be done to minimize the potentialeffects of tolerance stack-up before product launch.IntroductionA tolerance is defined as the range of acceptable variance from the nominal value of adimensional characteristic while still allowing the part to fulfill its functional requirements. Thisconcept is relatively straightforward for engineers, technicians, and students to understand, thephenomenon of tolerance stacking is not as easily understood. Tolerances might be expressedbilaterally (in both positive and negative directions from the nominal dimension) or unilaterally(in only one direction from the nominal dimension). In general parts with greater dimensionaltolerances allow companies to manufacture parts less expensively, because the dimensionalrequirements can be fulfilled using less precise tooling and equipment.During the engineering design phase of the new product development process, design engineersdevelop the three-dimensional computer aided designs (CAD) for a product. This geometry isdesigned at nominal dimensions, that is, the system of parts is digitally designed based ontheoretically perfect parts. However, the implementation of perfect parts is not reasonablebecause of myriad reasons and therefore the design engineers must develop a tolerance. Thistolerance is generally determined by two things: 1.) Part functionality and 2.) process capability.To be successful, design engineers must respect the process capability of their company orsupplier, or they risk specifying parts that are expensive due to tolerances which are tooconstraining [1] [2] [3].Just as parts have standard tolerances, assemblies comprised of those parts have a tolerance aswell. The total tolerance for the assembly is directly driven by the tolerances of the parts whichcomprise the assembly. For example, if the assembly were comprised of parts which are all at theupper end of their total tolerance, the assembly might not function as intended. Therefore, design
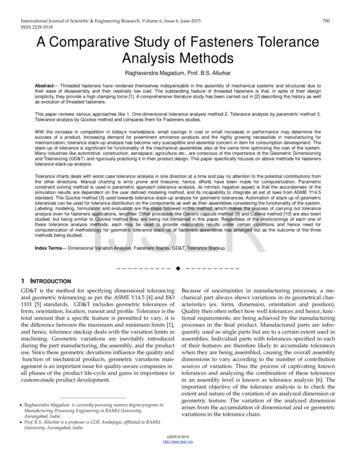
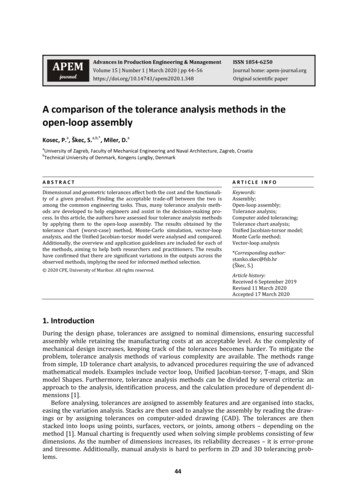
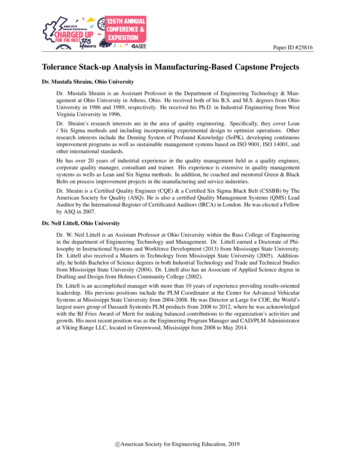
engineers must be mindful of the total tolerance with respect to the assembly. This phenomenonis known as tolerance stacking. However, the implementation of a proactive plan to avoidproduction issues caused by assemblies which are out of tolerance due to tolerance stacking isnot as straight forward to understand because the effects of tolerance staking are a result ofinteractions between parts. Once production begins, this problem is further compounded becauseof interactions across parts with respect to process capability [2].Perhaps the easiest way for designers to combat the possibility of tolerance stack interactions isby using the worst-case method of tolerance stack analysis. When completing this type ofanalysis, the designer considers the extreme conditions of every part involved in the assembly.For example, if each part in an assembly is at the upper end of the tolerance; would the assemblystill function with respect to the designed requirements? Alternatively, the designer couldconsider the situation where all parts are at the lower end of their tolerance and ask the samequestion. While this is perhaps the easiest way to perform tolerance stack analysis, it is not themost efficient from a perspective of cost savings. The worst-case scenario for tolerance stackanalysis also assumes that if an assembly functions at both ends of the spectrum (largest andsmallest) the middle will take care of itself [1]. In reality, the performance of an assembly ofparts may be significantly degraded as it approaches either the upper or lower end of thetolerance spectrum. Design engineers must be careful communicating the concept of totaltolerance of an assembly to avoid the perception that product performance is equal across thetolerance spectrum [4]As an example, refer to Figure 1. All of the example parts in this illustration have a standardtolerance of .015. This means that the largest vertical dimension of PART A could be 2.015,while the smallest acceptable vertical dimension of PART A could be 1.985. When this bilateraltolerance of .015 is applied across the system (assembly) of parts, one can see the stackingeffect of the part tolerances against the total tolerance. In this case, the worst case (largest)tolerance of the assembly is 10.000 .015 .015 .015 .015 .015 10.075, while the worst case(smallest) tolerance of the assembly is 10.000-.015-.015-.015-.015-.015 9.925, Therefore, thetotal tolerance range of this assembly is 9.925 -10.075 or 10.000 .075. This is achieved witheach part involved in the assembly being within the part tolerance.Figure 1: Tolerance Stack IllustrationAs companies seek to produce parts of high quality as well as lower costs, the tolerances of partsbecome a driver of both cost and quality. Additionally, different configurations of parts maydrive tighter tolerances because of requirements within different applications using the same
part, further compounding production issue. As companies design products with advancedfeatures and shorter design cycles, the role of tolerance stacking becomes a more urgent matterfor design engineers to address early in the design lifecycle [5].Researchers have explored tolerance stack-up analysis using different methods or a combinationof methods. In addition to the conservative method of worst case (WC) method, the root sumsquares (RSS) which started in the 1950s continued to be explored for a variety of stack-upconditions and modifications. M. Spotts suggested adding a safety factor by averaging the RSSand WC methods [5]. Additional RSS models were suggested by others to account for mean shiftduring production [6] [7]. Since the RSS assumes that component data follows normaldistribution, more research was conducted for data that follow other distributions such as, but notlimited to, uniform distribution, triangular distribution [8] [9] [10].This study seeks to explore student understanding of the role of tolerances as a component oftheir educational experience at a Midwestern university within an engineering technologyprogram. Students in the capstone course are often engaged in designing products that areassembled of several components. In some cases, components are chained together and couldcreate some issues for fit and function for the assembled product should the potential ofaccumulation of variation be ignored. As a result of this paper, a process for conductingtolerance stack-up analysis will be developed and tested with students to determine itseffectiveness.Methodology DevelopmentOnly two popular alternatives are introduced in this study; the WC and RSS. Generally,engineers and designers would rather have tight tolerances to ensure fit, function and betterquality of the assembled product. On the other hand, the aim of manufacturing is to introduceproducts so tight tolerances may cause issues when variation exists in the process.As shown in Figure 1, the five components (A, B, C, D, and E) are assembled together create thefinal product. If the worst-case scenario is used, the assembled product would be assumed tohave as large of the tolerance as the sum of the individual tolerances or 0.075 inches. If thedesigner would like to keep the tolerance as 0.050, then tighter tolerances for componentswould be sought. If this is applied to all components equally over the five assembledcomponents, then the tolerance of each component will have to be set to 0.010 inches whichwould increase the cost of components, perhaps unnecessarily.Using the RSS method, the variation of the assembled product is calculated using the squaredvalues of the individual components. Let Ti denotes the individual tolerance, the assembledtolerance, TA, can be given by Equation 1.𝑇 𝑇(1)To illustrate, consider the example in Figure 1 where the individual tolerances are 0.015 inchesfor each of the five components. The assembly tolerance can be calculated to be 0.034 inchesusing Equation 1 by taking the square root of the sum of squared tolerances. Compare this to the
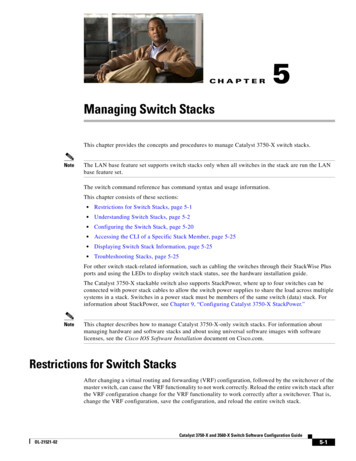
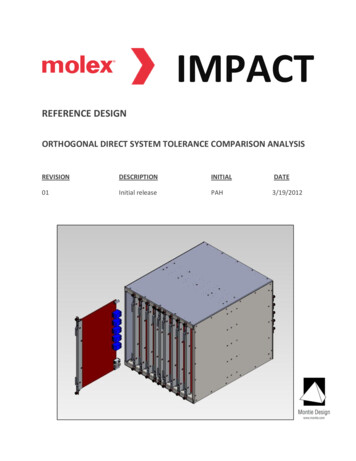
assembly tolerance obtained by WC method of 0.075. Assuming the designer’s tolerance of 0.050, it is within the desired limits.While WC method is non-statistical in nature, the RSS method is based on the normaldistribution with the variation expressed in units of standard deviations (σ). The normaldistribution spread is based on adding / subtracting three standard deviations on each side of themean (μ) or ( 3σ) which would include 99.73% of the data (Figure 2).Figure 2: Normal DistributionIn tolerance stack analysis, a reliable estimate of the standard deviation of each of the chainedcomponents will be needed. This can be accomplished using one of the following methods:1. Production data: This is the most reliable method as the standard deviation may becalculated from available data which may be in the form of inspection records orstatistical process control (charts).2. Similar products using the same process: When a new product is being introduced withno production data history, it may be necessary to see how similar products performedover time.3. Engineering tolerances: This method is commonly used to determine the assemblytolerance. Two-sided specifications are equated to the process spread to estimate thevariation. For a symmetrical tolerance, one side of the tolerance is equated to threestandard deviations. This also depends on the capability desired for the assembledproduct.It should be noted here that in many cases, some components of the assembly may already beutilized as components in other assemblies. Therefore, production data for those componentsmay already be available. Therefore, the use of a combination of the above methods is alsopossible.Whenever available, estimating variation from available data is preferred given that the processis stable. Absence of process stability (having special causes of variation) may cause problems in
reliably predicting process performance over time, at least in the foreseeable future [11]. Whendata from similar products engineering tolerances are utilized, validation of data should occurusing a limited production run. Further validation and update of tolerances should occur whenfull production data is available as well.Once the component tolerances are reliably estimated, the analysis can be conducted toessentially answer two questions: (1) does the current assembly tolerance meet requirements?and (2) which components should be targeted to tighten tolerances if needed? To answer the firstquestion, the analysis of rejection fraction (or parts per million) may be performed using thestandard normal distribution. This should be done with some allowance for process mean shiftduring production of chained components. Utilizing the Six Sigma methodology in estimatingthe fraction nonconforming with 1.5 standard deviation allowable shift in the long run, the 4σcapability would result in a rejection rate of 6.7% or 66,807 defects per million opportunities(DPMO). This can be calculated using the standard normal distribution with Z 2.5 standarddeviations (4.0 -1.5). When the process is operating at the Six Sigma capability, it is actually atthe 4.5σ with the mean shift is accounted for and the rejection rate is 0.00034% or 3.4 DPMO.Table 1 displays other capability levels.The second question as to which components should be targeted to reduce variation is notobviously decided based on the variability contribution of each component to the overallassembly, but also other variables including costs. Methods for such allocations have beenintroduced in the literature as demonstrated by Chase et al [2]Table 1: Six Sigma Capability ScaleSigmaLevel3σ4σ5σ6σ% 4When variation is excessive in the components, it is reflected in the resulting assembly and afraction of which could be rejected. To improve performance of the process and reduce theoverall assembly variation, it is imperative to identify which components need to be tackled first.This can be achieved by calculating the contribution each component makes to the overallvariation using the variances. For example, to calculate the contribution of any of component,Equation 2 can be used:% 𝐶𝑜𝑚𝑝𝑜𝑛𝑒𝑛𝑡 𝐶𝑜𝑛𝑡𝑟𝑖𝑏𝑢𝑡𝑖𝑜𝑛 𝑥 100%(2)Once contribution for each component is known, order of improvement can be made based onsize of contribution as well as cost of improvement. This cost is not easy to determine given that
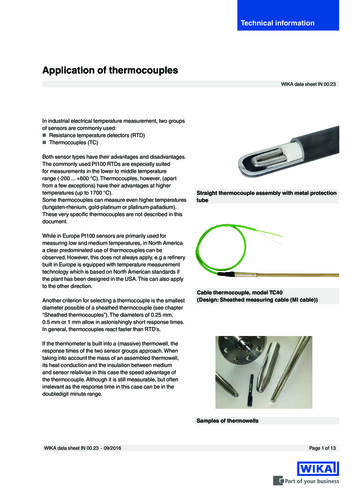
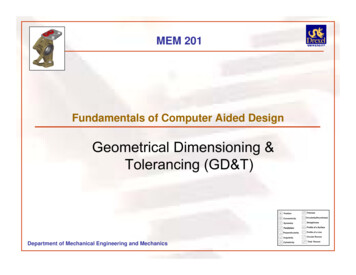
costs of dissatisfied customer may not be known. The plan-do-study-act (PDSA) continuousimprovement cycle can be used to as means for carrying out such improvements.Stack-up Analysis ProcessIn the preceding section, details about conducting tolerance stack-up analysis was presented. Theaim here is to develop a usable methodology for students when they perform stack-up analysis. Itbegins with identifying components and their chained characteristics on the overall (assembly)characteristic. The individual (component) means of the characteristics are added to determinethe overall mean. Similarly, using the RSS method, the variances are added to determine theoverall variance then standard deviation.The overall (assembly) variation can then be compared against the tolerance set by the customeror the designer to determine process capability. This will depend on the sigma scale (qualitylevel) of interest. If the process is not capable or the variation does not quite meet establishedcapability requirements, then process or product design changes may be necessary. If capabilityrequirements are met, the process ends. Figure 3 presents a flow diagram that students will use toensure that possible tolerance stack-up issues are resolved early in the product design phase. Asthe model shows, if no production data is available for the components, validation using initial orlimited production run can be performed to ensure that the estimated standard deviations weresimilar and process capability requirements are met.Figure 3: Proposed Stack-up Analysis Process
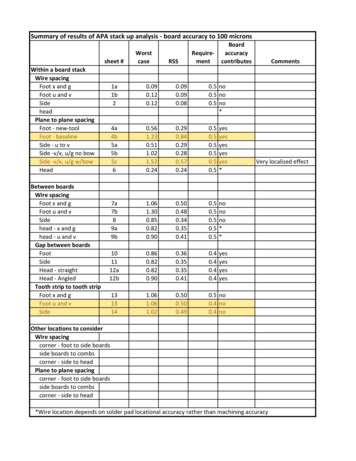
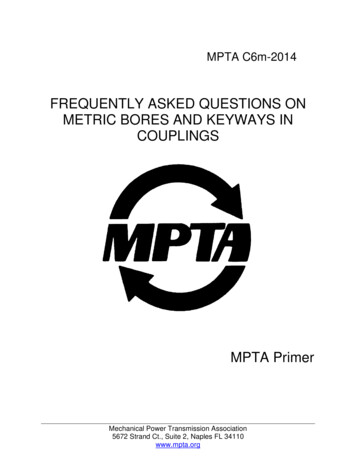
Figure 4: Determining Means & Standard DeviationsModel TestingThe aim of these tests is to validate the adequacy of the topic coverage and the provided model(flow diagrams) in guiding the students through tolerance stack-up analysis. The students weredivided into their capstone teams and asked to conduct tolerance analysis. Using the models inFigures 4 and 5 above, teams were asked to:1. Identify tolerance stack-up potential on their current projects. This will be carried out foreach team on the capstone projects2. Conduct tolerance stack-up analysis for the following cases:a. Case 1: Assembled components have both tolerances and production dataAn assembly is comprised of 3 components. The parts have been produced beforeand both production data and tolerances are available as shown in the Table 2.Perform tolerance stack-up analysis and make recommendations.Table 2: Case 1 Tolerance Analysis Data
b. Case 2: A combination of new components with tolerance only, similarcomponents with data, and in-production components with dataIf the assembly, comprised of 3 components, has only component A available andin production while components B and C are new. For part C, a similar productthat is slightly larger in size is producing a standard deviation of 0.009 inches(Table 3). Perform tolerance stack-up analysis and make recommendations.Table 3: Case 2 Tolerance Analysis DataEach of the five capstone project teams presented their analysis based on the two questionsasked. For the first question regarding potential tolerance stacking for the product beingdesigned, teams had their discussions and identified potential tolerance stacking then brieflypresented to the rest of the class. As for the second question with the two cases, studentsfollowed the model presented in the flowcharts of Figures 3 and 4: All teams conducted the analysis correctly:o For Case 1, they correctly used the current statistics provided from productiondata and not the tolerance.o For Case 2, they correctly used production data estimates for component A,tolerance estimates for component B, and similar product estimates forcomponent C.All but one team correctly identified % contribution of variation by each component forboth cases using Equation 2. One team used standard deviations instead of variances tomake the calculations which was incorrect.As a result, all teams made recommendations as to which component to target first tominimize the variation in assembly.Concluding RemarksAccounting for tolerance stacking in manufacturing is a critical skill for graduating engineers tohave. As a deliverable item of this study, the senior capstone course will be modified to include asection dedicated for tolerance stack-up analysis. This section will include coverage of the topic,including the process through the developed flow diagrams in this study. Their understanding ofthe concepts will be verified by working through a variety of cases. They will also identify anypotential tolerance stack-up in their capstone product.
Future work may include introducing Monte Carlo simulation techniques and compare againstthe proposed process. Additional work may include using the Taguchi loss function indetermining which components to target based on total cost to society.References[1] Sahani, A; Jain, P & Sharma S, “Geometrical Tolerance Stack Up Techniques”, Chapter 52in DAAAM International Scientific Book, pp. 857-872, 2013. B. Katalinic & Z. Tekic (Eds.),Published by DAAAM International, ISBN 978-3-901509-94-0, ISSN 1726-9687, Vienna,Austria, 2013[2] Kenneth W. Chase, William H. Greenwood, Bruce G. Loosli, Loren F. Hauglund, Least CostTolerance Allocation for Mechanical Assemblies with Automated Process Selection,Manufacturing Review Vol 3, No 1, pp 49-59, 1990.[3] He, J. R., and Gibson, P. R., “Computer-Aided Geometrical Dimensioning and Tolerancingfor Process-Operation Planning and Quality Control”, The International Journal of AdvancedManufacturing Technology, 7:11-20, 1992[4] Gavankar, P., and Bedworth, D., “Stacked tolerance analysis and allocation using assemblymodels”, Journal of Intelligent Manufacturing (1991) 2, 365-377, 1991[5] Spotts, M.F., "How to Use Wider Tolerances, Safely, in Dimensioning Stacked Assemblies,"Machine Design, pp. 60-63, April 1978.[6] Greenwood, W.H. and K.W. Chase, "A New Tolerance Analysis Method for Designers andManufacturers," J. of Engineering for Industry, ASME, v 109, pp. 112-116, May 1987[7] Greenwood, W.H. and K.W. Chase (1988a), "Worst Case Tolerance Analysis with NonlinearProblems," J. of Engineering for Industry, ASME, v 110, pp. 232-235, August 1988[8] Mansoor, E.M., “The application of probability to tolerances used in engineering design”,Proceedings of the Institution of Mechanical Engineers, 178 (1), 29–51, 1963[9] Gladman, C.A., “Applying probability in tolerance technology”, Transaction of theInstitution of Australian Mechanical Engineers, ME5 (2), 82–88, 1980[10] Chase, K., and Parkinson, A, “A Survey of Research in the Application of ToleranceAnalysis tothe Design of Mechanical Assemblies”, Research in Engineering Design, 3:23-37, 1991.[11] Deming, W. E. The New Economics. 3rd ed., Cambridge, MA: The MIT Press; 2018.
Tolerance Stack-up Analysis in Manufacturing-Based Capstone Projects Dr. Mustafa Shraim, Ohio University Dr. Mustafa Shraim is an Assistant Professor in the Department of Engineering Technology & Man-agement at Ohio University in Athens, Ohio. He received both of his B.S. and M.S. deg