Transcription
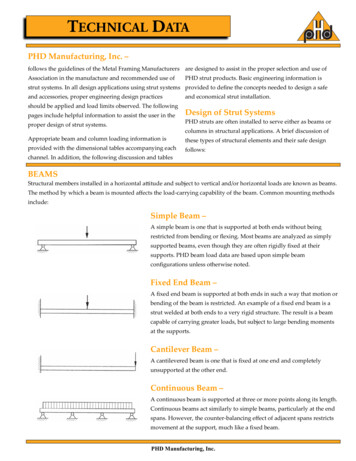
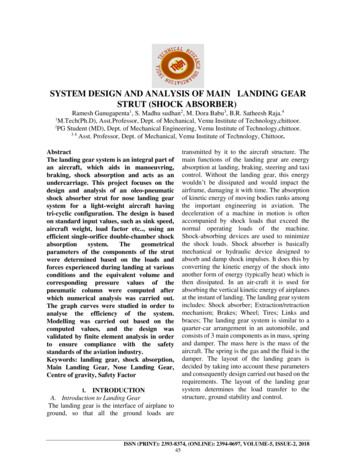
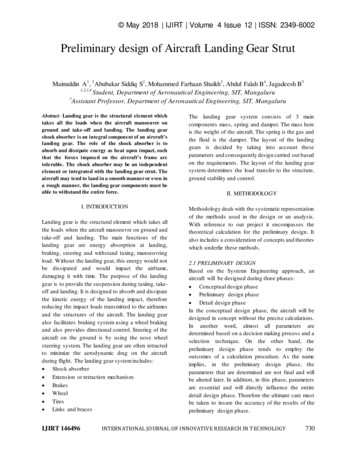
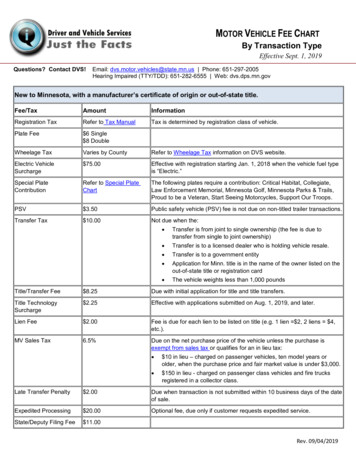
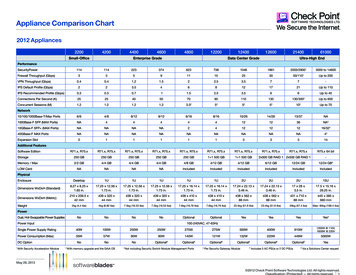
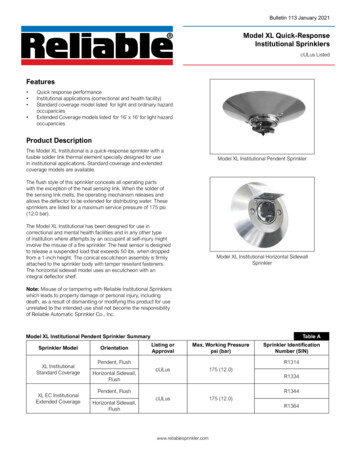
ACI STRUCTURAL JOURNAL TECHNICAL PAPERTitle No. 113-S68Strut Efficiency-Based Design for Concrete Deep BeamsReinforced with Fiber-Reinforced Polymer Barsby Khaled Mohamed, Ahmed Sabry Farghaly, and Brahim BenmokraneIn this paper, a strut-and-tie-based model is proposed to predict theshear strength of fiber-reinforced polymer-reinforced (FRP) deepbeams. An assessment of the available strut-and-tie models (STMs)in ACI and CSA provisions was conducted, identifying the importantparameters affecting the strut efficiency factor. The tendency of eachparameter (concrete compressive strength, shear span-depth ratio,and strain in longitudinal reinforcement) was assessed against theefficiency factor. The data from the 28 specimens with and withoutweb reinforcement, including 12 tested FRP-reinforced concretedeep beams in our study and 16 FRP-reinforced deep beams takenfrom the literature, were used to assess the proposed model. Themodel was capable of capturing the failure mode and predictingthe ultimate capacity of the tested FRP-reinforced deep beams. Theproposed model was verified against a compilation of databases on172 steel-reinforced deep beams, resulting in an acceptable levelof adequacy.Keywords: deep beams; efficiency factor; fiber-reinforced polymer (FRP)bars; shear strength; strut-and-tie model (STM).INTRODUCTIONDeep beams have relatively small span-depth ratios (a/d),so that shear strain becomes dominant. Hence, traditionalsectional design approaches based on plane sectional theoryis not applicable for the design of deep beams, in whichthe plane section does not remain plane, thereby requiringa different approach. In deep beams, externally appliedloads are transferred directly to the supports by strut action(MacGregor 1997). As a result, provisions—such as in ACIand CSA—recommend the use of strut-and-tie model (STM)for designing reinforced-concrete deep beams.The strut-and-tie model idealizes the complex flow ofstresses using a pin-jointed truss consisting of compressionstruts and tension ties, which allows for easier monitoring ofthe force flow (Schlaich et al. 1987). The STM can only beapplied to an element, however, if the truss model followsthe lower-bound theorem, under which the capacity of aSTM is always lower than the structure’s actual capacity.If the truss model is in equilibrium, the truss will exhibitthe deformation capacity required to redistribute the internalstresses and the stresses applied to the STM elements withintheir limit capacity.In practice, deep beams are commonly used whendesigning transfer girders or bridge bents. These elementsare exposed to aggressive environments in northern climates,which causes the steel bars to corrode. So, researchers haveexamined the use of fiber-reinforced polymer (FRP) insteadof steel as internal reinforcement in deep beams (Andermatt and Lubell 2013a,b; Farghaly and Benmokrane 2013).The tested FRP-reinforced deep beams demonstrated sufficient deformability to distribute the stresses according toACI Structural Journal/July-August 2016the STM. CSA S806 (2012) introduced the STM for FRPreinforced deep beams, which is the same model specified inCSA A23.3 (2014) for steel-reinforced deep beams, althoughthe STM was not used in ACI 440.1R (2006). Therefore, ourstudy aimed at assessing the factors affecting the efficiencyof the concrete strut and at developing a new STM based onthe tested FRP-reinforced deep beams.RESEARCH SIGNIFICANCEThe strut-and-tie design models provided in ACI 318(2011) and CSA S806 (2012) provisions were assessed andfound to be unsatisfactory because they disregard the contribution of major strength-related parameters. The effect ofthe different strength-related parameters on the strut efficiency factor was assessed based on the experimental resultsin the literature and that from our experimental program. Anew strut efficiency factor for the STM-based procedure wasproposed and validated with the FRP- and steel-reinforceddeep beams.SUMMARY OF EXPERIMENTAL RESULTSTwelve full-scale reinforced-concrete deep beams entirelyreinforced with GFRP bars were constructed and tested tofailure under two-point loading with different shear spandepth ratios (a/d) of 1.47, 1.13, and 0.83. Figure 1(a) showsthe concrete dimensions and the reinforcement details ofthe tested specimens, while Fig. 1(b) provides the loadingsetup. The amount of web reinforcement was chosen tosatisfy ACI 318 (2011) and CSA S806 (2012) requirements.Tables 1 and 2 present the material properties and reinforcement details, respectively.The failure of all specimens was preceded by crushing inthe concrete diagonal strut, which is the typical failure ofdeep beams (Fig. 2). The tested specimens exhibited reasonable deflection levels compared to the available information found in the literature (Mihaylov et al. 2010) on steelreinforced deep beams with similar dimensions and reinforcement. The development of arch action was also confirmedthrough the almost constant strain distribution along thelongitudinal reinforcement length, as shown in Fig. 3.All web reinforcement configurations used in the testedspecimens yielded insignificant effects on the ultimatestrength, as given in Table 3. The test results were used toassess the STMs in ACI 318 (2011) and CSA S806 (2012).ACI Structural Journal, V. 113, No. 4, July-August 2016.MS No. S-2015-064.R2, doi: 10.14359/51688476, was received July 26, 2015, andreviewed under Institute publication policies. Copyright 2016, American ConcreteInstitute. All rights reserved, including the making of copies unless permission isobtained from the copyright proprietors. Pertinent discussion including author’sclosure, if any, will be published ten months from this journal’s date if the discussionis received within four months of the paper’s print publication.791
Fig. 1—Concrete dimensions, reinforcement details, and loading setup. (Note: Dimensions in mm; 1 mm 0.0394 in.)Table 1—Tensile properties of GFRP bars asreported by manufacturer*Bar diameter f*, mmNominalcross-sectionalarea Af, mm2Guaranteedtensile strengthffu†, MPaModulus ofelasticity Efrp,GPa13 (No. 4)15 (No. 5)129994153.6199118462.625 (No. 8)510100062.4Numbers in parentheses are manufacturer’s bar designation.Guaranteed tensile strength; average value is 3 standard deviation (ACI 440.1R-06).†Notes: 1 mm 0.0394 in.; 1 MPa 145 psi.Table 2—Reinforcement detailsFig. 2—Typical crushing-failure mode (G1.13V).Longitudinal barsSpecimenIDa/dNo. ofbarsWeb barsVerticaldbsvdbsh——————16(No. 5)195G1.47V12.7(No. 4)200——G1.13————G1.13H——16(No. 5)195200——20016(No. 5)195——————16(No. 5)19512.7(No. 4)200——————12.7(No. 4)20016(No. .83G0.83VSG1.13SG1.13VH1.13dbHorizontal12.7(No. 4)25(No. 8)12.7(No. 4)Notes: db is bar diameter, mm; sv is spacing between vertical web bars, mm; sh isspacing between horizontal web bars, mm; 1 mm 0.0394 in.STRUT-AND-TIE MODELThe strut-and-tie model (STM) is an approach used todesign discontinuity regions (D-regions) in reinforcedconcrete structures to reduce the complex states of stress intoa truss comprised of simple, uniaxial stress paths (Fig. 4). Themembers of the STM subjected to tensile stresses are called792Fig. 3—Typical strain distribution (G1.13). (Note: 1 mm 0.0394 in.)ties and represent the location where reinforcement shouldbe placed, while the members subjected to compression arecalled struts. The points where truss members intersect arecalled nodes. Most design specifications recognize three majornode types: CCC nodes (bounded by struts only), CCT nodes(bounded by one tie and two or more struts), and CTT nodes(bounded by one strut and two or more ties). If the forces actingon STM boundaries are known, the forces in each of the trussmembers can be determined using basic truss theory.The ACI and CSA STM design provisions allow the useof any truss configuration according to designer provisions.In general, the one-panel STM shown in Fig. 4 was foundto be the preferred mechanism in steel-reinforced deepbeams with a limited amount of web reinforcement (Brownand Bayrak 2006) and was therefore applied to the testedFRP-reinforced deep beams.Defining the geometry of the nodal regions involvescalculating stresses on struts and nodal faces as followsACI Structural Journal/July-August 2016
Table 3—Capacity prediction of tested FRP-reinforced deep beamsAuthorsFarghaly andBenmokrane(2013)CSA S806Proposedmodelb, mmd, mmlb1, mmlb2, mmfcʹ, MPaAfrp, mm2Efrp, GPaPexp, 5466.42650*1.001.15*1.04*Specimen IDAndermatt and Lubell (2013a)ACI 0.7422442.313240.531.381.150.831.771.17342515Mean valueCOV, %Based on two-panel truss model; Pexp is ultimate load at failure recorded during testing; Ppred is predicted load from ACI or CSA provisions; Pprop is predicted load from proposedmodel; lb1 is loading plate width; lb2 is support plate width; all deep beams reinforced entirely with glass FRP bars, except C12#3 and C12#4, which were reinforced with carbonFRP bars.*Notes: 1 mm 0.0394 in.; 1 MPa 145 psi; 1 kN 0.225 kip.(Fig. 5). An iterative procedure would be used to calculatethe capacity based on the condition of limiting the stressesacting on the truss components (struts, ties, and nodes) totheir permitted allowable stress levels to satisfy the lowerbound theorem. The allowable design stress on struts andnodal faces (fce) varied according to the design provisions,as discussed in the following section.ACI 318 (2011) provisionsACI 318 (2011) in Appendix A provides the STM-baseddesign for deep beams. The nominal force carried by thestrut is calculated as Fns fce Acs; where Acs is the smallerACI Structural Journal/July-August 2016cross-sectional area at either end of the strut and fce is calculated as followsf ce 0.85 b s f c′(1)where fcʹ is the concrete compressive strength.The strut efficiency factor βs depends on strut geometry,the reinforcement provided, and stress conditions in themember. For a strut of uniform cross-sectional area overits length, βs 1.0, while for a bottle-shaped strut, βs 0.6when no web reinforcement is provided and βs 0.75 withreinforcement to satisfy the minimum web reinforcementspecified as follows793
Asisin α i 0.003bsi(2)where Asi is the reinforcement cross-sectional area crossingthe strut in the i-th layer of reinforcement at spacing si andangle αi to the strut axis; and b is the strut width perpendicular to the plane of the reinforcing bars.Additionally, ACI 318 (2011) places limits on the allowable stresses at the node faces. The nominal force carried bythe nodal zone is calculated as Fnn fce Anz; where Anz is thearea of the nodal face; and fce is calculated as followsf ce 0.85 b n f c′(3)The value of the nodal efficiency factor βn in ACI 318(2011) depends on the node boundary condition and istaken as equal to 1.0 for CCC nodal zones and 0.80 for CCTnodal zones.CSA S806 (2012) provisionsCSA S806 (2012) uses the STM to determine the internalforces in deep beams reinforced with FRP bars. The strutcompressive force shall not exceed fce Acs; where Acs is theeffective cross-sectional area of the strut; and fce is calculatedbased on the modified compression field theory (Vecchioand Collins 1986) as followsf ce f c′0.8 170ε1(4)andε1 ε frp (ε frp 0.002) cot 2 θ(5)where εfrp is the tensile strain in the tie bar located closest tothe tension face in the deep beam and inclined at an angle θto the strut axis.CSA S806 (2012) specifies that the stress limits in nodalzones shall not exceed 0.65αfcʹ, where α depends on thenodal boundary conditions 0.85 in CCC nodes and 0.75 inCCT nodes. Moreover, the provision specifies a minimumweb reinforcement ratio of 0.003 in each direction with amaximum spacing of 200 mm (7.87 in.) for crack control.Assessment of design provisionsThe STM design provisions provided in ACI 318 (2011)and CSA S806 (2012) were used to calculate the capacityof the deep beams tested in our study as well as that ofthe FRP-reinforced deep beams taken from the literature(Farghaly and Benmokrane 2013; Andermatt and Lubell2013a). Specimens that were relatively small in scale and/orflexurally dominated were omitted, as they do not representthe real case of deep beams in practice. Figure 6 shows thecomparison between the experimental and predicted loadcapacity using both provisions. The calculated capacitiesaccording to both provisions were scattered with differentlevels of deficiency due to the inherent shortcomings ineach provision.The STM in ACI provisions predicted the failure of eitherthe upper or lower node of the inclined strut for all specimens, which is consistent with the experimental results.The capacity prediction using the STM in ACI 318 (2011)was overestimated and arbitrary, with a mean experimentalto-predicted value of 0.81 and a coefficient of variation(COV) of 34% (Fig. 6(a)). An overestimation was alsoobserved for the steel-reinforced deep beams (Hong andHa 2012; Reineck and Todisco 2014; Tuchscherer et al.2014). The overestimated capacities produced by the STMin ACI 318 (2011) for FRP-reinforced deep beams could beexplained by the fact that it neglects the effect of concretesoftening in the diagonal strut resulting from the presenceof high strains in the longitudinal reinforcement (Eq. (5)).Moreover, as shown in Table 3, the prediction for theFig. 4—Strut-and-tie model (one-panel).Fig. 5—STM nodal geometry (one-panel).794ACI Structural Journal/July-August 2016
Fig. 6—Predicted versus experimental capacity using STM in: (a) ACI; and (b) CSA.capacity of deep beams with web reinforcement based onACI 318 (2011) would exceed the capacity of deep beamswithout web reinforcement by 20%, which is inconsistentwith the experimental results in our study (Table 3).Figure 6(b) shows the conservative prediction based onCSA S806 (2012) for the FRP-reinforced-concrete deepbeams tested by Andermatt and Lubell (2013a) and Farghalyand Benmokrane (2013). The level of conservatism wasincreased for the specimens tested in our study. This levelof conservatism was expected as the method exaggerates thenegative effect of concrete softening in the diagonal strut dueto the longitudinal reinforcement strain through the calculation of ε1 (Eq. (5)). It is worth mentioning that the maximumstrain in the longitudinal reinforcement is limited to 0.002in the case of steel-reinforced deep beams, but it couldreach 0.01 in the case of FRP-reinforced deep beams, whichincreases ε1 and, in return, underestimates the efficiencyof the diagonal strut. Therefore, it was expected to yield tosignificantly lower predictions than that of the experimentson deep-beam specimens. The value of the mean ratio of1.89 indicated the conservative uneconomical predictionwith a COV of 26%. Therefore, it can be deduced that theSTMs adopted by ACI and CSA do not adequately reflect thecapacity of FRP-reinforced deep beams and, consequently,the model must be modified.STRUT EFFICIENCY FACTORAn adequate detailing of truss elements is necessary toensure the safety of deep beams. This requires that none ofthe stresses in the STM elements exceed the allowable capacities—yield in steel or rupture in FRP longitudinal reinforcement of the tie or the strut’s concrete effective compressivestrength. Tie failure—either rupture of the FRP or yielding ofthe steel bars—can be eliminated by providing an adequateamount of longitudinal reinforcement so as to induce thefailure in the struts or nodes (ACI 318-11; CSA S806-12).Various studies have been conducted to assess the parameters affecting the strut’s concrete strength in steel-reinforceddeep beams (Reineck and Todisco 2014; Brown and Bayrak2008). Generally, the design procedure of struts or nodesin the STM has been to combine the effect of strut stressACI Structural Journal/July-August 2016and strain conditions, reinforcement details, and concretestrength (or concrete softening) into one factor, namelythe efficiency factor βs. Thus, the efficiency factor can bedefined as the ratio of stress in the strut fce to the compressivestrength of the concrete fcʹ; it is calculated as followsbs f ceFstrut 0.85 f c′ 0.85 Astrut (min) f c′(6)The diagonal strut force Fstrut can be calculated from thetruss equilibrium, as shown in Fig. 4 and divided by theminimum cross-sectional area of the strut Astrut(min) to determine the maximum stress fce. The minimum cross-sectionalarea of the strut can be determined by multiplying the widthof the diagonal strut wst by the deep beam’s breadth (b) atboth ends of the strut. wst can be easily determined fromnode geometry, as shown in Fig. 5. The individual effect ofeach parameter influencing βs for the FRP-reinforced deepbeams is discussed in the following section.Parameters affecting strut efficiency factorFigure 7 shows the tendency of the efficiency factor βswith changing parameter values: concrete compressivestrength fcʹ, shear span-depth ratio (a/d), and strain of longitudinal reinforcement ε1 with insignificant web reinforcement effect.ACI 318 (2011) provisions do not take into account theseparameters in calculating βs. Moreover, the constant valuesof βs equal to 0.6 and 0.75—assigned for specimens withoutand with minimum web reinforcement, respectively—placesthe prediction in the upper limit of the data cloud, as shownin Fig. 7, leading to an unsafe estimation of the deep beam’scapacity. On the other hand, the efficiency factor in CSAS806 (2012) explicitly accounts for ε1, implicitly considersthe effect of a/d through the term cot2θ, and does not accountfor the effect of fcʹ. Nevertheless, the efficiency factorprovided by the CSA provision lies on the lower limit of thedata cloud in Fig. 7, leading to a conservative but uneconomic estimation of the deep beam’s capacity.Figure 7(a) shows a relatively clear trend of the negativeeffect of fcʹ on βs, although the FRP-reinforced deep beams795
It should be mentioned that the strain of the longitudinalreinforcement cannot be used directly because the softeningof concrete in compression is a function of the principaltensile and compressive strains (ε1 and ε2, respectively),while ε2 is set to 0.002 for crushed concrete in the diagonalstrut (Vecchio and Collins 1986). Therefore, the efficiencyfactor was related to ε1 rather than the strain of the longitudinal bars, as shown in Fig. 7(c). Farghaly and Benmokrane(2013) reported the ultimate capacity of the tested FRPreinforced deep beams could be increased solely byincreasing the axial stiffness of the longitudinal reinforcement, thereby reducing its strain and enhancing the efficiencyof the diagonal strut strength.Proposed development of bsBased on the aforementioned discussion, βs is a functionof fcʹ, a/d, and ε1 and can be set in a form as followsb s z ( f c′) ( a d ) ( ε1 )abc(7)where z is constant; and a, b, and c are the constants representing the correlation between each parameter and βs.Figure 7 shows the results of the least-squares regressionperformed to identify the correlation of each parameter as–0.5, –0.8, and –0.5 for a, b, and c, respectively. The constantz was set to 0.5 to have the estimation in the lower limit ofthe data. Therefore, the efficiency factor βs can be calculatedas follows111(SI units)0.8f c′ (a / d )ε1(8a)11(Imperial units)0.8f c′ (a / d )ε1(8b)b s 0.5b s 0.19Fig. 7—Factors affecting measured efficiency factor.tested had a limited variety of fcʹ. This was observed byAndermatt and Lubell (2013a), who attributed that to thelimited deformation due to the more brittle nature of thehigher-strength concrete, which reduced the efficiency of thediagonal concrete strut. The correlation between the shearstrength of deep beams and a/d shown in Fig. 7(b) is predictable (the increased a/d decreased the deep beam’s strength),as reported in many studies and most notably in the sheartests conducted by Kani et al. (1979).In the steel-reinforced deep beams, the concrete softeningin the diagonal strut was relatively insignificant becausesteel-reinforced ties should not reach their yield capacityto satisfy the lower-bound theory. Therefore, the tensilestrains in the steel reinforcement were relatively low (lessthan 0.002). The relatively low elastic modulus of FRP bars,however, induced relatively high strains in the FRP longitudinal reinforcement (compared to the steel), which significantly affected the strength of the diagonal strut and therefore, the efficiency factor.7961where ε1 is given by Eq. 5 and a/d is limited to unity forspecimens having a a/d of less than 1.0, to prevent overstressing the strut.ASSESSMENT OF PROPOSED MODELFigure 8 shows the comparison of the predicted ultimatecapacity based on the proposed model (Eq. (8)) versus theexperimental results of the current and previous studies ofa total of 28 FRP-reinforced deep beams. The predictedcapacity was governed by the failure of the diagonalconcrete struts in all specimens, which is consistent withthe experimental results. The proposed model safely estimated the ultimate capacity with a mean value of 1.22 anda COV of 19%. As illustrated in Fig. 8, however, the modelunderestimated the experimental capacity of four specimens. Those four specimens had vertical web reinforcement,which would allow for the formation of the two-panel trussmodel (Fig. (9)) instead of the one-panel truss model shownin Fig. 4. Figure 10 shows the geometry of the nodal regionsand the stresses acting on struts and nodal faces. The typicalfailure mode of specimens with vertical web reinforcement,given in Fig. 11, could support this suggestion. Therefore, itACI Structural Journal/July-August 2016
was essential to examine the two-panel truss model for thetested beams.Strain-energy conceptAccording to Schlaich et al. (1987), the truss model—either the one-panel or two-panel model shown in Fig. 4and 9, respectively—that contains the least strain energyis likely to be comparable to the experimental results. Thestrain energy for a truss model is equal to the sum of thestrain energy of each member in the STM. To calculate thestrain energy for each member, the area under the stressstrain curve such an element is multiplied by its volume.The strain energy for one- and two-panel truss models wascalculated from the collected data of FRP-reinforced deepbeams to examine the appropriate truss model.Fig. 8—Assessment of proposed model (one-panel).The stress-strain relationship for concrete and FRP reinforcement was based on the actual material properties for the deepbeams tested in our study. For the deep beams in past studies,however, the model developed by Popovics (1973) andmodified by Collins and Mitchell (1997) to account for HSCwas used to predict the concrete stress-strain curve. FRPreinforcement behaves linearly, so the maximum stressesand strains for the longitudinal reinforcement was calculatedfrom the force acting on the tie and the bar’s elastic modulusEfrp. The maximum strains in the vertical and horizontal webreinforcement were taken as the measured strains duringtesting. Based on the geometry of the STM (refer to Fig. 4and 9 for details) and the experimental ultimate capacity, theforce in each truss member and its stress and strain in eitherthe one- or two-panel truss model were determined.All struts were assumed to be prismatic-shaped to calculatetheir volumes, considering that the dispersion of compression in a bottle-shaped strut produces fewer stresses at themiddle of the strut than that at its ends. These lower stressescompensate for the greater cross-sectional area at the middleof the strut; therefore, assuming a prismatic-shaped strut wasconvenient. The area of the diagonal struts at both ends werecalculated by multiplying strut width (as in Fig. 5 and 10)by the width of the deep beam b. The strut volumes werethen calculated by multiplying the strut area by strut length.The total area of the longitudinal reinforcement was used incalculating tie volume. For the two-panel truss model, allthe vertical and horizontal reinforcement within the deepbeam’s shear span were included in determining the volumeof the web reinforcement.Basically, the strain energy can also be represented asthe area under the load-deflection curve, which was usedto verify the strain-energy calculation. Figure 12 shows therelationship between the least strain energy from the oneand two-panel truss models and that from the area underload-deflection curve. It clearly shows that the calculationprocedure defined by Schlaich et al. (1987) resulted in anacceptable prediction of the strain energy, with a mean valueof 1.12 and a COV of 15%.Figure 13 shows the data for the strain-energy ratio (ratioof one-panel to two-panel strain energies). Accordingly, theone-panel truss model would be used if the strain energyratio were less than one. Figure 13 depicts that the strainenergy ratio for all tested FRP-reinforced deep beamsresulted in the use of the one-panel truss model, except forthe four specimens with vertical web reinforcement, whichFig. 9—Two-panel truss model.Fig. 10—Two-panel STM nodal geometry.ACI Structural Journal/July-August 2016797
Fig. 11—Formation of two-panel STM in tested deep beamswith vertical stirrups.Fig. 13—Strain-energy ratio for tested FRP-reinforced deepbeams.Fig. 12—Calculated strain energy versus area underload-deflection curve.acted as a vertical tie between the two struts and led to usingthe two-panel truss model.Applying the two-panel solution for specimens withvertical web reinforcement using the proposed truss modelresulted in more accurate estimation of the specimen’scapacity, as shown in Fig. 14. The mean value and COVfor the experimental-to-proposed capacity were 1.17% and15%, respectively. The two-panel solution was also appliedto predict the capacity according to the STM in ACI 318(2011) and CSA S806 (2012), but it insignificantly improvedthe predicted values (refer to Table 3).Further verification for the proposed model was conductedby comparison to the steel-reinforced deep beams, showingits applicability. As long as the steel bars were properlyanchored, no yield in the longitudinal steel reinforcementoccurred, and the failure was induced by concrete crushingat the struts. Therefore, the proposed model was used tocalculate the capacity of 172 steel-reinforced deep beamsgathered from the literature (Clark 1951; Foster and Gilbert1998; Oh and Shin 2001; Aguilar et al. 2002, Zhang andTan 2007; Alcocer and Uribe 2008; Mihaylov et al. 2010;Tuchscherer et al. 2011; and Birrcher et al. 2014). The beamswere of comparable size to the deep beams currently usedin practice, therefore small-scale specimens with a total798Fig. 14—Assessment of proposed model based on one- andtwo-panel truss models.height of less than 500 mm (19.7 in.) were not considered.The deep beams included in the assessment had a/d valuesranging from 0.27 to 2.20, concrete strengths ranging from13.8 to 120 MPa (2.0 to 17.4 ksi), and various combinationsof web reinforcement. Beams that were described as havinga failure mode other than shear (anchorage and/or flexuralfailure) were not included in the assessment.Figure 15(a) shows calculated capacities using theproposed model versus the reported experimental capacity.The proposed model was capable of predicting the ultimate capacity of steel-reinforced deep beams with a meanexperimental-to-predicted value of 1.09 and a COV of 22%.Figures 15(b) and (c) show the predicted capacity using theACI Structural Journal/July-August 2016
Fig. 15—Predicted versus experimental capacity for steel-reinforced deep beams.STMs in ACI 318 (2011) and CSA A23.3 (2014), respectively.Consistent with the predicted results for the FRP-reinforceddeep beams, ACI 318 (2011) overestimated the capacity ofthe specimens and CSA A23.3 (2014) produced conservativebut uneconomic estimations of capacity.CONCLUSIONSThe main purpose of this research was to assess the accuracy of the STMs in design provisions (ACI and CSA) and toquantify the efficiency factor with the affecting parameters.The efficiency factor in ACI 318 (2011) overestimated theultimate capacity. The efficiency factor in CSA S806 (2012),however, underestimated the ultimate capacity, which couldlead to uneconomic designs. These results reveal theimportance of having a more rational model for estimatingthe efficiency factor. Therefore, a new model for the strutefficiency factor—accounting for the concrete compressivestrength, shear span-depth ratio, and strain in the longitudinalreinforcement was proposed. The strain-energy concept wasused to identify the development of either a one- or two-paneltruss model. The procedure for strain-energy calculationwas verified by comparing the results to the area underthe load-deflection curves for the te
ACI 318 (2011) provisions ACI 318 (2011) in Appendix A provides the STM-based design for deep beams. The nominal force carried by the strut is calculated as F ns f ce A cs; where A cs is the smaller cross-sectional area at either end of the strut and f ce is calcu-lated as foll