Transcription
Design and Dynamic Modeling of a Solar Electric Boat Power SystemMohammad Abu Abdullah Al MehediM. Eng., ElectricalStudent ID:201499191Faculty of Engineering and Applied ScienceMemorial University of NewfoundlandSt. John’s, Canada, A1B3X5malmehedi@mun.cawww.mun.caSupervisor: M. T. IQBALFaculty of Engineering and Applied ScienceMemorial University of Newfoundland, Canada
2
1.Introduction & Literature ReviewResearch Objective Design a solar power system for a river boat in Bangladesh Develop a dynamic model of boat power system in Simulink Propose a basic control system for a low-cost solar boat and Complete a sensitivity economic analysis of a solar electric boat.Currently Used Boats in BangladeshOn the waterway more than 700,000 boats are available. Among those, 60% are diesel engine driven, and 150 types of flood-basin fishing boats, cargo boats, and passenger boats exist.Challenges Harvesting power from Renewable Energy (Photovoltaic). It fluctuates depending on the season, weather conditions,and geographic location which is one of the prime limitations of alternative sources. The stability between the power generation and the consumption of real-time electricity by a boat motor.
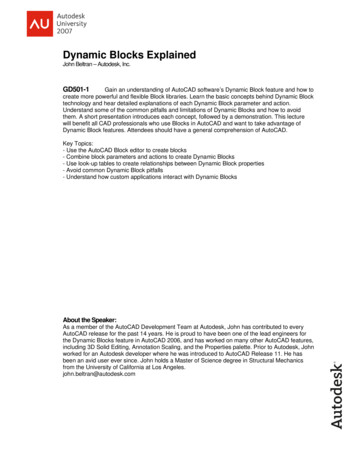
A typical Flood-basin passenger boat (FBPB) could: Carry 10-12passengers at a time Run at speed 4knots (7.5km/h) and Cross the Buriganga river within 12-15minutes.Fig1.1: Conventional Catamarans type passenger boat (CPB) inBangladesh
Prospectus of Solar Energy in Bangladesh 300 sunny days a year Average solar radiation of 4 – 6.5 kWh/m2/d, peak in April and the lowest in December and Air temperature 23.4 C - 26.5 C and optimum tilt of PV modules 22 - 27 .Fig1.2: Bangladesh photovoltaic power potential map in sixmetrological stations (Dhaka, Rajshahi Chittagong, Khulna,Rangpur and SylhetFig1.3: Monthly average solar radiation profile in Bangladesh
Fig1.4: Diagram of the electric catamaran
Literature ReviewFig1.5: Schematic diagram for the solar boat mechatronic system
Literature ReviewFig1.6: A complete solar boatFig 1.7: Schematic diagram of a solar power drivenferry boat A hybrid power system was designed for an electric boat to operate the AC motor , whichincludes wind turbine, solar PV panel, and polymer electrolyte membrane (PEM) fuel cell asthe first, second and third renewable energy source.
Design overviewSOLAR RADIATIONCockpitMPPT(150A)Charge ControllerCC-CV (25A-49V)DischargeRelay(5V)Coupler0.5mBatteryBank (BB)(232Ah)MotorSpeedControllerMDC Motor(5kW)Motor ON/OFFSwitchGas Generator(1.6kW)DC Motor Control System12mFig.2.1: The schematic diagram of a hybrid-powered Catamarans type passenger boat (CPB)Propeller
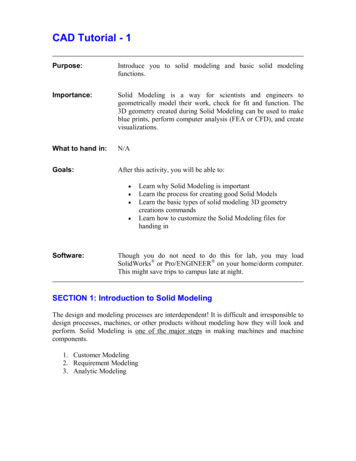
Boat Speed Selection The designed hull speed of the proposed boat is 15.58km/hr, calculated by using equation,Hull Speed 1.34*LWL and The chosen boat speed is 10km/hr (5.4 knots)Power Demand Calculation for BoatThe necessary horsepower to achieve hull speed, defines according to the below equation:Motor power (Horsepower) (Displacement)Τ((150)2 Τ Hull Speed)2Motor power 6.86hp 5.0kWBoat Motor selectionThere are various types of DC motors are available in the market, like: Induction motor (need an inverter (DC to AC) and driver to control speed, also high maintenance cost), DC shunt motor (the existence of brushes while utilize frequently the magnetic field could be badly-behaved), and Brushless DC motorWe have chosen A 5.0kW 48V 3000rpm rated brushed permanent magnet motor
Boat Components Sizing CalculationEnergy Demand CalculationThe daily required power and energy are approximately 5.34kW and 42.10 kWh, respectively which hasbeen calculated by equation,Energy demand Load kW Time hrBoat SpecificationsBoat Hull TypeCatamarans type of passenger boat (CPB)Fiber Glass Polyester materialsBoat materials2400kg (5291lb)The gross weight of the boat (full load capacity)20 peoplePassenger on board12m (39.37ft)Boat lengthBoat beam (the transverse distance between the outer sides of the 4.8m (15.75ft)boat)2400kg (5291lb)Displacement of water by fully loaded boat15.58km/hr (8.41knots)Maximum and the safest Hull speed10km/hr (5.4knots)Considered Hull speed
HOMER Input ParameterDaily Load ProfileThe solar boat will be in operation 220days in a year. Annual average energy demand is scaled 25.38kWh/d which isobtained by using following equation:Scaled value ((operating days/ year)/(365days))*energy demandLoad demand(kW)65432101 2 3 4 5 6 7 8 9 10 11 12 13 14 15 16 17 18 19 20 21 22 23 24Hour of a dayFig.2.2: Daily load profile for solar boatFig.2.3: Schematic layout in HOMER of theproposed hybrid energy system for solar boatSolar PV panelWe have chosen 330 Watts, 24 Volts, and 1.96m x 0.992m polycrystalline 72-cell solar panel.Capacity (kW)1Capital/kW ( )650.00Replacement cost ( )0.00O & M cost ( /year) longevity (year)10.0025.00Derating Factor (%)88.00
Battery ParameterWe have considered a battery with a nominal voltage of 6.0V, nominal capacity 240Ah (1.45kWh).Nominal voltage (V)6String Size (V)48Capital ( /Battery)362.00Replacement ( )330.00O & M ( /year)15.00Throughput (kWh)1257.40Gas GeneratorFor the emergency, we have considered a small-sized gas generator and the details are given below table:Capacity (kW)1.6Capital/kW ( )600.00Replacement( )cost O & M cost ( /year) Life time (hours) Diesel fuel price ( /L)400.000.0512000.000.76Solar Charge ControllerThe solar charge controller (MPPT) rating is 140A which is designed based on the following equation and costing has beengiven in the below table:MPPT current rating (total required power)/(BUS voltage)Capital ( )100.00Replacement( )100.00O & M ( /year)Lifetime (years)O & M ( /year)Throughput (kWh)10.00415.001257.40
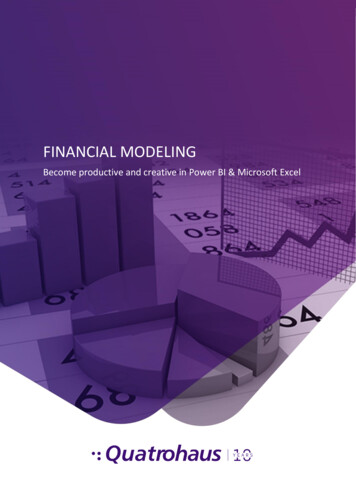
PV ModuleGeneratorBBPV energyGeneratorTotalTable: Summary of hybrid PV-DG-Battery systemSystem SizingCost Summary10.6 kW0.228 /kWhCOE1.6 kW 15625.00NPC18.5 kWh 2115.00Annualized costElectrical EnergyFuel Consumption15990 kWh/yr223 Lfuel consumed/yr779 kWh/yr0.611 LAvg. fuel consumed/d16769 kWh/yr0.0255 LAvg. fuel consumed/hrFig.2.4: Monthly electricity production by PV and GeneratorFig.2.5: Charging and discharging time-series graph of Battery over a year
Fig.2.6: Energy share for hybrid PV-Generator-Battery systemover a week in MarchFig.2.7: Time-series graph of energy share by PV-Generator-Battery over a year
The area of the boat is 57.6m2 ,the total area of the PV module is 62.3 m2. The boat’s roof area becomes 63.6 m2 by extend the roof by 0.25 mwith help of cantilever support from both sides. 10.6kW PV array (16nos of parallel string and 2nos series/string, each PV module 330W),Battery Bank(440Ah) consists of 2nos of parallel string and 8nos/string, each battery rated 6V, 220Ah.330W330W330W330W330W330W330W330W48V DC BUS Voltage systemand each battery 6V, 220Ah330W330W330W330W330W330W330W330W330WFig. 2.4: Design to fix PV array on theproposed solar 30W330W330WMGB5 kW PMDCMotor330WMPPT1.6 kWGenerator10.6kW PV 16parallel strings & 2series/string(Each PV module 6V, 330W)Fig. 2.5: Designed components PV module, Battery Bank, Generator and PMDC motor ofthe proposed solar boat
Purpose of Dynamic Modeling To analyze the system components' dynamic performance To predict how the scheme will function, if implemented in real life and For instrumentation layoutSetup for Dynamic Modeling in Simulink Solar Irradiance and Temperature Signal PV Array (32nos of module, series 02/string and parallel strings 16nos) Perturbation and Observation (P & O) Method for the maximum power point tracking (MPPT) BUS BAR Boost Converter Constant voltage (48V to 50V) dropper (CVD) to loadBattery Bank (48V, 440Ah)Battery Charge Controller (BCC); [ 48V to 50V and 25A]Battery Discharge Controller (BDC)DC Generator (48V, 1.6kW)Permanent Magnet DC Motor (PMDC);[ 48V, 5kW, 3000rpm and gain K 0.0001612] PMDC Motor Driver ( consists of PI controller for rpm, DC current controller and PWM generator)and Switching Controller for DC Generator and PMDC Motor
Fig. 3.1: Simulink model of the proposed system in MATLAB
Fig. 3.2: Constant voltage (48V to 50V) dropper (CVD)Fig. 3.3: Battery discharge controller Simulink model)
PMDC Motor’s Speed Control Requested speed (0 to 3000rpm) launched by knobActual revolution (ω) is tuned by PI controllerMotor’s Ia is controlled by DC current controllerPWM generator produce final pulse for the rectifierFinally, rectifier delivers the controlled current to thePMDC motor to response accordingly.Fig. 3.4: Proposed PMDC motor control system in theSimulinkSwitching Control Between Generator and Motor While, SOC 54% ,Motor becomes disconnected While 74% SOC 55% , Generator and Motor bothare connected and While SOC 74%, only Generator becomesdisconnected.Fig. 3.5:Switching controller Simulink model forDC Generator and Motor
The MATLAB simulation total time has beenconsidered for 40seconds, and,1. Partial cloudy sky T 0sec to T 10sec Clear sky T 10sec to T 20sec2. Completely cloudy sky and only battery back up T 20sec to T 30sec and3. Completely cloudy sky with Generator T 30sec to T 40secFig. 3.7: Graph of Motor speed (rpm), motor armaturecurrent (A), and motor torque (N.m) versus time in secondsThe system voltage range has considered 48V-50V, andconcluded from the MATLAB simulation, that: 10.6kW PV generates 8.82kW power, 12% variation noted. MPPT trigger pulse according to the required load andFig. 3.6: Graph of PV irradiance (W/m2), PV Voltage (V),PV Current (A), PV mean power (kW), and PV Duty cycleamplitude versus time in second The motor driver is able to catch the requested speedwithin a sharp time.
The 48V, (220Ah 220Ah) rated battery could serve the desired current to run the motor (0 rpm to 3000 rpm), PV could charge the battery @ constant 25A and 49V through the battery charge controller, 1.6kW rated DC gas generator able to run the motor at a maximum 2500 rpm and charge the battery @ constant 25Aand 49V while motor revolution lies in 500rpm, otherwise slow charging. After 3hours, the battery will be 80% charged, and 5hours after, the battery will be fully charged (100%) Fixed voltage controller capable to ensure constant 49V to the motor and The battery’s discharge controller discharges power according to the system requirementFig. 3.8: Graph of SOC (%), Battery current (A), andBattery voltage (V) versus time in seconds.Fig. 3.9: Battery Charger Charging Current (A) and Voltage(V) versus time in second
The system instruments are proposed to instal in the cockpit ofthe boat Airmar DST810 multi-sensor (Fig4.1) is recommended tomeasure water depth, boat speed, and water temperature Airmar “CAST App” (Fig4.3) and Raymarine i70 multifunctiondisplay instrument (Fig4.2) is recommended to displaymeasured data from DST810 transducer. XCSOURCE branded digital instrument is proposed tomeasure and display battery capacity and voltage (Fig4.4). PV Module: 330W rated Canadian solar panel brand andCS6U-330P model PV module. MPPT Charge Controller: 48V DC, 150A rated Queenswingbranded QW-JND-X Series MPPT Brushed PMDC Motor: 5.0kw 48V 2800RPM rated SuperMotor brand motor. Motor Driver: 5kW rated Entweg branded programmablePWM PMDC motor driver. Lead-Acid Battery: 6V, 220Ah rated Trojan branded batteryFig4.1: DST810 sensorFig4.2: Raymarine i70Fig4.4: XCSOURCE for Battery SOC & Voltagemeasuring and display instrument.Fig4.5: A super brand brushed PMDC motorFig 4.3:Airmar “CAST App”Fig4.6: Entweg brand motor driver
2Case-B:3PV OFF, GeneratorON & Motor ONCase-C:PV OFF, GeneratorON&MotordisconnectedFig.4.1: Proposed PV array, battery bank, generator and motor switchingcontrol with code.HIGHLED-BHIGH(Blue)4LED-R(Red)Vin 51V,High(Green)Remarks(Measuredvoltage Vin)MediumPV ON, GeneratorOFF & Motor ONLED-GSOCHIGHelse LED statusLOW51V Vin 47.5V,else LED statusLOWVin 47.5V,LowCase-A:LEDLED statusCase No.ArduinoPort No.Table: Proposed Control Functions by Arduinoelse LED statusLOW
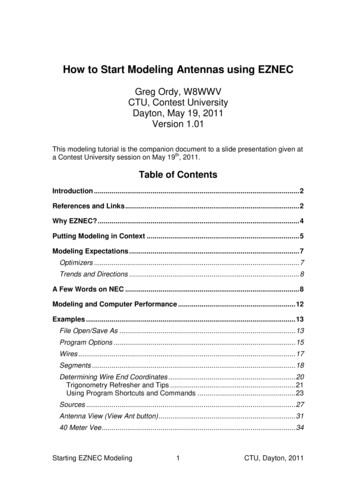
Table: Sensitivity variablesSensitivity variablesValuesSolar-scaled average (kWh/m2/day)4.50, 4.65*, 4.70Diesel fuel price ( /L)0.70, 0.76*, 0.80Summary of Analysis: The solar radiation and diesel price's baseline value is 4.65kWh/m2/dayand 0.76 /L, respectively.Fig.5.1: The sensitivity of solar radiation and diesel fuel price forPV/Diesel/batt system on COE. The optimized COE for the system is 0.228 /kWh Increase in solar radiation reduces the COE (Fig5.1) COE reached its maximum value of 0.289 /kWh & NPCcomparatively higher 19,000, while 0.80 /L diesel price and 4.5kWh/m2/day solar irradiation (Fig5.2) and At the diesel price of 0.70 /L, NPC is comparatively lower at 14,000(Fig5.2).Fig.5.2: The sensitivity of solar radiation and diesel fuel price forPV/Diesel/batt system on NPC.
The payback period defines the total time that it requires to recover the expenditure of financing. The proposed boat couldtravel 8trip (80 km) in a day and convey 20nos of passengers per trip. If the ticket price 0.01 /km/person and theYearly Net Income ( )proposed boat operates 220days in a year, then the total annual income will be 56789YearFig. 7 Payback period graph of the proposed system Decreased atmosphere pollution. Decreased dependency on fossil fuel. Decreased power costs. Decreased water consumption and Slow down weather changes over.10
Conclusion Firstly, manual calculation has performed to obtain the boat’s dimension, carrying capacity, displacement of waterand hull speed. Finally, calculated the required power to propel the boat. Proposed hybrid power system comprises of PV module, gas generator, and battery bank. HOMER optimized the proposed system for the solar boat that consists of 10.6 kW PV, 1.6 kW diesel generatorand 18.5 kWh (440Ah) storage batteries. Sensitivity analysis was performed to observe the effect of different variables such as solar irradiance and dieselfuel price on the COE and NPC of the proposed hybrid system. The proposed project will be beneficial economically at end of the fifth year of operation. Dynamic modeling was performed in MATLAB Simulink to examine the dynamic behavior of the designed systemand found that:i.The PV could produce power 8.82kW, charge the BB at a constant current of 25A and 49V andtakes 5hours to full charge (100%) the battery andii.The DC Generator (1.6kW) is capable to charge the battery and run the PMDC motor The proposed instrumentation and Arduino Uno R3 microcontroller-based switching control system weredesigned and verified through virtual simulation (tinkercad.com).
Recommendation The implementation of the proposed system into a physical system is still needed to confirm the practicalfeasibility and use in transportation. For more complicated system, a faster processing capable microcontroller is recommended. Wireless communication system might introduce to develop a solar boat network and A faster processing capable computer recommended to run the simulation for 08hours duration.
Refereed Journal Article and Conference Publications:M. A. A. A. Mehedi and M. T. Iqbal, “Optimal Design, Dynamic Modeling and Analysis of a Hybrid Power System for aCatamarans Boat in Bangladesh,” Eur. J. Electr. Eng. Comput. Sci., vol. 5, no. 1, Art. no. 1, Feb. 2021, doi:10.24018/ejece.2021.5.1.294.M. A. A. A. Mehedi and M. T. Iqbal, “Optimal Sizing of a Hybrid Power System for Driving a PassengerBoat in Bangladesh,” in 2020 IEEE Electric Power and Energy Conference (EPEC), Nov. 2020, pp. 1–6, doi:10.1109/EPEC48502.2020.9319920.A. Sharan, M. Zamanlou, M. Rahman, and M. Al-Mehdi, “Centralized Power Generation of Solar Parksusing Wireless Controlling,” Int. J. Curr. Eng. Technol., vol. 9, Aug. 2019, doi: 10.14741/ijcet/v.9.3.9.Mohammad Abu Abdullah Al Mehedi, M. Tariq Iqbal, “Design of a PV system for a small boat for use inBangladesh,” presented at the 28th Annual IEEE NECEC conference, St. John's, NL, Canada, November19th, 2019.
Thanks for your patience31
Design a solar power system for a river boat in Bangladesh Develop a dynamic model of boat power system in Simulink Propose a basic control system for a low-cost solar boat and Complete a sensitivity economic analysis of a solar electric boat. 1. Introduction & Literature Review Challenges Harvesting