Transcription
PENNYMAC FINANCIAL SERVICES, INC.3Q21 EARNINGS REPORTNovember 2021
FORWARD-LOOKING STATEMENTSThis presentation contains forward-looking statements within the meaning of Section 21E of the Securities Exchange Act of 1934, as amended, regarding management’s beliefs,estimates, projections and assumptions with respect to, among other things, the Company’s financial results, future operations, business plans and investment strategies, as well asindustry and market conditions, all of which are subject to change. Words like “believe,” “expect,” “anticipate,” “promise,” “project,” “plan,” and other expressions or words of similarmeanings, as well as future or conditional verbs such as “will,” “would,” “should,” “could,” or “may” are generally intended to identify forward-looking statements. Actual results andoperations for any future period may vary materially from those projected herein and from past results discussed herein. These forward-looking statements include, but are not limited to,statements regarding the future impact of the COVID-19 pandemic on our business; future loan origination, servicing and production; future loan delinquencies, forbearances andservicing advances; future early buyout activity; future changes in asset values and other business and financial expectations. Factors which could cause actual results to differmaterially from historical results or those anticipated include, but are not limited to: our exposure to risks of loss and disruptions in operations resulting from adverse weather conditions,man-made or natural disasters, climate change and pandemics such as COVID-19; failure to modify, resell or refinance early buyout loans; changes in prevailing interest rates; thecontinually changing federal, state and local laws and regulations applicable to the highly regulated industry in which we operate; lawsuits or governmental actions that may result fromany noncompliance with the laws and regulations applicable to our businesses; the mortgage lending and servicing-related regulations promulgated by the Consumer FinancialProtection Bureau and its enforcement of these regulations; our dependence on U.S. government-sponsored entities and changes in their current roles or their guarantees or guidelines;changes to government mortgage modification programs; the licensing and operational requirements of states and other jurisdictions applicable to the Company’s businesses, to whichour bank competitors are not subject; foreclosure delays and changes in foreclosure practices; changes in macroeconomic and U.S. real estate market conditions; difficulties inherent ingrowing loan production volume; difficulties inherent in adjusting the size of our operations to reflect changes in business levels; purchase opportunities for mortgage servicing rights andour success in winning bids; our substantial amount of indebtedness; expected discontinuation of LIBOR; increases in loan delinquencies and defaults; our reliance on PennyMacMortgage Investment Trust (NYSE: PMT) as a significant source of financing for, and revenue related to, our mortgage banking business; maintaining sufficient capital and liquidity tosupport business growth including compliance with financial covenants; our obligation to indemnify third-party purchasers or repurchase loans if loans that we originate, acquire, serviceor assist in the fulfillment of, fail to meet certain criteria or characteristics or under other circumstances; our obligation to indemnify PMT if our services fail to meet certain criteria orcharacteristics or under other circumstances; decreases in the returns on the assets that we select and manage for our clients, and our resulting management and incentive fees; theextensive amount of regulation applicable to our investment management segment; conflicts of interest in allocating our services and investment opportunities among us and ouradvised entities; the effect of public opinion on our reputation; our recent growth; our ability to effectively identify, manage, monitor and mitigate financial risks; our initiation or expansionof new business activities or strategies; our ability to detect misconduct and fraud; our ability to mitigate cybersecurity risks and cyber incidents; our ability to pay dividends to ourstockholders; and our organizational structure and certain requirements in our charter documents. You should not place undue reliance on any forward-looking statement and shouldconsider all of the uncertainties and risks described above, as well as those more fully discussed in reports and other documents filed by the Company with the Securities and ExchangeCommission from time to time. The Company undertakes no obligation to publicly update or revise any forward-looking statements or any other information contained herein, and thestatements made in this presentation are current as of the date of this presentation only.The Company’s earnings materials contains financial information calculated other than in accordance with U.S. generally accepted accounting principles (“GAAP”), such as pretaxincome excluding valuation-related items that provide a meaningful perspective on the Company’s business results since the Company utilizes this information to evaluate and managethe business. Non-GAAP disclosure has limitations as an analytical tool and should not be viewed as a substitute for financial information determined in accordance with GAAP.2
THIRD QUARTER HIGHLIGHTS Net income was 249.3 million, or diluted earnings per share (EPS) of 3.80; annualized return on average common stockholders’equity (ROE) of 29%–Earnings reflect higher income from production against a normalizing origination market and strong core servicing results, partially offsetby fair value declines on mortgage servicing rights (MSRs) and hedges–Book value per share increased 6% to 58.00 from 54.49 at June 30, 2021–Repurchased 4.2 million shares of PFSI’s common stock at a cost of 257.3 million; also repurchased an additional 1.4 million shares inOctober at a cost of 89.7 million–PFSI’s Board of Directors declared a third quarter cash dividend of 0.20 per share, payable on November 24, 2021, to commonstockholders of record as of November 15, 2021–Issued 500 million of 10-year senior unsecured notesProduction segment pretax income was 330.6 million, up 35% from 2Q21 primarily driven by record volumes and higher margins inthe consumer direct lending channel, and down 46% from 3Q20 primarily as a result of a less favorable market–Consumer direct lock volume was a record 16.3 billion in unpaid principal balance (UPB), up 16% from 2Q21 and up 50% from 3Q20–Broker direct lock volume was 4.9 billion in UPB, up 8% from 2Q21 and down 11% from 3Q20–Government correspondent lock volume was 16.2 billion in UPB, up 4% from 2Q21 and down 20% from 3Q20–Total loan acquisitions and originations were 59.1 billion in UPB, down 4% from 2Q21 and up 9% from 3Q20–Correspondent acquisitions of conventional loans fulfilled for PennyMac Mortgage Investment Trust (NYSE: PMT) were 28.6 billion in UPB,down 6% from 2Q21 and up 5% from 3Q203
THIRD QUARTER HIGHLIGHTS (CONTINUED) Servicing segment pretax income was 8.0 million, down from 30.9 million in 2Q21 and from 111.7 million in 3Q20–Pretax income excluding valuation-related items was 148.4 million(1), down 15% from 2Q21 driven by decreased income from lossmitigation activity–MSR fair value changes and hedging results impacted pretax income by (151.9) million, or (1.70) in earnings per share–Servicing portfolio grew to 495.4 billion in UPB, up 5% from June 30, 2021 and 23% from September 30, 2020, driven by strongproduction volumes which more than offset elevated prepayment activityInvestment Management segment pretax income was 1.0 million, down from 4.1 million in 2Q21 as incentive fees were not earnedin 3Q21, and down from 3.3 million in 3Q20–(1)Net assets under management (AUM) were 2.5 billion, up 6% from June 30, 2021, and up 9% from September 30, 2020Excludes 65.5 million in MSR fair value declines, 86.5 million in hedging losses and a 11.5 million reversal related to provisions for losses on active loans. See slide 12 for additional details.4
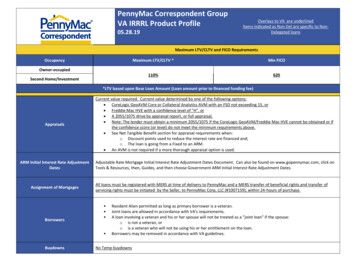
ORIGINATION MARKET REMAINS HISTORICALLY LARGEU.S. Mortgage Origination Market(1)( in trillions) 2.3 4.1 2.6Mortgage Rates Remain Historically Low5.0% 4.2 2.4 3.0 1.120193.0%2.0% 1.1 1.34.0% 1.52020Purchase 1.82021ERefinance 2.02022E1.0%0.0%Average 30-year fixed rate mortgage(2)(3)Primary/secondary spread Despite the increase in recent weeks, interest rates continue to be historically low and remain consistent with the projections ofleading economists Economic forecasts for 2022 total originations average 3.0 trillion, a large market by historical standards, supported by apurchase origination market expected to total a record 2.0 trillion‒PennyMac has historically over-indexed the purchase money market and is well-positioned as the largest producer of purchasemoney loans in the U.S.(4)(1) Actualoriginations: Inside Mortgage Finance. Forecasted originations: Average of Mortgage Bankers Association (10/17/21), Fannie Mae (10/11/21), and Freddie Mac (10/15/21) forecasts.Mac Primary Mortgage Market Survey. 3.14% as of 10/28/21.(3) Bloomberg: Difference between Freddie Mac Primary Mortgage Market Survey and the 30-Year Fannie Mae or Freddie Mac Par Coupon (MTGEFNCL) Index.(4) Inside Mortgage Finance(2) Freddie5
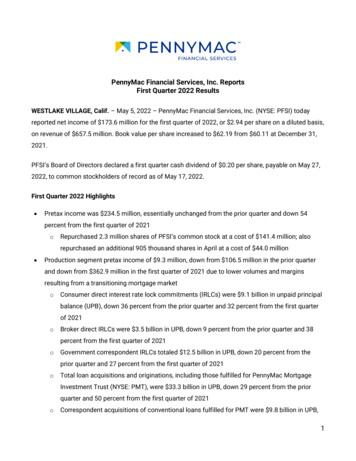
DIRECT LENDING AND SERVICING ARE DRIVING PFSI’S PROFITABILITYProduction Pretax IncomeServicing Pretax Income( in millions)( in millions) 180 174 613 148 112 331 244 179 31 25 8( 18)3Q193Q202Q213Q193Q21Estimated contribution from direct lending (Consumer and Broker)Pretax income3Q202Q213Q21(1)Pretax income excluding valuation-related changes Our consumer direct lending channel remains a significant contributor to PFSI’s sustained profitability Servicing income reflects growing portfolio, economies of scale and loss mitigation activitiesPFSI’s return on equity is expected to remain attractive and trend towards our pre-COVID average over time(2)Valuation-related changes include MSR fair value changes before recognition of realization of cash flows, related hedging and othergains (losses), and provision for losses on active loans considered in the assessment of MSR fair value changes – see slide 12.(2) See slide 19(1)6
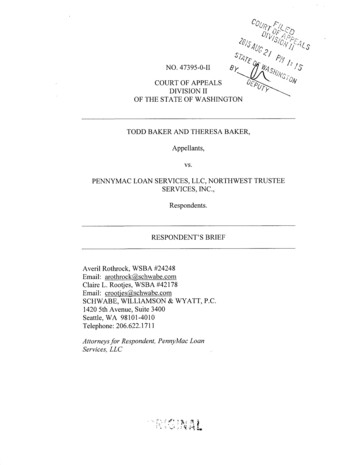
PENNYMAC CONTINUES TO GROW MARKET SHARE ACROSS ITS BUSINESSESLoan Servicing Market Share(1)Correspondent Market 31/209/30/21Broker Direct Market Share(1)Consumer Direct Market 72018201920209M2120172018Note: All figures are for PFSI and include volume fulfilled or subserviced for PMT(1) Historical market share estimates based on Inside Mortgage Finance. Inside Mortgage Finance estimates 3.7 trillion in total origination volume for 9M21. For 9M21,we estimate the correspondent channel represented 21% of the overall origination market, retail represented 64% and broker represented 15%. Loan servicing marketshare is based on PFSI’s servicing portfolio UPB of 495.4 billion divided by an estimated 12.0 trillion in mortgage debt outstanding as of June 30, 2021.201920209M217
PRODUCTION SEGMENT HIGHLIGHTS – VOLUME BY CHANNELCorrespondentConsumer DirectBroker Direct(UPB in billions)(UPB in billions)(UPB in billions) 5.5 54.5 44.3 46.7 46.0 27.4 30.5 14.1 44.0 45.6 28.6 10.9 6.3 3.1 17.03Q20 16.22Q21(1) 15.4 3.23Q213Q20Government loans(2)Conventional loans for PMT(3)Total locks(UPB in billions)Acquisitions:(UPB in billions) 12.9 10.7 5.0 6.2 2.7 3.2 3.1 5.7 4.9 0.8 0.7 0.92Q213Q213Q202Q213Q21Locks:(UPB in billions)Originations:(UPB in billions)Committed pipeline(4):(UPB in billions) 4.0 3.5October 2021 11.5 4.9 4.5 4.0 11.1Government loansConventional loansTotal locksOctober 2021Locks: 16.3Government loansConventional loansTotal locksOctober 2021 4.9 3.6 6.3Note: Figures may not sum due to rounding(1) For government-insured loans, PFSI earns income from holding and selling or securitizing the loans(2) For conventional and jumbo loans, PFSI earns a fulfillment fee from PMT rather than income from holding and selling or securitizing the loans(3) Includes locks related to PMT loan acquisitions, including conventional loans for which PFSI earns a fulfillment fee(4) Commitments to originate mortgage loans at specified terms at period endLocks:(UPB in billions)Originations:(UPB in billions)Committed pipeline(4):(UPB in billions) 1.5 1.3 1.68
DRIVERS OF PRODUCTION SEGMENT t Correspondent 18,315Margin /FulfillmentFee (bps)(1)RevenueContribution(net of Loanoriginationexpense)64 % ofProductionRevenue117.315%FalloutAdjustedLocks 15,0223Q21RevenueContribution(net of Loanoriginationexpense)Margin /FulfillmentFee (bps)(1)30 % ofProductionRevenue45.19%FalloutAdjustedLocks 15,661RevenueContribution(net of Loanoriginationexpense)Margin /FulfillmentFee (bps)(1)27 % ofProductionRevenue42.98%Consumer .780%Broker 9%54.87%54.011%Other(2)Total PFSI account revenues(net of Loan origination expense) PMT Conventional Correspondent30,89123630,03618Total Production revenues(net of Loan origination expense)Production expenses(less Loan origination expense)Production segmentpretax income 60,927 129 785.3100%28 172.122%101 613.378% 28,29615429,2791857,575 85 490.5100%43 246.050%42 244.450% 31,30316528,3011659,604 515.292%43.98%94 559.1100%38 228.541%55 330.659% Direct lending channels (consumer and broker direct) have outsized impact on Production earnings – represented 26% of fallout adjusted lock volume in3Q21, but approximately 84% of segment pretax income Production revenue margins were higher in both direct lending channels – revenue per fallout adjusted lock for PFSI’s own account was 165 basis points in3Q21, up from 154 basis points in 2Q21 Costs(3) vary by channel – range from approximately 10 basis points in correspondent to 140 basis points in consumer direct; as the mix shift towardsdirect lending continues, production expenses as a percentage of fallout adjusted locks are expected to trend higher(1) Expectedrevenue net of direct origination costs at time of lockReflects hedging, pricing and execution changes, timing of revenue recognition, and other items(3) Costs are fully allocated Production expenses net of Loan origination expense(2)9
PRODUCTION SEGMENT HIGHLIGHTS – BUSINESS TRENDS BY CHANNELMulti-channel approach provides flexibility and has proven to be a competitive advantage, supporting profitabilityand pricing discipline while driving growth of the servicing portfolioCORRESPONDENT PennyMac remains the largestcorrespondent aggregator in the U.S. Purchase volume in 3Q21 was a record 28.9 billion, up from 27.4 billion in 2Q21and 21.5 billion in 3Q20 Drives servicing portfolio growth whilegenerating additional leads forconsumer direct Profitability driven by low cost structureand operational excellenceCONSUMER DIRECT Continue to originate and lock recordvolumes of loans‒ Expanding opportunity to serve customersin our large and growing servicing portfolio‒ Purchase lock volume in 3Q21 was a record 788 million, up from 740 million in 2Q21and 474 million in 3Q20‒ New Customer Acquisition interest rate lockcommitments in 3Q21 totaled 2.0 billion,up from 1.5 billion in 2Q21 and 920 millionin 3Q20 Third quarter margins were higher than in2Q21 and remain attractive Future growth expected to be driven bythe changing demands of our servicingportfolio customers as we leverageinvestments in technology and marketingBROKER DIRECT Funding volumes were essentiallyunchanged from 2Q21 Approved brokers totaled 2,132 atSeptember 30, 2021, or approximately 14%of the total population of brokers‒ Approximately 15,000 brokers and nondelegated sellers active in the market The channel remains competitive despitemodest improvement in margins from 2Q21levels Optimistic for continued growth in thechannel supported by significantinvestments in technology10
SERVICING SEGMENT HIGHLIGHTS Servicing portfolio totaled 495.4 billion in UPB atSeptember 30, 2021, up 5% Q/Q and 23% Y/YLoan Servicing Portfolio Composition(UPB in billions) Strong production volumes led to continued portfoliogrowth despite elevated prepayment activity Decrease in delinquency rates as borrowers continue toemerge from forbearance plans with the successfulimplementation of loss mitigation activities Decrease in EBO loan volume as a result of a decliningpopulation of loans eligible to be bought outLoans serviced (in thousands)2Q212,0583Q212,11160 day delinquency rate - owned portfolio(1)6.7%6.1%1.6%1.2%Actual CPR - owned portfolio(1)28.3%27.2%Actual CPR - sub-serviced(2)24.7%23.6%UPB of completed modifications ( in millions)(3) 5,487 4,700EBO loan volume ( in millions)(4) 6,776 5,514(2) 495.46/30/219/30/21 401.9Selected Operational Metrics60 day delinquency rate - sub-serviced portfolio 473.29/30/20Prime ownedPrime subserviced and otherNet Portfolio Growth(UPB in billions) 473.2( 36.9)At 6/30/21Runoff 59.1(5)Additions from loanproduction (6) 495.4At 9/30/21(1) CPR Conditional Prepayment Rate. Owned portfolio is predominantly government-insured and guaranteed loans under the FHA (41%), VA (35%), and USDA (8%) programs. Delinquency data based on loan count (i.e., not UPB).Represents PMT’s MSRs. Excludes distressed loan investments(3) UPB of completed modifications includes loss mitigation efforts associated with partial claims programs(4) Early buyouts of delinquent loans from Ginnie Mae pools during the period(5) Also includes loans sold with servicing released in connection with any asset sales by PMT(6) Includes consumer and broker direct production, government correspondent acquisitions, and conventional conforming and jumbo loan acquisitions subserviced for PMT(2)11
SERVICING PROFITABILITY EXCLUDING VALUATION-RELATED CHANGES3Q20 in millionsOperating revenueRealization of MSR cash flowsEBO loan-related revenue(2) Servicing expenses:Operating expenses(3)Payoff-related expenseLosses and provisions for defaulted loansEBO loan transaction-related expenseFinancing expenses:Interest on ESSInterest to third partiesPretax income excluding valuation-related changesValuation-related changes MSR fair value(4)ESS liability fair valueHedging derivatives gains (losses)2Q21basispoints(1) in 3.0)(1.2)(2.1)(20.1)179.5 (37.0)3.16.5Provision for losses on active loans(5)Servicing segment pretax income Average servicing portfolio UPB (40.5)111.7396,4223Q21basispoints(1) in millions 3)(0.4)0.0(3.0)15.1(35.6)148.4(2.9)12.3 (250.6)91.1(65.5)(86.5) 16.030.9 461,499 11.58.0484,107 Operating revenue increased 7.4 million driven by an increase in servicing fees from a larger servicing portfolio; operating expenses as apercentage of average servicing portfolio UPB decreased EBO loan related revenue decreased 47.4 million driven by lower EBO-related activities Payoff-related expense from prepayments remains elevated but decreased 6.5 million Valuation-related changes include 11.5 million in reversals of provisions for losses on active loans(1)(3)(2) Comprised of net gains on mortgage loans held for sale at fair value and interest income related to EBO loansOf average portfolio UPB, annualized(4) Changes in fair value do not include realization of MSR cash flows(5) Considered in the assessment of MSR fair value changesConsists of interest shortfall and recording and release fees12
HEDGING APPROACH MODERATES THE VOLATILITY OF PFSI’S RESULTS OVER TIMEMSR Valuation Changes and Offsets PFSI seeks to moderate the impact of interest ratechanges on the fair value of its MSR asset through acomprehensive hedge strategy that also considersproduction-related income( in millions)MSR fair value change before recognition of realization of cash flowsHedging and other gains (losses) In 3Q21, MSR fair value decreased 65 million(1),comprised of:Production pretax income 1,964– 56 million in fair value gains due to increases in interestrates 943 607 528 405 331 56( 352)( 559)( 65)( 86)(1)2020Before recognition of realization of cash flows1H21 86 million from decreases in hedging results,comprised of:– 69 million in fair value declines primarily driven byincreases in interest rates during the quarter( 1,110)2019– 121 million in other valuation declines, primarily due toelevated levels of prepayment activity and increases toshort-term prepayment projections3Q21– 17 million in declines due to hedge costs Strong production income driven by the continuedgrowth of the consumer direct lending channel13
TRENDS IN DELINQUENCIES, FORBEARANCE AND LOSS MITIGATION30 Day Delinquency Rate and Forbearance 6.3%3/31/20 6/30/20 9/30/20 12/31/20Forbearance Rate3/31/21 In PFSI’s predominately government MSR portfolio, approximately257,000 borrowers have been enrolled in a forbearance planrelated to COVID-19 since the enactment of the CARES Act9.0%4.9%6/30/218.3%3.2%9/30/2130 Day Delinquency RateForbearance Outcomes(2)0.6%Through September 30, approximately 216,000 borrowers haveexited or are in the process of exiting their forbearance planincluding those borrowers that have paid-in-full Servicing advances outstanding increased to approximately 430million at September 30, 2021 from 424 million at June 30, 2021–Advances are expected to increase as many property tax paymentsbecome due toward the end of the calendar year–No P&I advances are outstanding, as prepayment activity continuesto sufficiently cover remittance obligations Of the 0.6% reduction in forbearance related to ning period forbearance30 DQnot inforbearanceExtendedNewforbearances–0.2% were forbearances that remained current or went delinquentand subsequently became current–0.4% were FHA Partial Claims or completed modifications9/30/21Ending period forbearanceNote: Figures may not sum due to rounding(1) Owned MSR portfolio. Delinquency and forbearance data based on loan count (i.e. not UPB). As of 9/30/21, 30 day delinquency units amounted to 108,280, forbearance units amounted to 41,423, total portfoliounits were 1,307,230, and portfolio UPB was 277 billion.(2) Forbearance outcomes based on loan count as a percentage of beginning period loans in forbearance.14
INVESTMENT MANAGEMENT SEGMENT HIGHLIGHTS Net AUM as of September 30, 2021 were 2.5 billion, up 6% from June 30, 2021, and up 9% from September 30, 2020‒ Increase in AUM due to PMT’s sale of 250 million in preferred sharesInvestment Management segment revenues were 9.8 million, down 28% from 2Q21 and unchanged from 3Q20‒No incentive fee was earned for PMT’s performance this quarterInvestment Management AUMInvestment Management Revenues( in billions)( in millions) 2.3 2.3 2.5 13.5 9.99/30/206/30/219/30/21 9.83Q20 3.3 9.8 10.2 10.12Q21( 0.3)3Q21Base management fees & other revenuePerformance incentive15
APPENDIX
PENNYMAC IS AN ESTABLISHED LEADER IN THE U.S. MORTGAGE MARKET WITHSUBSTANTIAL GROWTH POTENTIAL 2.5 billion in assetsunder management12-year track record 197 billion in 2020 187 billion in 9M21#2PMTIN PRODUCTION(1) CORRESPONDENTPRODUCTIONIS A LEADINGRESIDENTIALMORTGAGE REIT CONSUMER DIRECT2 million customersIN SERVICING(1) BROKER DIRECT13#6 495 billion outstandingYEARS OFOPERATIONSNote: All figures are for PFSI and include volume fulfilled or subserviced for PMT. All figures are as of 9/30/21.(1) Inside Mortgage Finance for the year ended or as of 9/30/218YEARS FOR PFSI AS APUBLIC COMPANY17
OVERVIEW OF PENNYMAC FINANCIAL’S BUSINESSESLOAN PRODUCTIONLOAN SERVICINGINVESTMENT MANAGEMENTCorrespondent aggregation of newlyoriginated loans from third-party sellersServicing for owned MSRs andsubservicing for MSRs owned by PMTExternal manager of PMT, which investsin mortgage-related assets:- PFSI earns gains on delegatedgovernment-insured and non-delegatedloansMajor loan servicer for Fannie Mae,Freddie Mac and Ginnie Mae- GSE credit risk transfer investments- Fulfillment fees for PMT’s delegatedconventional loansIndustry-leading capabilities in specialservicingConsumer direct origination ofconventional and government-insuredloansOrganic growth results from loanproduction, supplemented by MSRacquisitions and PMT investment activity- MSR investments- Investments in prime non-agency MBSand asset-backed securitiesSynergistic partnership with PMTBroker direct origination launched in2018Complex and highly regulated mortgage industry requires effective governance, compliance and operating systemsOperating platform has been developed organically and is highly scalableCommitment to strong corporate governance, compliance and risk management since inceptionPFSI is well positioned for continued growth in this market and regulatory environment18
PFSI’S TRACK RECORD ACROSS VARIOUS MARKET ENVIRONMENTS IS UNIQUE AMONGINDEPENDENT MORTGAGE BANKSPFSI's Annualized Return on Average Common Stockholders' Equity (ROE)Proven ability togenerate attractiveROEs 61%Average: 25%11%20134.0% across differentmarket environments (1)19%20%22%26%20142015201620172.0%1.0%0.0%2013 1.32014PFSI Purchase Mix with a strongorientation towardspurchase moneymortgages.75%48%58%40%2013(1) Represents(2) Bloomberg(3) Inside(4)2014201920209M21 4.1 4.2U.S. Origination Market (in trillions)10-Year Treasury Yield 1.82018(3)(2)3.0%13%32%22% 1.72015 2.1 1.8 1.6201620172018Industry Purchase Mix64%53%201561%201620199M2120202021E40%36%44% 39%20209M21(4)73%49% 2.380%63%201771%201863%54%2019partial year. Initial Public Offering was May 8, 2013.Mortgage Finance. Full year 2021 estimate is an average of Mortgage Bankers Association (10/17/21), Fannie Mae (10/11/21), and Freddie Mac (10/15/21) forecasts.Inside Mortgage Finance for historical data. Industry purchase mix for 3Q21 represents the average of Mortgage Bankers Association (10/17/21), Fannie Mae (10/11/21), and Freddie Mac (10/15/21) estimates.19
CURRENT MARKET ENVIRONMENT AND MACROECONOMIC TRENDS10-year Treasury Bond Yield(2)Average 30-year fixed rate 2.0%3.0%2.5%1.0%2.0%0.0%Macroeconomic Metrics(3)Footnotes9/30/20 12/31/2010-year Treasurybond yield2/10 year Treasuryyield spread30-year fixed ratemortgageSecondary mortgagerateU.S. home price appreciation(Y/Y % change)Residential mortgageoriginations (in 30/21(1)Freddie Mac Primary Mortgage Market Survey. 3.14% as of 10/28/211.49%(2)U.S. Department of the Treasury. 1.58% as of 10/8/21(3)10-year Treasury bond yield and 2/10 year Treasury yield spread: 8.7%18.5%Average 30-year fixed rate mortgage: Freddie Mac Primary Mortgage MarketSurvey.Average secondary mortgage rate: 30-Year FNCL Par Coupon Index(MTGEFNCL), Bloomberg.U.S. home price appreciation: S&P CoreLogic Case-Schiller U.S. National HomePrice NSA Index (SPCSUSA). Data is as of 8/31/21.Residential mortgage originations are for the quarterly period ended. Source: 1,155 1,265 1,305 1,230 1,195Inside Mortgage Finance.20
PFSI’s BALANCED BUSINESS MODEL IS A FLYWHEELLarge volumes of production grow servicing portfolioLoan Production2nd largest inLoan Servicing6th largestthe U.S.(1)in the U.S.(1) Diversified business through correspondent,consumer direct and broker direct channels Recurring fee income business captured overthe life of the loan Correspondent and broker direct channelsin particular allow PFSI to accesspurchase-money volume In the event of higher interest rates, expectedlife of the loan increases resulting in a morevaluable MSR asset Lacks the fixed overhead of the traditional,retail origination model Creates a natural hedge to productionincomeCustomer base of over 2 milliondrives leads for consumer directIn both businesses, scale and efficiency are critical for success(1) InsideMortgage Finance for the year ended or as of September 30, 2021. Includes volume fulfilled or subserviced for PMT.21
PENNYMAC HAS DEVELOPED IN A SUSTAINABLE MANNER FOR LONG-TERM GROWTH20172018PFSI issued MSRbacked term notes2019PFSI launched brokerdirect lending channelAchieved position as thelargest correspondentaggregator in the U.S.PFSI completescorporate reorganizationPFSI launched proprietary,cloud-based ServicingSystems Environment (SSE)Substantial growth inPFSI’s consumerdirect capacityPFSI stockholders’ equitysurpasses 1 billionContinued organic growthand servicing portfolioUPB reaches 100 billion(1)PMT formed in an initial publicoffering raising 320 millionCorrespondent groupestablished with a focus onoperations development andprocess design2010Added servicingleadership for primeportfolio and to drivescalable growthCorrespondent systemlaunchesServicing portfoliosurpasses 2 millioncustomers(1)201320142009PFSI issued anadditional 1.15 billion ofunsecured Senior NotesPFSI issued inauguralunsecured Senior Notes of 650 million2015Operations launched; denovo build of legacy-freemortgage servicerRaised 500 million ofcapital in privateopportunity fundsRecord productionvolumes across allchannels; nearly 200billion in UPB(1)2016200820212020PFSI completed initialpublic offeringExpanded infrastructure inFort Worth, TX2011Expanded infrastructurewith flagship operationsfacility in Moorpa
- Total loan acquisitions and originations were 59.1 billion in UPB, down 4% from 2Q21 and up 9% from 3Q20 - Correspondent acquisitions of conventional loans fulfilled for PennyMac Mortgage Investment Trust (NYSE: PMT) were 28.6 billion in UPB, down 6% from 2Q21 and up 5% from 3Q20