Transcription
Overview of PredictiveModeling for ActuariesMichigan Actuarial SocietyMarch 18, 2015Louise Francis, FCAS, MAAA, Francis Analytics and Actuarial Data Miningwww.data-mines.comLouise francis@msn.com
Why Predictive Modeling? Better use of data thantraditional methods Advanced methodsfor dealing with messydata now available New ways to test andvalidate models
Real Life Insurance Application – The“Boris Gang”
Kinds of Applications Classification Target variable iscategorical Prediction Target variable isnumeric
A Casualty Actuary’s Perspectiveon Data Modeling The Stone Age: 1914 – Simple deterministic methods Often ad-hoc Slice and dice data Based on empirical data – little use of parametric modelsThe Pre – Industrial age: 1970 - Fit probability distribution to model tails Simulation models and numerical methods for variability and uncertainty analysis Focus is on underwriting, not claimsThe Industrial Age – 1985 Begin to use computer catastrophe modelsThe 20th Century – 1990 Use of blunt instruments: the analytical analog of bows and arrowsEuropean actuaries begin to use GLMsThe Computer Age 1996 Begin to discuss data mining at conferences At end of 20st century, large consulting firms starts to build a data mining practiceThe Current era – A mixture of above In personal lines, modeling the rule rather than the exception Often GLM based, though GLMs evolving to GAMsCommercial lines beginning to embrace modeling
Data Complexities: NonlinearitiesMARS Prediction of Primary Paid Severity
Major Kinds of Data Mining Supervised learning Most common situation A dependent variable Frequency Loss ratio Fraud/no fraud Some methods Regression CART Some neuralnetworks MARS Unsupervised learning No dependent variable Group like records together A group of claims withsimilar characteristicsmight be more likely to befraudulent Ex: Territory assignment,Text Mining Some methods Principal Components K-means clustering Kohonen neural networks
Methods Classical Decision Trees Neural Networks Unsupervised learning Clustering Newer Methods Ensemble SVM Deep learning Text Mining
Predictive ngClassicalGLMs
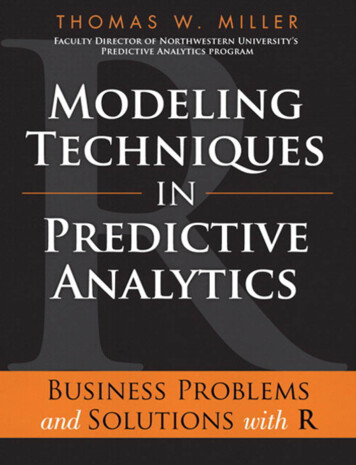
Classical Statistics: Regression Estimation of parameters: Fit line that minimizes deviationbetween actual and fitted values 2min( (Yi Y ) )Workers Comp Severity Trend 10,000Severity 8,000 6,000 4,000 2,000 19901992199419961998200020022004YearSeverity Copyright StatSoft, Inc., 1984-2011. StatSoft, StatSoft logo, and STATISTICA are trademarks of StatSoft, Inc.Fitted Y10
Linear Modeling Tools Widely Available: ExcelAnalysis Toolpak Install Data AnalysisTool Pak (Add In) thatcomes with Excel Click Tools, DataAnalysis, Regression
Goodness of Fit
Classical Model: Discriminant Analysis
Generalized Linear Models (GLMs) Relax normality assumption Exponential family of distributions Models some kinds of nonlinearity
Similarities with GLMsLinear ModelsGLMs Transformation ofVariables Link functions Use dummy codingfor categoricalvariables Use dummy codingfor categoricalvariables Residual Test significance ofcoefficients Deviance Test significance ofcoefficients
Linear Model vs GLM Regression:Yi i i X ' N (0, 2 ) GLM:Y h( i ) h( ) X ' exponential familyh is a link function
Estimating Parameters As with nonlinear regression, there usually is not a closedform solution for GLMs A numerical method used to solve for parameters For some models this could be programmed in Excel –but statistical software is the usual choice If you can’t spend money on the software, download Rfor free
GLM fit for Poisson Regression devage -as.factor((AGE) claims.glm -glm(Claims devage, family poisson) summary(claims.glm) Call: glm(formula Claims devage, family poisson) Deviance Residuals:Min 1Q Median -10.250 -1.732 -0.500 Coefficients:3QMax0.507 10.626Estimate Std. Error z value Pr( z ) (Intercept) 4.735400.02825 167.622 2e-16 *** devage2-0.895950.05430 -16.500 2e-16 *** devage3-4.329940.29004 -14.929 2e-16 *** devage4-6.814841.00020 -6.813 9.53e-12 *** --- Signif. codes: 0 ***' 0.001 **' 0.01 *' 0.05 .' 0.1 ' 1 (Dispersion parameter for poisson family taken to be 1) Null deviance: 2838.65 on 36 degrees of freedom Residual deviance: 708.72 on 33 degrees of freedom AIC: 851.38
Data Complexities: Missing Data It is not uncommon for one third of the possible predictors to containrecords with missing values Possible solutions: A data mining method such as CART that uses a statistical algorithm to find analternative parameterization in the presence of missing data A statistical method such as expectation maximization or data imputation to fill ina value
Data Data Management Data quality Francis, “Dancing With Dirty Data”, CAS forum, www.casact.org CAS Working Party, “Actuarial IQ”, www.casact.org Big Data% of TimeData PreparationAnalysis
Examples of Applications Claim Frequency, Claim Severity Use features of data to predict Chapter in Predictive Modeling book www.casact.org, “Intro to GLMs” Liklihood a claim will occur (life insurance) Insurance Fraud Derrig and Francis “Distinguishing the Forest from the Trees”, Variance, 2008 Financial Crisis Could the defaulting mortgages have been predicted? Francis and Prevosto, “Data and Disaster: The Role of Data in the Financial Crisis”
22The Questionable Claims Study Data 1993 AIB closed PIP claims Simulated data based on research performed on original data Dependent Variables Suspicion Score Expert assessment of likelihood of fraud or abuse Predictor Variables Red flag indicators Claim file variablesFrancis Analytics and Actuarial Data Mining, Inc.3/20/2015
The Fraud Red Flags Binary variables that capture characteristics of claims associated with fraudand abuse Accident variables (acc01 - acc19) Injury variables (inj01 – inj12) Claimant variables (ch01 – ch11) Insured variables (ins01 – ins06) Treatment variables (trt01 – trt09) Lost wages variables (lw01 – lw07)
24The Fraud Problemfrom: www.agentinsure.comFrancis Analytics and Actuarial Data Mining, Inc.3/20/2015
25Fraud and Abuse Planned fraud Staged accidents Abuse Opportunistic Exaggerate claim Both are referred to as “questionable claims”Francis Analytics and Actuarial Data Mining, Inc.3/20/2015
Neural Networks Theoretically based on how neurons function Can be viewed as a complex non-linear regression See Francis, “Neural Networks Demystified”,CAS Forum, 2001, www.casact.org
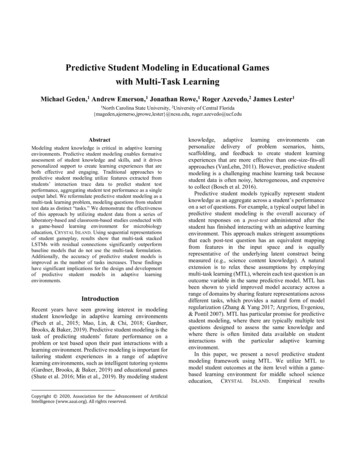
Hidden Layer of Neural Network(Input Transfer Function)L o g is tic F u n c tio n fo r V a rio u s V a lu e s o f w 11 .00 .8w 1 -1 0w 1 -5w 1 -1w1 1w1 5w1 100 .60 .40 .20 .0X-1 .2-0 .7-0 .20 .30 .8
Assessing Results Confusion Matrix ROC Curve
Regression Trees Tree-based modeling for continuous target variable most intuitively appropriate method for loss ratio analysis Find split that produces greatest separation in2 [y – E(y)] i.e.: find nodes with minimal within variance and therefore greatest between variance like credibility theory i.e.: find nodes with minimal within variance Every record in a node is assigned the same expectation model is a stepfunction
CHAID Minimize Chi-SquareStatistic
C&RT Binary splits Gini Index, MSE
Different Kinds of Decision Trees Single Trees (CART, CHAID) Ensemble Trees, a more recent development(TREENET, RANDOM FOREST) A composite or weighted average of many trees (perhaps100 or more) There are many methods to fit the trees and preventoverfitting Boosting: Iminer Ensemble and Treenet Bagging: Random Forest
The Methods and Software Evaluated1) TREENET5) Iminer Ensemble2) Iminer Tree6) Random Forest3) SPLUS Tree7) Naïve Bayes (Baseline)4) CART8) Logistic (Baseline)
Ensemble Prediction of Total Paid60000.00Value Treenet 0000000000Provider 2 Bill
Ensemble Prediction of IME Requested0.900.80Value Prob 683560450363275200100000000000000000Provider 2 Bill
The Fraud Surrogates used asDependent Variables Independent Medical Exam (IME) requested Special Investigation Unit (SIU) referral IME successful SIU successful DATA: Detailed Auto Injury Claim Database for Massachusetts Accident Years (1995-1997)
Results for IME RequestedAUROCLower BoundUpper BoundAUROCLower BoundUpper BoundArea Under the ROC Curve – IME DecisionCARTS-PLUSTreeTreeIminer minerNaïve 0.6770.6690.685
Results for SIU ReferralArea Under the ROC Curve – SIU DecisionCARTS-PLUSTreeTreeIminer TreeAUROC0.6070.6160.565Lower Bound0.5980.6070.555Upper Bound0.6170.6260.575AUROCLower BoundUpper 70.6680.686IminerNaïve 0.6120.6030.621
Volumes 1 and 2, Book Project Predictive Modeling Applicationsin Actuarial Science Volume 1 The first volume contains anintroduction to predictivemodeling methods used byactuaries It was published in 2014 Predictive Modeling Applicationsin Actuarial Science Volume 2 The second volume would bea collection of applicationsto P&C problems, written byauthors who are well aware ofthe advantages anddisadvantages of the firstvolume techniques but whocan explore relevantapplications in detail withpositive results.
Focus on Using R for Applications
41R Libraries Code is provided with book The “cluster” library from R used Many of the functions in the library are described inthe Kaufman and Rousseeuw’s (1990) classic book onclustering, Finding Groups in Data. randomForest R library used to get dissimilarity matrix prcomp, princomp and factanal used for PRIDITs Some custom coding needed3/20/2015
42Dependent Variable Problem:Unsupervised Learning Insurance companies frequently do not collectinformation as to whether a claim is suspected of fraudor abuse Even when claims are referred for special investigation Solution: unsupervised learningFrancis Analytics and Actuarial Data Mining, Inc.3/20/2015
43Grouping RecordsFrancis Analytics and Actuarial Data Mining, Inc.3/20/2015
44Clustering Hierarchical clustering K-Means clustering Most frequent is k-meansFrancis Analytics and Actuarial Data Mining, Inc.3/20/2015
45Cluster PlotFrancis Analytics and Actuarial Data Mining, Inc.3/20/2015
The Mortgage CrisisCould simple descriptive statistics have predicted the meltdown?
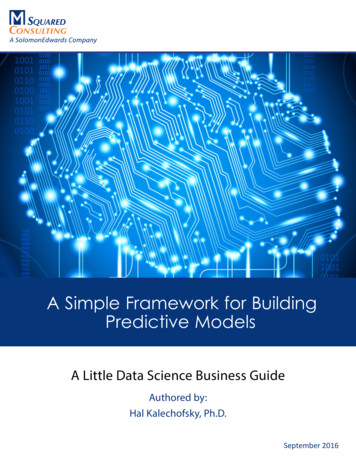
Time Series of Loan-to-ValueLoan to ata from Demyanyk and VanHemert, “Understanding theSubprime Mortgage Crisis”, 200820062007
Subprime Loan Volume and Size250025020002001500150100010050050002001 2002 2003 2004 2005 2006 2007Data from Demyanyk and VanHemert, 2008# Subprime LoansAvg Size of Loan
Balloon Payments and lete Documentation (%)Data from Demyanyk andHemert, 2008200520062007Balloon Payment(%)
Observations from HMDA HMDA indicates lower income applicants tend to have a higher loan toincome ratio HMDA cross-state comparison indicates states with a foreclosure problemhave consistently higher loan to income ratios compared to states notexperiencing a foreclosure problem
The Data HMDA Data LISC ZIP Foreclosure Needs Score Subprime component Foreclosure component Disclosure response.html Zip Code Demographic Data
CART Subprime Tree
CART Foreclosure Variable RankingIndependent VariableDenial PercentMean Denial dian Rate SpreadPInComHouseholdsPerZipcodeMean LTV 6%60.5%56.1%52.7%
Results of Applying Clustering to HMDADataTable III.5 – Means On Variables[1]Cluster K-meansclusteringapplied to loancharacteristicsbut not resultdata (i.e.,approval)123Avg Loan Amount297.23566.96163.80Average Income165.71356.6687.26Mean LTV[2] Ratio2.532.382.48Rate Spread - mean4.844.545.05Median LTV Ratio2.292.092.31Median Rate Spread4.403.954.67Percent Applicants High LTV4.43.84.5Pct Applicants High RateSpread4.74.55.6Percent Manufactured, MultiFamily Houses1.9.46.1Pct Home Improvement57.856.565.6Percent Refinance52.452.557.3Pct Owner Occupied18.128.413.5
Library for Getting Started Dahr, V, Seven Methods for Transforming Corporate into BusinessIntelligence, Prentice Hall, 1997 Berry, Michael J. A., and Linoff, Gordon, Data Mining Techniques, JohnWiley and Sons, 1997, 2003 Derrig and Francis, “Distinguishing the Forest from the Trees”, Variance,2008 If you use R, get a book on doing analysis in R. See www.r-project.org Francis, L.A., Neural Networks Demystified, Casualty Actuarial SocietyForum, Winter, pp. 254-319, 2001. Found at www.casact.org Francis, L.A., “Taming Text: An Introduction to Text Mining”, CAS WinterForum, March 2006, www.casact.org Francis, L.A., Martian Chronicles: Is MARS better than Neural Networks?Casualty Actuarial Society Forum, Winter, pp. 253-320, 2003. Frees, Derrig and Francis, Predictive Modeling Applications in ActuarialScience, vol 1, Cambridge, 2014 James, Witten, Hastie and Tibshirani, An Introduction to StatisticalLearning with applications in R, Springer
Volumes 1 and 2, Book Project Predictive Modeling Applications in Actuarial Science Volume 1 The first volume contains an introduction to predictive modeling methods used by actuaries It was published in 2014 Predictive Modeling Applications in Actuarial Science Volume