Transcription
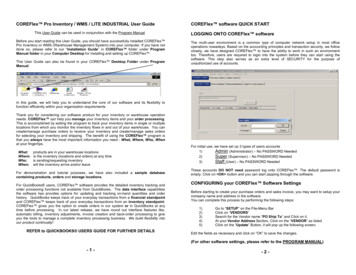
United States Department of AgricultureAgricultural Marketing ServiceJanuary 2022Through comprehensive market surveys, case studies, and research partnerships, AMS provides insight into direct-marketing trends and emerging food system models.A User’s Guide to USDA’s Pork Carcass CutoutWHAT IS IT?The cutout value of anindividual pork carcass isbased on the amounts ofthe various cuts producedby that carcass and theprices of those cuts. Its valueis expressed in cents perpound or dollars per hundredpounds (centi-weight or cwt).Theoretically, each hog has aunique cutout value.Every pork slaughter plantcomputes a plant cutoutvalue that representsthe average value of thecarcasses produced by thatplant in a specifed timeperiod. The plant cutout valueis determined by the amountof pork cuts produced andprices received for thosecuts. A plant’s cutout valueis confdential, proprietaryinformation and is the singlemost important determinantof the price the plant will payfor hogs.USDA’s Estimated PorkCarcass Cutout (PCC) isthe estimated value of astandardized pork carcass(currently 55-56% lean, 215lbs.) based upon industryaverage cut yields andaverage market prices of subprimal pork cuts. Industryaverage cut yields areupdated by USDA annually inJanuary based on the resultsof a survey of packers theprevious July. Market pricescome from USDA wholesalepork, lard, and meat and bonemeal price reports.The PCC refects theoverall supply and demandsituation for wholesalepork cuts. Compositevalues are calculated eachday for the various porkprimals and these valuesare combined to refect asingle composite value of apork carcass. These cutsrefect a standard cuttingspecifcation and must betraded on a negotiated basisto deliver within ten days ofthe time of sale for combos(large totes or containersthat hold approximately 2000lbs of product) and 14 daysfor boxed product. Figure 1shows a typical cutout valueprice report as it appears inUSDA’s National Daily PorkReport (LM PK602).Figure 1: Typical USDA cutout value reportUSDA ESTIMATED COMPOSITE PORK CARCASS CUTOUTBased on FOB Plant Pork Prices and Industry YieldsCalculations for a 215 lb. Pork Carcass55-56% lean, 0.55” - .70” backfat at last ribDateTotalLoads Cutout Loin01/18307.2Change76.101.79ButtPicRibHam Belly68.87 78.36 60.43 104.74 79.86 99.322.432.303.66-0.402.121.2101/17260.174.3166.44 76.06 56.76 105.14 77.74 98.1101/16350.473.3264.31 77.04 54.09 106.35 76.85 97.4701/15456.973.8866.95 78.10 58.89 107.34 73.18 97.9601/14191.774.8165.71 79.13 58.23 104.93 77.47 99.69Current Five Day Simple Average74.4866.46 77.74 57.68 105.70 77.02 98.51NOTE: Value may change without adequate test.The Pork Carcass Cutout (PCC) is an estimate of the valueof a 55-56% lean, 215 lb. hog carcass based upon currentwhole-sale prices being paid for sub-primal pork cuts.BACKGROUND INFORMATIONIn the fabrication process,pork carcasses are brokeninto primal units which, inturn, are broken into varioussub-primal cuts. Primals can becut in different styles to makedifferent sets of sub-primalsto ft different customer andconsumer needs. Sub-primalfabrication also produces byproducts of varying type andquantity. These by-products(such items as trimmings,bone, fat and skin) have valuethat must be added into theprimal value to fully account forall parts of the carcass.USDA is an equal opportunity provider, employer, and lender.1The potential value of subprimals generally dependson how much work must bedone on the primal cut toextract the specifc subprimal. Boneless cuts requiremore fabrication and thuscost more to produce thando bone-in cuts. They arealso worth more to end usersbecause they require lessend-user labor and containless waste product. Thesame is true of fat trimming.Styles produced and sold inlarger volume will have moreimpact on the overall cutout.Seasonal shifts in therelative amount and typesof cut styles are refectedin the PCC by weighting thevarious styles according tothe volume of each cut stylereported to USDA.2019 United States Department of Agriculture. Agricultural Marketing Service.
101MARKETINFORMATIONHOW DOES IT WORK?The PCC is a series of mathematical calculations which usescurrent sub-primal pork cut prices and industry-average cut yieldsto calculate primal values. Industry-average primal cut yields arethen used to translate primal values to a carcass value. Thesesteps and their accompanying calculations are best illustratedthrough a sample calculation. The same series of steps is followedfor all of the other pork primals.STEP 1: SUB-PRIMAL CUTSTO PRIMAL VALUEA value for each component isdetermined by deductingpackaging costs from eachcomponent’s market price.Each component’s contributionto the primal value is computed by multiplying its individualvalue by its yield factor. Thoseare summed to determine theprimal’s gross value and alabor factor is deducted tocompute its net value.For example, the steps of determining the value of a ¼” trimmedpork loin cut in the bone-in center cut, tender-in vacuum-packedloin cutting style are outlined below. This cutting style breaks theprimal cut (a ¼” trimmed pork loin) into four primary sub-primals(bone-in center-cut tender-in loin, boneless sirloin, blade ends andbutt tender) and three by-products (72% trim, 42% trim and bone).The yields of these components appear in Figure 2 and in Appendix A, Table A-1 under style #7. Note that 0.49% of the loin isunaccounted for in these yields and assigned to “shrink” at a valueof zero. Shrink is caused by moisture loss and cutting loss.USDA bases its labor costs onthe total percent of the primalcut that is not accounted for inthe primary sub-primal. In ourexample, the primary subprimal (bone-in center cuttender-in loin) yield from theprimal loin is 61.61%. Laborwas required to remove theremaining 38.39% of theprimal. To calculate laborcosts, USDA multiplies38.39% by an industrystandard 33.00 processingcost. This results in 12.67in labor cost which issubtracted to arrive at a laborfree value of the originalprimal.Figure 2: Calculation of the value of a ¼” Trim Primal Loinusing the Bone-in Center Cut, Tender-In cutting style.Step 1:ComponentValues toPrimal ValueBone-in Center Cut, Tender-Ln Loin61.61% * 130.42 80.35 Boneless Sirloin8.18% * 93.32 7.63 Blade Ends12.33% * 57.23 7.06 Butt Tender1.21% * 198.52 2.40 72% Trimmings6.71% * 59.78 4.01 42% Trimmings4.68% * 22.25 1.04 Bone4.79% * 5.26 0.25 Shrink0.49% * 0.00 0.00-Labor1 - 61.61% 38.39% * 33.00 -12.67 90.07Value of a 1/4” primal loin cut into a bone-incenter cut, tender in loin 90.07USDA is an equal opportunity provider, employer, and lender.2
MARKET101INFORMATIONSTEP 2: PRIMAL VALUES TOCOMPOSITE PRIMAL VALUEThe calculations outlined inStep 1 determine a primalvalue for each cutting stylebased on the sub-primalsproduced by that style. As canbe seen in Figure 1 and TableA-1 in the Appendix, there arenine specified cutting styles forloins. To determine an overallprimal value, thevalues of the various cuttingstyle values are combinedbased on the volumes of thevarious cutting styles reportedto USDA. These calculationsare shown in Figure 3. Theresult is an average composite value for a ¼” trimmedprimal loin. In this case, thevalue is 70.22 per cwt. or70.22 cents per pound.Figure 3: Creating a composite primalvalue from sub-primal style valuesStep 2:Sub-PrimalStyles toPrimalLoin 11/4" Trim Loin VAC9.40 lds @ 70.69Loin 2 - 1/4" Trimmed Loin Paper1.00 lds @ 86.50Loin 3 - 1/4" Trimmed Loin Combo5.87 lds @ 64.45Loin 4 - 1/8" Trimmed LoinVAC 12.72 lds @ 70.83Loin 5 - 1/8" Trimmed Loin Paper0.29 lds @ 86.25Loin 6 - 1/8" Trimmed Loin Combo2.15 lds @ 60.14Loin 7 - Bone-in CC, Tender-in Loin VAC3.96 lds @ 87.06Loin 8 - Bnls CC Strap-on Loin28.00 lds @ 68.36STEP 3: COMPOSITE PRIMALTO UNTRIMMED (DROP)PRIMAL The next step is to convertthe “trimmed” primal value to anuntrimmed or commodity primalvalue. The appropriate “TrimmedPrimal to Untrimmed” table isused to determine this value(see Figure 4). Figure 4: Trimmed composite primalto untrimmed (drop) primal ComponentLoin 9 - Bnls CC, Strap-ofLoin 33.14 lds @ 70.43Step 3: 1/4”TrimmedPrimal toUntrimmedPrimal 70.22Composite 1/4” Trimmed Primal Loin Value 70.22USDA is an equal opportunity provider, employer, and lender.Note that there is no “trimmedto-untrimmed” adjustment forhams since the beginning hamsubprimals (Selected Hams20-23# and 23-27#) areuntrimmed (i.e. have a yield of100% in Table A-5). For picnics, all three styles in TableA-3 start with an untrimmedpicnic so no “trimmed-tountrimmed” adjustment isnecessary.3%ValueTotal1/4" Loin85.08% 70.22 59.74T/Trace0.36% 34.05 0.12Fat10.96% 19.60 2.15Skin3.60% 28.55 1.03Drop Loin100% 63.04
MARKET101INFORMATIONSTEP 4: DROP PRIMALS TOCARCASS CUTOUTIn step 4, we combine thecomposite primal loin valuecalculated in Step 3 with similarvalues calculated for the othersix primals and four individualcarcass parts to determine acomposite cutout (see Figure 5).Each primal is weighted by thepercentage of the entire carcassthat it represents (its yield). Noteoccurs during the fabricationprocess. This loss is generallyparts of the carcass that are toosmall to be used (such as sawand blade residues) or becomecontaminated (dropped on thefloor) and are deemed inedible.The percentage of cut loss issimply that amount notaccounted for by other cuts andpieces. The value of cut loss isthe value of rendered productFigure 5: Composite primal values to cutout valueComposite Primal Loin Value25.42% * 62.97 16.01Step 4:ComponentValues toPrimal Value Composite Primal Butt Value10.24% * 82.37 8.43 Composite Primal Picnic Value11.30% * 39.89 4.51 Composite Primal Sparerib Value4.79% * 120.50 5.77 Composite Primal Ham Value24.49% * 46.16 11.30 Composite Primal Belly Value16.27% * 128.97 20.98 Composite Primal Jowl Value1.28% * 32.94 0.42 Hind Feet1.29% * 21.10 0.27 Neck Bones1.75% * 50.19 0.88 Tails0.17% * 68.78 0.12 Front Feet1.00% * 60.28 0.60 Cut Loss2.00% * 4.30 0.09 69.38Composite Cutout Value 69.38USDA is an equal opportunity provider, employer, and lender.4
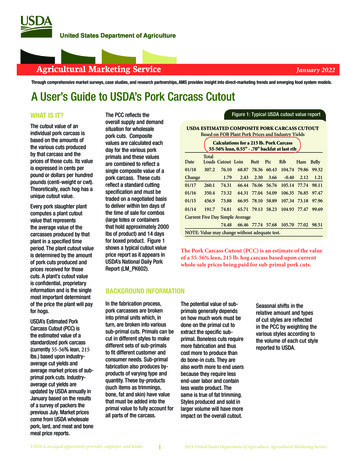
MARKET101INFORMATIONNATIONAL WEEKLY COMPREHENSIVE PORK REPORTThe National Weekly Comprehensive Pork Report coversweekly market activity from Monday to Friday and includesthe comprehensive value and volumes of all reportedwholesale pork trade with the exception of specialty porkproducts. The report is issued each Monday at 1:00 p.m.Central Time under report numbers LM PK680 andLM PK681.Figure 6: Comprehensive Pork Carcass CutoutThe report includes an estimated value of a standard porkcarcass and primals based on the various individual cutsand prices of those cuts. The values and volumes reflectmarketplace activity for all destinations (including export),sales types, delivery periods, refrigeration types, andpackaging styles with the exception of specialty porkproducts.On January 4, 2021, USDA expanded the report to capturethe emerging market for actual carcass transactions. It’simportant to recognize that the existing comprehensiveestimated carcass cutout value is derived from multiplesale prices from each subprimal portion of a carcass,reassembled into a single value, where actual carcasstransactions are a single price for the entire carcass. Ifthere are actual pork carcass trades for the week, thereport will show the volume for all trades. The price willalso be included in the aggregate comprehensive porkcarcass cutout value calculation on a 1:1 weightedaverage ratio.Figure 7: Calculating the Comprehensive Pork CarcassCutout ValueFigure 6 is an example of a single week’s reportedaggregate comprehensive pork carcass cutout value andthe table in Figure 7 demonstrates how the aggregatecomprehensive pork cutout value is calculated if there areactual pork carcass trades for the week. This calculationtakes place after Steps 1 through 4 listed in this overview;if there are no pork carcass trades for the week, thecomprehensive cutout value follows the originalmethodology listed above in Steps 1 through 4. A 1:1weighted average value or Aggregate ComprehensiveCarcass Cutout Value is calculated using the existingComprehensive Estimated Carcass Cutout Value derivedfrom the subprimals and the Comprehensive ActualCarcass Trade Value derived from transactions.The report also includes reported trade volumes for barrowand gilt meat on a weekly basis, and reported tradevolumes for sow, boar, and mixed (sow, boar, barrow/gilt)meat on a weekly basis. However, given the LMRconfidentiality guideline, “only boar meat” is not reported atthis time.USDA is an equal opportunity provider, employer, and lender.5
APPENDIX A: YIELD PERCENTAGESTable A-1: Loin styles and yieldsLoin Primal Styles:#1 - 1/4” Trimmed Loin VAC#2 - 1/4” Trimmed Loin Paper#3 - 1/4” Trimmed Loin ComboPackagingLOIN ComponentsAdjustment1/4” Trimmed Loin VAC 5.001/4” Trimmed Loin Paper 2.00100.0%-1/4” Trimmed Loin Combo1/8” Trimmed Loin VAC1/8” Trimmed Loin Paper1/8” Trimmed Loin ComboBone-in CC, Tender in VACBnls CC Strap-onBnls CC Strap-offBoneless SirloinBone-in SirloinBlade EndsTenderloinButt TenderBackribs 2.0#/upRiblets72% trim42% TrimFatBoneShrinkLaborTotal Percentage- 100.0%- 96.08%- 96.08%- 96.08%- 61.61%- 38.89%- 34.23%7.75%8.18%7.75%- 12.33%5.11%5.11%1.21%- 10.48% 10.48%1.46%1.46%6.71% 14.70% 18.40%6.42%4.68%5.37%3.67%3.67%3.67%4.79% 15.48% %100.0% 100.00% 100.00% 100.00% 100.00% 100.00% 100.00% 100.00% 100.00% 0.80 5.00 2.00 0.80 6.25 6.25 6.25 5.00 5.00 7.00 10.25 5.75 12.00 0.70 0.70#4 - 1/8” Trimmed Loin VAC#5 - 1/8” Trimmed Loin Paper#6 - 1/8” Trimmed Loin Combo#7 - Bone-in CC, Tender-in Loin VAC#1Table A-2: Butt (shoulder) styles and yields#1 - 1/4” Trimmed Butt VAC#2 - 1/4” Trimmed Butt paper#3 - 1/4” Trimmed Butt comboBUTT Components1/4” Trim Butt VAC1/4” Trim Butt paper1/4” Trim Butt combo1/8” Trim Butt VAC1/4” Trim Steak-Ready Butt VAC1/8” Trim Steak-Ready Butt VAC1/4” Trim Bnls Butt, Vac1/4” Trim Bnls Butt, Poly72% trim42% trimFatBoneShrinkLaborTotal PercentagePackagingAdjustment 4.00 2.00 0.70 4.00 4.25 4.25 5.00 2.00 0.70 0.70USDA is an equal opportunity provider, employer, and lender.#2#3100.0%#8 - Bnls CC, Strap-on Loin#9 - Bnls CC, Strap-off Loin#4-#5--#4 - 1/8” Trimmed Butt#5 - 1/4” Trimmed Steak Ready Butt#6 - 1/8” Trimmed Steak Ready 0.29%100.0% 100.00%0.31%100.0%-6-1.63%2.95%-0.00%100.0%#7#7 - Bnls Butt Vac#8 - Bnls Butt .20%0.32%100.0%7.20%0.32%100.0%
APPENDIX A: YIELD PERCENTAGESTable A-4: Sparerib styles and yields#1 - Trimmed Sparerib - LGT#2 - Trimmed Sparerib - MEDTable A-3: Picnic styles and yields#3 - Picnic Meat Combo Cushion Out#1 - SS Smkr Trim Picnic VAC#2 - SS Smkr Trim Picnic PaperPICNIC ComponentsPackagingAdjustmentSS Smoker Trim Picnic VAC SSSmoker Trim Picnic PaperPicnic Meat Combo Cushion OutPicnic Cushion Meat VAC72% trim42% trimHocksFatSkinBoneShrinkLabor 6.75 2.00 0.75 5.25 0.70 0.70#1#2SPARERIB Components Packaging#1#2Trimmed Sparerib-LGT 8.50 100.0%Trimmed Sparerib-MED 8.50- %ShrinkLaborTotal 0.0%-100.00% 100.00% 100.00%Total PercentageTable A-5: Ham styles and yields#1 - Trmd Selected Ham 20-23#’s#2 - Trmd Selected Ham 23-27#’s#3 - 3 Muscle Ham to BlueHAM ComponentsPackagingTrmd Selected Ham 20-23# 0.80Trmd Selected Ham 23-27# 0.803 Muscle Ham to Blue 0.954 Muscle Ham to Blue 0.955 Muscle Ham to Blue 0.95Roll out ham 0.95Insides 0.95Outsides 0.95KnucklesLite ButtInner ShankOuter Shank72% Trim42% TrimFatSkinBoneShrinkLaborTotal Percentage#1100.0%- 0.95 0.95 0.95 0.95 0.70 0.70#4 - 4 Muscle Ham to Blue#5 - 5 Muscle Ham to Blue#6 - Roll outs#2#3#4100.0%- 44.44%- 46.28%---0.00%100.0%0.00%100.0%USDA is an equal opportunity provider, employer, and 59%100.0%#5#7 - Insides#8 -Outsides#9 - .10%8.29%6.90%10.67%0.58%100.00%
APPENDIX A: YIELD PERCENTAGESTable A-7: Jowl style and yieldTable A-6: Belly styles and yields#1 - Skinned Jowl#1 - Derind Belly 9-13##2 - Derind Belly 13-17#JOWL Components#2#1Derind Belly 9-13#Derind Belly 13-17# 0.7572% Trim 0.7042% Trim 0.70Skinned Jowl Combo81.46% 0.75FatSkinPackaging#1 1%4.81%1.69%Total Percentage1.69%0.77%100.0%10.24% 10.24%0.54%0.54%ShrinkLaborTotal Percentage100.0% 100.0%100.0%APPENDIX B: TRIMMED TO UNTRIMMED ADJUSTMENTS1/4” Trimmed Loin Primal to UntrimmedTrimmed Sparerib Primal to UntrimmedComponent1/4” LoinT/TraceFatSkinDrop Loin%ValueTotalComponent85.08% 70.22 59.74Ribs0.36% 34.05 0.12Fat10.96%3.60%100.00% 19.60 28.55Drop Rib 2.15 1.03%Value95.84% 124.874.16%100.00% 19.60Trimmed Belly Primal to UntrimmedT/TraceFatSkinDrop ButtValueTotalComponent86.42%2.44% 92.00 79.51Belly 34.05 0.836.23% 19.60 22.38 1.224.91%100.00% 0.82 63.04Component1/4” Butt 119.68 120.501/4” Trimmed Butt Primal to Untrimmed%TotalUSDA is an equal opportunity provider, employer, and lender.42% TrimDrop Belly 1.10 82.668%ValueTotal97.99% 131.27 128.632.01% 21.25 0.43100.00% 129.06
APPENDIX C: PRIMAL CUTOUTWEIGHTING/YIELDS FOR COMPOSITE CUTOUTPrimal Yield to 9%Ham24.49%Belly16.27%Jowl1.28%1.75%0.17%Neck BonesTailsFront FeetUSDA is an equal opportunity provider, employer, and lender.Hind Feet1.00%1.29%Cut Loss2.00%9
of the price the plant will pay consumer needs. Sub-primal bone, fat and skin) have value Agricultural Marketing Service United States Department of Agriculture January 2022 Through comprehensive market surveys, case studies, and research partnerships, AMS provides insight into