Transcription
FACTSHEET30th September 2021
Still can’tsee the obvious?Just like you aren’t seeing the growth Equity MutualFunds has been offering since many years.Invest in Equity Mutual Funds today.2
IndexEquity/Index/ETF FundsCommentary - Equity Outlook9Commentary - Debt Outlook16IDFC Large Cap Fund18IDFC Core Equity Fund19IDFC Flexi Cap Fund20IDFC Tax Advantage (ELSS) Fund21IDFC Focused Equity Fund22IDFC Sterling Value Fund23IDFC Emerging Businesses Fund24IDFC Infrastructure Fund25IDFC US Equity Fund of Fund26IDFC Nifty Fund27IDFC Sensex ETF28IDFC Nifty ETF29Hybrid/Fund of FundsIDFC Arbitrage Fund30IDFC Equity Savings Fund31IDFC Balanced Advantage Fund32IDFC Hybrid Equity Fund33IDFC Regular Savings Fund34IDFC Asset Allocation Fund of Funds35IDFC All Seasons Bond Fund37Debt FundsIDFC Overnight Fund39IDFC Cash Fund40IDFC Ultra Short Term Fund41IDFC Low Duration Fund42IDFC Money Manager Fund43IDFC Banking & PSU Debt Fund44IDFC Corporate Bond Fund45IDFC Bond Fund – Short Term Plan46IDFC Bond Fund – Medium Term Plan47IDFC Floating Rate Fund48IDFC Credit Risk Fund49IDFC Bond Fund – Income Plan50IDFC Dynamic Bond Fund51IDFC Government Securities Fund – Constant Maturity Plan52IDFC Government Securities Fund – Investment Plan53IDFC Gilt 2027 Index Fund54IDFC Gilt 2028 Index Fund55Performance Table56SIP Performance61Income Distribution and Capital Withdrawal* History65Fund Manager Details69Investment Objective69Know your Risk-o-meter723
4Blend of “Buy and Hold”and “Tactical" strategies;Currently, focusing onbenefitting from domesticconsumption themeUpto 30 high convictionideas across market capand sectors with mix ofcore and tactical ideasIDFC Large CapFundIDFC Flexi CapFund*IDFC FocusedEquity FundLarge capFlexicapFocusedFollows Value investmentstrategy; currently overweight in mid & small capsA true blue Infrastructurefund focusing to benefitfrom economic growth andinfrastructure developmentPortfolio of high convictionsmall caps which can bethe potential leaders ofthe futureIDFC TaxAdvantage(ELSS) FundIDFC SterlingValue FundIDFCInfrastructureFundIDFC EmergingBusinessesFund#ELSSValueSectoralSmall CapSmall Cap80%Growth Blend ValueMid Cap10%10%Large CapSmall Cap37%Growth Blend ValueMid CapLarge CapSmall CapMid Cap34%30%Growth Blend Value39%34%27%Large CapSmall Cap27%Growth Blend ValueMid Cap18%55%Large CapSmall Cap10%Growth Blend ValueMid Cap37%52%Large CapSmall Cap2%Growth Blend ValueMid CapLarge CapSmall CapMid Cap24%73%Growth Blend Value9%24%67%Large CapSmall Cap2%Growth Blend ValueMid CapLarge Cap15%83%Investment 1143,3492,4991,4365,944897MonthEnd AuM(crs.)PB: 3.1FY21-23 CAGRgrowth: 45.1%PB: 4.3FY21-23 CAGRgrowth: 40.0%PE: 43.5FY21-23 CAGRgrowth : 24.6%FY21-23 CAGRgrowth : 27.3%PE: 40.1PB: 1.6PB: 3.1PE: 16.7FY21-23 CAGRgrowth : 43.2%FY21-23 CAGRgrowth : 37.1%PE: 25.1PB: 3.3PB: 3.4PE: 43.6FY21-23 CAGRgrowth : 26.4%FY21-23 CAGRgrowth : 45.4%PE: 35.0PB: 3.5PB: 3.1PE: 33.0FY21-23 CAGRgrowth : 29.4%FY21-23 CAGRgrowth : 36.0%PE: 36.4PB: 3.6PE: 35.9PB: 3.3PE: 34.4PB: 3.5FY21-23 CAGRgrowth : 27.6%PB: 3.7FY21-23 CAGRgrowth : 36.4%PE: 33.8FY21-23 CAGRgrowth : 27.6%FY21-23 CAGRgrowth : 33.7%PE: 38.4PB: 3.5PB: 5.0PE: 33.8FY21-23 CAGRgrowth : 24.7%FY21-23 CAGRgrowth : 32.2%PE: 44.6PB: 3.5PE: 31.7PB: 4.3PE: 40.6BMPortfolio MetricsFund2113122213Management11111223 Relative ValueEarningsTrajectory3Relative ValueEarningsTrajectory3Positioning3Relative vePositioningFinancial TrackRecord213 Relative Value3 EarningsTrajectory3 CompetitiveFinancial TrackRecord21Relative ValueCompetitivePositioning3Competitive3 PositioningFinancial ngs2 TrajectoryPositioningRelative Value3 Earnings Trajectory2 CompetitiveFinancial TrackRecord3Relative ValueEarnings2 TrajectoryPositioning1Financial TrackRecordScalabilitySectorBenchmark focusManagementScalabilitySectorBenchmark focusManagementScalabilitySector2Benchmark focusManagementScalabilitySectorBenchmark focus 3ManagementRelative ValueEarningsTrajectory2 Competitive1Financial TrackRecord323Competitive3 PositioningFinancial TrackRecord321Financial TrackRecord3ScalabilitySector kfocusManagement3ScalabilitySectorBenchmark focusManagementInvestmentFrameworkS&P BSE 250SmallCap TRIS&P BSE IndiaInfrastructure TRIS&P BSE 400MidSmallCap TRIS&P BSE 200 TRINIFTYLargeMidcap250 TRIS&P BSE 500 TRIS&P BSE 500 TRIS&P BSE 100 TRIBenchmark(% of 2.10%HDFC Bank Ltd.Infosys Ltd.ICICI Bank Ltd.Reliance Industries Ltd.State Bank of IndiaHousing Development Finance Corporation Ltd.Tata Consultancy Services Ltd.Bajaj Finance Ltd.Axis Bank Ltd.Kotak Mahindra Bank Ltd.Infosys Ltd.ICICI Bank Ltd.HDFC Bank Ltd.UltraTech Cement Ltd.State Bank of IndiaTata Consultancy Services Ltd.Atul Ltd.Voltas Ltd.Minda Industries Ltd.Bata India Ltd.ICICI Bank Ltd.Infosys Ltd.HDFC Bank Ltd.State Bank of IndiaReliance Industries Ltd.Bajaj Finance Ltd.Tata Consultancy Services Ltd.Axis Bank Ltd.UltraTech Cement Ltd.Maruti Suzuki India Ltd.ICICI Bank Ltd.Infosys Ltd.HDFC Bank Ltd.State Bank of IndiaAxis Bank Ltd.Reliance Industries Ltd.Bharti Airtel Ltd.ACC Ltd.HCL Technologies Ltd.Deepak Nitrite Ltd.ICICI Bank Ltd.Infosys Ltd.State Bank of IndiaHDFC Bank Ltd.Reliance Industries Ltd.Deepak Nitrite Ltd.Bharti Airtel Ltd.Tata Motors Ltd.HCL Technologies Ltd.KEC International Ltd.ICICI Bank Ltd.Deepak Nitrite Ltd.Jindal Steel & Power Ltd.Gujarat Gas Ltd.Minda Industries Ltd.HCL Technologies Ltd.KEC International Ltd.Voltas Ltd.Radico Khaitan Ltd.Axis Bank Ltd.Larsen & Toubro Ltd.UltraTech Cement Ltd.JK Cement Ltd.PNC Infratech Ltd.Transport Corporation of India Ltd.Bharti Airtel Ltd.H.G. Infra Engineering Ltd.Sagar Cements Ltd.Torrent Power Ltd.Gujarat Gas Ltd.Radico Khaitan Ltd.Shaily Engineering Plastics Ltd.NOCIL Ltd.Birlasoft Ltd.Kajaria Ceramics Ltd.Zensar Technologies Ltd.Balrampur Chini Mills Ltd.TeamLease Services Ltd.Cyient Ltd.GNA Axles Ltd.Top 10 HoldingsTop 10 HoldingsTop 10 IndustryBanksSoftwareFinanceConsumer Non DurablesPetroleum ProductsPharmaceuticalsRetailingCement & Cement ProductsAutoConstruction ProjectBanksSoftwareConsumer DurablesConsumer Non DurablesChemicalsIndustrial ProductsCement & Cement harmaceuticalsPetroleum ProductsFinanceAutoConsumer Non DurablesConsumer DurablesCement & Cement ProductsIndustrial ProductsBanksSoftwarePharmaceuticalsAuto AncillariesCement & Cement ProductsIndustrial ProductsPowerAutoConsumer Non DurablesPetroleum ProductsBanksSoftwareChemicalsCement & Cement ProductsIndustrial ProductsPetroleum ProductsAutoPharmaceuticalsConsumer DurablesFerrous MetalsBanksConsumer Non DurablesConsumer DurablesSoftwareCement & Cement ProductsAuto AncillariesPharmaceuticalsIndustrial ProductsChemicalsFerrous MetalsCement & Cement ProductsConstruction ProjectTransportationConstructionGasIndustrial Capital GoodsFerrous MetalsIndustrial ProductsTelecom - ServicesPowerConsumer Non DurablesIndustrial ProductsSoftwareAuto AncillariesChemicalsConsumer DurablesLeisure ServicesPharmaceuticalsHealthcare .04%7.08%5.69%5.17%4.05%3.73%3.71%(% of -0.470.530.660.550.470.530.66SharpeAnoop BhaskarSachin Relekar(w.e.f. 08thDecember 2020)Anoop Bhaskar,Daylynn PintoDaylynn PintoAnoop BhaskarSumit AgrawalAnoop Bhaskar,Sachin Relekar(w.e.f. 08thDecember 2020)Sumit Agrawal,Arpit KapoorFund Managers"Ratios calculated on the basis of 3 years history of monthly data Ratios calculated on the basis of monthly data Since InceptionFor the investment framework, 3 Very Important, 1 Least Important.The 7-factors considered for each schemes are rated on a relative basis to highlight their respective significance. The numbers do not have any significance in absolute terms.Stable Sectors: Auto, Retail Banks, NBFC, Consumer Staples, Consumer Discretionary, IT Services, Healthcare / Pharma; Cyclical Sectors: Cement/Building Material, Corp Banks, Industrials (including CVs), Utilities, Telecom, Commodities (Metals/Oil & Gas etc).#Note : Ratios are not given as scheme has not completed 3 years. IDFC Infrastructure Fund, IDFC Equity Savings Fund and IDFC Equity Opportunity - Series 4 were being managed by Rajendra Kumar Mishra upto December 7, 2020.Ratios @ is of 30th September 2021.Schemes are sorted basis Standard deviation.*Note: “IDFC Multi Cap Fund” has been re-categorized from the Multi Cap Fund Category to the Flexi Cap Fund category and has been renamed as “IDFC Flexi Cap Fund“ with effect from February 09, 2021. Refer the addendum issued in this regard detailing the changes being carried out to the SID ofthe Scheme which is available on our website i.e. www.idfcmf.com.A multi cap oriented ELSSfund focusing on GARP(Growth at ReasonablePrice)Large andMid capParticipate in growthof top 100 companiesselectively with anopportunistic allocation tomid & small capsPortfolio with focus ofIDFC Core Equity Quality large & mid capFundstocks available at relativelylow valuationsAbout the FundScheme NameCategoryEquity Snapshot as on 30th September 2021
5IDFC Ultra Short Term FundIDFC Money Manager FundIDFC Low Duration FundIDFC Bond Fund – Short Term PlanIDFC Bond Fund – Medium Term PlanIDFC All Season Bond FundIDFC Corporate Bond FundIDFC Banking & PSU Debt FundCoreLiquidity: For very short term parking of surplus or emergency corpusCore: Ideally forms bulk of your allocation – Funds that focus on high credit quality and low to moderate maturity profileSatellite: Funds that can take higher risk – either duration risk or credit risk or bothIDFC Overnight FundIDFC Cash FundLiquidityManagementAssetAllocationIDFC Floating Rate FundIDFC Credit Risk FundCredit RiskInterestRate RiskIDFC Gilt 2028 Index FundIDFC Gilt 2027 Index FundIDFC Government Securities FundConstant Maturity PlanIDFC Dynamic Bond FundIDFC Bond Fund – Income PlanIDFC Government Securities Fund –Income PlanSatellite3 - Lens Debt Allocation Framework
9An open ended liquid scheme(Min. recommended investmenthorizon- 7 days)Invests in money marketinstruments predominantly(Min. recommended investmenthorizon- 6 months)Macaulay duration of the portfoliois between 3 to 6 months(Min. recommended investmenthorizon- 3 months)A FOF structure which typicallyinvests in our debt schemes uptoshort term funds currently. (Min.recommended investment horizon2 years)- A Short term Fund- Avg Maturity ordinarily anchoredaround 2 years currently(Min. recommended investmenthorizon- 2 years)- A dedicated Corporate Bondportfolio- Roll Down Strategy curently(Min. recommended investmenthorizon- 3 years) - An Actively managed fund withMacaulay duration band between3-4 years (Min. recommendedinvestment horizon3 years)IDFC MoneyManager FundIDFC Ultra ShortTerm FundMacaulay duration of the portfolioIDFC Low Duration is between 6 to 12 monthsFund(Min. recommended investmenthorizon- 6 months)- Predominantly invests in highquality money market and debtinstruments of Banks, PSU and PFI.-Roll down strategy currently(Min. recommended investmenthorizon- 3 years) IDFC Cash FundIDFC Banking andPSU Debt Fund IDFC All SeasonsBond Fund IDFC Bond FundShort TermIDFC CorporateBond FundIDFC Bond Fund Medium Term PlanAAAEquivalent 100AAAEquivalent 100AAAEquivalent 100AAAEquivalent 100AAAEquivalent 100AAAEquivalent 100AAAEquivalent 100AAAEquivalent 100AAAEquivalent 100AAAEquivalent 100Month End Asset QualityAuM (crs.)(%) IDFC OvernightFundPositioningInvests in overnight securities / 1Business day residual maturity(Min. recommended investmenthorizon- 1 day)Scheme Name45 days1 day133 days102 days46 ars1.41 years3.13 1.57 years 1.63 years1.35years261 days 236 days 245 days143 days 128 days102 days 99 days46 daysCP : 42.85CB : 6.80TB : 27.42TRI Party Repo/Cash: 22.93CD : 9.44CP : 46.37G Sec/SDL : 2.84TB : 39.32TRI Party Repo/Cash: 2.03CB: 30.50CP : 17.90SDL : 0.75TB : 6.20CD : 2.88Floating Ratenote : 2.12ZCB : 4.66TRI Party Repo/Cash : 34.99CB : 39.13G Sec/SDL : 4.95CP : 16.12CD : 0.97TB : 17.86ZCB : 1.28Floating Ratenote : 1.16Swaps : 1.10TRI Party Repo/Cash eq : 18.53CB : 78.40G Sec/SDL : 11.54CD : 4.81ZCB : 0.02CP : 1.17Floating Ratenote : 0.16TRI Party Repo/Cash eq : 3.91IDFC Banking& PSU DebtFund: 61.60IDFC BondFund-ST: 30.59IDFC CorporateBond Fund : 6.58TRI Party Repo/Cash : 1.23CB : 54.38PTC : 0.57G Sec : 34.88CP : 0.39TB : 0.01ZCB : 0.26TRI Party Repo/Cash : 9.52CP : 0.23CB : 71.14GSec/SDL :25.08ZCB : 0.01TRI Party Repo/Cash : 3.54G Sec/ SDL : 77.76CB : 12.79PTC : 0.83TB : 0.003TRI Party Repo/Cash : 8.60Swaps: 12.441 09%TotalTotalAverage Modified Macaulay Yield toExpense RatioExpenseMaturity Duration Duration Maturity-RegularRatio -DirectTRI Party Repo/Cash eq.: 100.00Asset Allocation(%)Debt Snapshot as on 30th September 2021NilNilNilNilNilNilNilNilInvestor exitDay 2Day 3Day 4upon subscription Day 1Exit load as a% of redemption 0.0070% 0.0065% 0.0060% 0.0055%proceedsInvestor exitDay 6Day 7 onwardsupon subscription Day 5Exit load as a% of redemption 0.0050% 0.0045%0.0000%proceedsNilExit LoadSuyashChoudharyAnurag Mittal& SuyashChoudhary(w.e.f. 28th July2021)SuyashChoudharyHarshal JoshiAnurag Mittal& SuyashChoudhary(w.e.f. 28th July2021)Anurag Mittal& Harshal Joshi(w.e.f. 28th July2021)Harshal JoshiHarshal Joshi &Brijesh Shah(w.e.f. 12th July2021)Harshal Joshi &Anurag MittalBrijesh ShahFund Manager
PositioningAims to provide an optimalrisk-reward profile to investorsby focusing on companies withIDFC Credit Riskwell-run management and evolvingFundbusiness prospects or goodbusinesses with improving financialprofile. (Min. recommendedinvestment horizon- 3years)- Actively managed fundpositioned to take exposure acrossIDFC Dynamic Bond the yield curve depending on fundFundmanager’s view(Min. recommended investmenthorizon- 3years)- Actively Managed Gilt FundPortfolio postioned dependingIDFC G-Sec Fund- -oninterest rate view (Min.Investment Planrecommended investment horizon 3years)- Actively managed fund (MacaulayIDFC Bond Fund - duration between 4-7years)Income Plan(Min. recommended investmenthorizon- 3years)An open-ended Target Maturityfund investing in constituentsIDFC Gilt 2027 Index Indexof CRISIL Gilt 2027 IndexFund(Min. recommended investmenthorizon- 3years)An open-ended Target Maturityfund investing in constituentsIDFC Gilt 2028 Index Indexof CRISIL Gilt 2028 IndexFund(Min. recommended investmenthorizon- 3years)Fund with around 10IDFC Government Giltyears average maturity (Min.Securities Fundrecommendedinvestment horizonConstant Maturity 3years)Predominantly invests in floatingrate instruments (including fixedinstruments convertedIDFC Floating Rate rateto floating rate exposuresFundusing swaps/derivatives) (Min.recommended investment horizon– 6 months)Scheme NameCB : 55.33PTC : 7.89G Sec : 13.64TRI Party Repo/Cash eq : 23.13G Sec : 93.28Cash &Equivalent: 6.72G Sec : 97.39TRI Party Repo/Cash eq : 2.61G Sec : 97.18TRI Party Repo/Cash eq: 2.82G Sec : 101.24TRI Party Repo/Cash eq: (1.24)G Sec : 92.86TRI Party Repo/Cash eq: 7.14G Sec : 95.96TRI Party Repo/Cash eq: 4.04AAAEquivalent 100AAAEquivalent 100AAAEquivalent 100AAAEquivalent 100AAAEquivalent 100AAAEquivalent 1008403,8121,957668915300270AAAEquivalent 97.18AA 2.82CD : 1.16CB : 34.76CP : 17.64Floating Ratenote : 12.30G Sec : 11.47TB : 3.94TRI Party Repo/Cash eq : 18.71Swaps: 45.25Asset Allocation(%)AAAEquivalent 64.40AA 13.28AA 19.34AA- 2.981,260Month End Asset QualityAuM (crs.)(%) 62 year 0.65 .32%0.62%0.72%0.66%0.27%TotalTotalAverage Modified Macaulay Yield toExpense RatioExpenseMaturity Duration Duration Maturity-RegularRatio -DirectDebt Snapshot as on 30th September 2021NilNilNilWithin 365 days:- 10% of invst: Nil- Remaining invst: 1%NilNil1% for 365 daysNilExit LoadLiquidity: For very short term parking of surplus or emergency corpusCore: Ideally form bulk of your allocation – Funds that focus on high credit quality and low to moderate maturity profileSatellite: Funds that can take higher risk – either duration risk or credit risk or bothWherever applicable, GSec/SDL yields have been annualized Asset Quality/Quants calculated is for active fixed income portion (excludes Arbitrage and margin) Has been changed to IDFC Banking & PSU debt fund w.e.f. 12th June '17 The expenses of the scheme will be over and above the expenses charged by the underlying schemes. "Funds are sorted as per average maturity in their respective allocation bucket"Standard Deviation calculated basis monthly returns for past one yearCD: Certificate of Deposit, CP: Commercial Paper, CB: Corporate Bond, ZCB: Zero Coupon Bond, PTC : First Business Receivables Trust, G Sec : Government Bond, SDL : State Government Bond, TB : Treasury Bill, Swaps : Interest rate Swaps . The scheme is currently following a ‘roll down’ investment approach on a tactical basis. This means that ordinarily the average maturity of the scheme’s portfolio is unlikely to increase significantly and may be expected to generally reduce with the passage of time, subject to intermittentperiods of volatility in the maturity profile owing to AUM movement and market conditions. The approach being followed currently is tactical in nature and would be subject to change depending on investment opportunities available without prior notice.The product positioning and intended duration stated in this document is based on current view & is subject to change from time to time.SatelliteAssetAllocationRequirement7Harshal JoshiAnurag Mittal &Harshal Joshi (w.e.f.28th July 2021)Anurag Mittal &Harshal Joshi (w.e.f.28th July 2021)Suyash ChoudharySuyash ChoudharySuyash ChoudharyArvind SubramanianAnurag Mittal &Arvind Subramanian& Suyash Choudhary(w.e.f. 28th July2021)Fund Manager
8InvestmentBucket62Investing in equity, arbitrageand debt with net equityexposure ranging from20-45% and debt exposureranging from 20-35%,remaining being in arbitrageIDFC Equity SavingsFund IDFC Hybrid EquityFund# Provides a combination ofequity (between 65% and80%) and debt (between 20%and 35%) so as to provideboth stability of returnsand potential of growth.Both equity and fixedincome portions are activelymanaged.5872,604182Hybrid fund which offers 15%to 25% participation in theequity markets & 75% to 90%to be invested in fixed incomeIDFC Regular SavingsFund* Dynamically invests betweenEquity and Debt; buys lessIDFC Balanced Advantagewhen markets are expensiveFund (previouslyand more when markets areknown as IDFC Dynamiccheap and is based on theEquity Fund)model that tracks marketvaluation (PE)AuM (crs)PositioningScheme NameAAAEquivalent 100%AAAEquivalent 100%AAAEquivalent 100%AAAEquivalent 100%AssetQuality(%)Equity 77.87CB 4.56G Sec/SDL 7.75Net CurrentAsset 9.82G-Sec/SDL 42.17Equity ETF(IDFC Nifty ETF) 22.59CB 17.01ZCB 1.28Net CurrentAsset 16.94Net Equity ETF(IDFC Nifty ETF) 37.09Arbitrage 40.15CB 5.27TB 8.05Net CurrentAsset 9.44Net Equity 38.69CB 2.38Arbitrage 26.93CP 3.77TB 11.85G Sec 10.87Net CurrentAsset 5.51AssetAllocation(%)17.50%13.48%8.92%3.08%Std. Dev.@1.75 years1.67 years0.69 year2.89 yearsAverageMaturity1.49 years1.43 years0.65 year2.42 yearsModifiedDuration1.54 years1.47 years0.68 year2.50 yearsMacaulayDuration4.35%4.23%3.69%4.93%YTMHybrid Snapshot as on 30th September 2021*Monthly income is not assured and is subject to availability of distributable surplus;Standard Deviation calculated basis monthly returns for the past one year for Regular Savings Fund and for past the three years for IDFC Balanced Advantage Fund, Hybrid Equity Fund and Equity Savings Fund#IDFC Balanced Fund has been repositioned as IDFC Hybrid Equity Fund w.e.f. April 30, 2018.@Please note Std Deviation is of 30th September 2021 For debt allocation only. The Scheme was being managed by Yogik Pitti, Rajendra Kumar Mishra and Harshal Joshi, upto December 7, 2020. Schemes are sorted basis standard deviation "IDFC Dynamic Equity Fund” has been renamed as "IDFC Balanced Advantage Fund“ with effect from May 03, 2021. Refer the addendum issued in this regard: https://idfcmf.com/download-centre/noticesHYBRID FUNDSEquity Portion: Yogik Pitti& Sachin Relekar (w.e.f.08th December 2020) Debt Portion:Harshal JoshiEquity: Sumit AgrawalDebt: Anurag Mittal &Harshal Joshi (w.e.f. 28thJuly 2021)Fund Manager10% of investment: NilRemaining investment:1% if redeemed/switchedout within 1 year fromthe date of allotmentEquity: Anoop BhaskarDebt: Anurag Mittal &Harshal Joshi (w.e.f. 28thJuly 2021)10% of investment: NilRemaining investment:Equity: Arpit Kapoor &1% if redeemed/switched Sumit Agrawalout within 1 year fromDebt: Arvind Subramanianthe date of allotment10% of investment: NilRemaining investment:1% if redeemed/switchedout within 1 year fromthe date of allotment10% of investment: NilRemaining investment:1% if redeemed/switchedout within 1 year fromthe date of allotmentExit Load
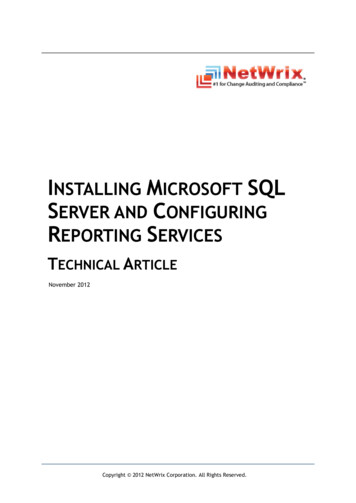
Commentary - Equity OutlookGLOBAL MARKETSGlobal equities fell 4.3% in Septemberprimarily driven by technical selling flowsand some concerns over the downwardshift in economic and business cyclemomentum. Indian equities were broadlyflat (in USD terms), but still outperformedbroader markets in September.In Equities, we expect the market leadershipto continue to shift to Cyclicals/Value, asreceding virus cases and higher rates helpthis internal consolidation along.Source: Bloomberg. Returns are absolute in USD termsBrent and Commodities: Oil prices gained a whopping 10% in September, closing at 79/barrel. Oilprices rose helped by growing fuel demand and a fall in U.S. crude inventories as production remainedhampered in the Gulf of Mexico after two hurricanes.Source: BloombergAverage weekly prices indicate that prices increased across pulses, and oilseeds while vegetables fell andcereals are flat. Price inflation remained high for pulses and oils compared to last year’s levels.Domestic MarketsMSCI India (in local currency) was up 2.2% over the month. Indian markets continue to enjoy the massivebull-run, with NIFTY closing above 17500 levels at month-end. YTD, Indian equities are up 25% , trackingSPX moves up.Record low interest rates, government reform/relief measures (telecoms, autos and banks), improvedvaccine access and subsequent pick-up in service sector activity kept the momentum strong. Somecooling off was seen over the last week with concerns over the US debt ceiling and uptick in global bondyields. MSCI India is now trading at 23.3x on forward earnings, well above its 15Y average of 16.4.Mid-cap stocks performed broadly in line with large caps, while small caps outperformed by c.4% inSeptember. By sector, Energy, Utilities, Communication Services and Discretionary outperformed whileMaterials, Health Care and IT were notable laggards. INR ended at 74.24/USD, down 1.7%. On the flip,DXY rose 1.7% over the month.9
Source: Bloomberg. Less than 1-year absolute returns, Greater than 1-year CAGR. The above graph is for representation purposesonly and should not be used for the development or implementation of an investment strategy. Past performance may or maynot be sustained in the future.Institutional flows: FIIs remained net buyers of Indian equities again ( 1.4bn, following 1.0bn inAugust). FIIs continued to be net buyers in the debt markets too, for the second month, with inflows ofUS 1.5bn in September.DIIs remained massive net equity buyers for the seventh month running ( 809mn, vs 930mn inAugust). Mutual funds were net equity buyers at US 911mn while insurance funds net sold US 559mn ofequities in September. Mutual fund and insurance fund flow data is as of 28th September.Source: BloombergQ1FY22 EarningsJune-quarter results were strong (benefitting from lower base last year), but reflected increasing marginpressure and moderation in top-line momentum. BSE index (864 stocks) delivered 166% YoY growthin adjusted profits in 1QFY22 – in part due to favourable base effects from 2020. Close to 45% of YoYgrowth was on account of materials companies.Rural demand encouraging: Steady improvement in consumer sentiment in Rural has been aided by Rainfall normalisation (from -9% of LPA at end Aug’21 to -2% as of 24Sep’21), Continued vaccination progress (43% population with dose 1 as of 20Sep’21) and limited COVIDinfections (c.30K/daily) Resumption of schools/colleges in the last one month has further boosted sentiment, particularly inNorth and Eastern India10
Sectoral ImpactBy sector, IT Services, Telecom, and Oil & Gas outperformed while Materials, Auto and Health Care werenotable laggards in August.The push-in IT services was so strong that even the unexpected INR strengthening during the last daysof August/ early days of September didn't seem to have any impact on the underlying sentiments for thefavoured sector. It was the sector of the month.Sectoral Performance as of September 30, 2021Source: Bloomberg. Returns are absoluteThe Macro PictureMacro prints have been mixed – service sector PMI rebounded to a 18mth high, while core prices provingto be much stickier. August PMI was a mixed bag with Services PMIs bounced back but to varying degrees and manufacturingindex falling 3pts to print at 52.3 - reflecting the relaxation of restrictions, fading risk-aversion andimproved vaccine access. August CPI was at 5.3% YoY with softer food prices (though vegetable prices remained volatile) IP printed above expectations at 11.5% YoY in July GST collections grew 23% YoY in September to Rs 1.17tn – the 11th consecutive month with collectionsof more than Rs1tn starting October last year (exception of June 2021)11
FYTD22 net direct tax collection until 22Sep’21 expanded 74.4% YoY, with securities transaction taxalmost touching the budget target in Sep’21 itself Fiscal deficit for Apr-August came at Rs4.68tn or 31.1% of the budgeted FY22 deficitGlobal uncertainty emerges FED tapering: The FED signaled to soon commence tapering with median forecasts hinting at ratehikes in 2022 Evergrande Crisis: China’s 2nd largest real estate company, Evergrande is struggling to avoid defaultwhich could led to a contagion that permeates across overall liability default risk worth USD 500bn isan extension of the evolving Chinese construction sector stress over the past 3-6 months. China’s power crises which is slowing down several industries in China. Factories in several provincesincluding Guangdong, an industrial hub, have been directed to conserve power which forced factoriesto reduce output with some even temporarily suspending operations. These restrictions have intensifiedfurther. China’s efforts to source coal have led to a sharp surge in demand but supply remains short dueto supplies from Indonesia and Colombia being impacted by heavy rains while some mines elsewherehave closed because of the pandemic. Europe has seen the energy crisis deepen as well with the fearbeing that as winter sets in, the situation in China & EU could worsen further.Other Updates India Telecom: The Union Cabinet approved reforms to address near-term liquidity needs for theTelecom sector: 1) a 4-year moratorium on AGR & spectrum dues, 2) AGR redefinition to exclude nontelecom revenues, 3) Rationalization of interest & penalties on license and SUC fees, 4) Options tosurrender spectrum and removal of SUC on spectrum acquired in future, 5) Option to Telecoms to payinterest from deferment by equity. Airlines: (i) The Aviation ministry raised airlines capacity to 85%, up from 72.5%; (ii) Tata group hasreportedly won the bid for Air India’s acquisition. Metals: (i) India's crude steel output is expected to increase 18% to 120 million tonnes by the end of thisFY; (ii) Coal India Ltd to augment fuel supply to power utilities to replenish the lowering coal stocks; (iii)Vedanta Resources Ltd, MEIL and Great Eastern Shipping have also submitted expressions of interestfor buying out the government’s 63.75% stake in Shipping Corp. Oil & Gas: (i) CCI approves acquisition of ONGC Tripura Power Company Limited by GAIL (India)Limited; (ii) BPCL Chairman states completion of BPCL disinvestment by FY22; and (iii) Governmenthikes the price of natural gas by 63%. Financials: (i) The Finance Ministry extended the ECLGS scheme till FY22, or till guarantees for theoverall ceiling of Rs 4.5 trillion are issued, whichever is earlier; (ii) The GoI announced a guarantee forBad bank or Nationa
Software 19.41% ICICI Bank Ltd. 6.67% Finance 8.69% Reliance Industries Ltd. 6.12% Consumer Non Durables 6.90% State Bank of India 6.08% Petroleum Products 6.12% Housing Development Finance Corporation Ltd. 4.78% Pharmaceuticals 3.58% Tata Consultancy Services Ltd. 4.15% Retailing 3.57% Bajaj F