Transcription
National VitalStatistics ReportsVolume 69, Number 12November 17, 2020United States Life Tables, 2018by Elizabeth Arias, Ph.D., and Jiaquan Xu, M.D., Division of Vital StatisticsAbstractIntroductionObjectives—This report presents complete period life tablesfor the United States by Hispanic origin, race, and sex, based onage-specific death rates in 2018.Methods—Data used to prepare the 2018 life tables are2018 final mortality statistics; July 1, 2018 population estimatesbased on the 2010 decennial census; and 2018 Medicare datafor persons aged 66–99. The methodology used to estimatethe life tables for the Hispanic population remains unchangedfrom that developed for the publication of life tables by Hispanicorigin for data year 2006. The methodology used to estimatethe 2018 life tables for all other groups was first implementedwith data year 2008. In 2018, all 50 states and the District ofColumbia reported deaths by race based on the 1997 Office ofManagement and Budget revised standards for the classificationof federal data on race and ethnicity. As a result, race-specificlife tables for 2018 presented in this report are based on thenew standard and show estimates for single-race groups. Theseestimates are not completely comparable with those of previousyears, which are based on bridged-race groups. To show trendsand document the impact of changing to the 1997 standards, lifeexpectancy estimates for 2006–2018 are reported for bridgedrace categories that were in use starting with data year 2000.Results—In 2018, the overall expectation of life at birthwas 78.7 years, increasing from 78.6 in 2017. Between 2017and 2018, life expectancy at birth increased by 0.1 year formales (76.1 to 76.2) and females (81.1 to 81.2). In 2018, lifeexpectancy at birth was 81.8 for the Hispanic population, 78.6for the non-Hispanic single-race white population, and 74.7 forthe non-Hispanic single-race black population.There are two types of life tables: the cohort (or generation)life table and the period (or current) life table. The cohort lifetable presents the mortality experience of a particular birthcohort—all persons born in the year 1900, for example—fromthe moment of birth through consecutive ages in successivecalendar years. Based on age-specific death rates observedthrough consecutive calendar years, the cohort life table reflectsthe mortality experience of an actual cohort from birth until nolives remain in the group. To prepare just a single completecohort life table requires data over many years. It is usuallynot feasible to construct cohort life tables entirely on the basisof observed data for real cohorts due to data unavailability orincompleteness (1). For example, a life table representation ofthe mortality experience of a cohort of persons born in 1970would require the use of data projection techniques to estimatedeaths into the future (2,3).Unlike the cohort life table, the period life table does notrepresent the mortality experience of an actual birth cohort.Rather, the period life table presents what would happen to ahypothetical cohort if it experienced throughout its entire life themortality conditions of a particular period in time. For example,a period life table for 2018 assumes a hypothetical cohort thatis subject throughout its lifetime to the age-specific death ratesprevailing for the actual population in 2018. The period life tablemay thus be characterized as rendering a “snapshot” of currentmortality experience and shows the long-range implications of aset of age-specific death rates that prevailed in a given year. Inthis report the term “life table” refers only to the period life tableand not to the cohort life table.Life tables can be classified in two ways according to thelength of the age interval in which data are presented. A completelife table contains data for every single year of age. An abridgedlife table typically contains data by 5- or 10-year age intervals. Acomplete life table can easily be aggregated into 5- or 10-yearage groups (see Technical Notes for instructions). Other than thedecennial life tables, U.S. life tables based on data before 1997Keywords: life expectancy survival death rates Hispanicorigin race National Vital Statistics SystemU.S. DEPARTMENT OF HEALTH AND HUMAN SERVICESCenters for Disease Control and PreventionNational Center for Health StatisticsNational Vital Statistics SystemNCHS reports can be downloaded from: https://www.cdc.gov/nchs/products/index.htm.
2National Vital Statistics Reports, Vol. 69, No. 12, November 17, 2020are abridged life tables constructed by reference to a standardtable (4).Beginning with the 2018 data year, all 50 states and theDistrict of Columbia reported deaths based on the 2003 revisionof the U.S. Standard Certificate of Death for the entire year(5). The revision is based on the 1997 Office of Managementand Budget (OMB) revised standards for the classification offederal data on race and ethnicity (6). The 1997 standard allowsindividuals to report more than one race and increased the racechoices from four to five by separating the Asian and PacificIslander groups. The Hispanic category remained consistentwith previous publications. The new categories included inthis report are Hispanic, non-Hispanic single-race white, andnon-Hispanic single-race black. These categories differ fromthe bridged-race categories shown in previous reports. Lifeexpectancy estimates for bridged-race categories are includedin this report for years 2006–2018 to document the effect ofthe change in race standards and show trends. Estimates forbridged-race categories will continue to be calculated throughdata year 2020; see Technical Notes and “Comparability of racespecific mortality data based on 1977 versus 1997 reportingstandard” for more information on differences between singleand bridged-race groups (7).This report presents complete period life tables bysex for the Hispanic, non-Hispanic single-race white, andnon-Hispanic single-race black populations based on the 1997OMB revised standards for the reporting of race and ethnicity.For years 2000–2017, multiple-race mortality data were bridgedto single-race categories based on the 1977 OMB standardsfor the classification of race and ethnicity (8). As a result,single-race categories based on the 1997 standards are notcompletely comparable with those based on the 1977 standards.Comparisons between data years 2000–2017 and 2018 should beinterpreted taking these differences into account. In this report,life expectancy for 2018 by race is calculated for both singleand bridged-race groups to illustrate the impact of the transitionto the 1997 standards. The Hispanic category is consistent withprevious reports because the classification of Hispanic origin didnot change between standards (6,8). In the remainder of thisreport, “race” refers to “single race” based on the 1997 standard.Data and MethodsThe data used to prepare the U.S. life tables for 2018are final numbers of deaths for the year 2018; July 1, 2018population estimates based on the 2010 decennial census;and age-specific death and population counts for Medicarebeneficiaries aged 66–99 for the year 2018 from the Centers forMedicare & Medicaid Services. Data from the Medicare programare used to supplement vital statistics and census data for ages66 and over. The U.S. life tables by Hispanic origin are basedon death rates that have been adjusted for race and ethnicitymisclassification on death certificates using classification ratios(or correction factors) generated from an updated evaluation ofHispanic origin and race misclassification on death certificatesin the United States (9). (See Technical Notes for a detaileddescription of the data sets and methodology used to estimateHispanic origin life tables).In 2018, all 50 states and the District of Columbia reporteddeaths by race based on the 1997 Office of Management andBudget revised standards for the classification of federal data onrace and ethnicity. The 1997 standards allow individuals to reportmore than one race and increased the race choices from four tofive by separating the Asian and Pacific Islander groups. Hispanicorigin did not change between standards (6). The Hispanic originand race categories included in this report include Hispanic,non-Hispanic single-race white, and non-Hispanic single-raceblack; see Technical Notes and race report (title forthcoming) formore information on differences in mortality between single- andbridged-race groups (7).Expectation of lifeThe most frequently used life table statistic is life expectancy(ex ), which is the average number of years of life remaining forpersons who have attained a given age (x). Life expectancy andother life table values for each age in 2018 are shown for the totalpopulation and by Hispanic origin, race, and sex in Tables 1–12.Life expectancy is summarized by age, Hispanic origin, race, andsex in Table A.Life expectancy at birth (e0) for 2018 for the total populationwas 78.7 years. This represents the average number of yearsthat the members of the hypothetical life table cohort can expectto live at the time of birth (Table A).Survivors to specified agesAnother way of assessing the longevity of the period lifetable cohort is by determining the proportion that survives tospecified ages. The lx column of the life table provides the datafor computing this proportion. Table B summarizes the numberof survivors by age, Hispanic origin, race, and sex. To illustrate,58,141 persons out of the original 2018 hypothetical life tablecohort of 100,000 (or 58.1%) were alive at exact age 80. In otherwords, the probability that a person will survive from birth toage 80, given 2018 age-specific mortality, is 58.1%. Probabilitiesof survival can be calculated at any age by simply dividing thenumber of survivors at the terminal age by the number at thebeginning age. For example, to calculate the probability ofsurviving from age 20 to age 85, one would divide the numberof survivors at age 85 (42,800) by the number of survivors atage 20 (98,964), which results in a 43.2% probability of survival.Explanation of the columns of the life tableColumn 1. Age (between x and x 1)—Shows the ageinterval between the two exact ages indicated. For instance,“20–21” means the 1-year interval between the 20th and 21stbirthdays.Column 2. Probability of dying (qx)—Shows the probabilityof dying between ages x and x 1. For example, for males in theage interval 20–21 years, the probability of dying is 0.001082(Table 2). This column forms the basis of the life table; allsubsequent columns are derived from it.
National Vital Statistics Reports, Vol. 69, No. 12, November 17, 2020Table A. Expectation of life, by age, Hispanic origin, race for the non-Hispanic population, and sex: United States, 2018Hispanic1All originsNon-Hispanic white1Non-Hispanic maleTotalMaleFemale0. . . . . . . . . . . . . . . . . . . .1. . . . . . . . . . . . . . . . . . . .5. . . . . . . . . . . . . . . . . . . .10. . . . . . . . . . . . . . . . . . .15. . . . . . . . . . . . . . . . . . .20. . . . . . . . . . . . . . . . . . .25. . . . . . . . . . . . . . . . . . .30. . . . . . . . . . . . . . . . . . .35. . . . . . . . . . . . . . . . . . .40. . . . . . . . . . . . . . . . . . .45. . . . . . . . . . . . . . . . . . .50. . . . . . . . . . . . . . . . . . .55. . . . . . . . . . . . . . . . . . .60. . . . . . . . . . . . . . . . . . .65. . . . . . . . . . . . . . . . . . .70. . . . . . . . . . . . . . . . . . .75. . . . . . . . . . . . . . . . . . .80. . . . . . . . . . . . . . . . . . .85. . . . . . . . . . . . . . . . . . .90. . . . . . . . . . . . . . . . . . .95. . . . . . . . . . . . . . . . . . .100 ife tables by Hispanic origin are based on death rates that have been adjusted for race and ethnicity misclassification on death certificates. Updated classification ratios were applied; seeTechnical Notes.SOURCE: National Center for Health Statistics, National Vital Statistics System, Mortality.Table B. Number of survivors out of 100,000 born alive, by age, Hispanic origin, race for the non-Hispanic population, and sex:United States, 2018Hispanic1All originsNon-Hispanic white1Non-Hispanic maleTotalMaleFemale0. . . . . . . . . . . . . . . . . . . .1. . . . . . . . . . . . . . . . . . . .5. . . . . . . . . . . . . . . . . . . .10. . . . . . . . . . . . . . . . . . .15. . . . . . . . . . . . . . . . . . .20. . . . . . . . . . . . . . . . . . .25. . . . . . . . . . . . . . . . . . .30. . . . . . . . . . . . . . . . . . .35. . . . . . . . . . . . . . . . . . .40. . . . . . . . . . . . . . . . . . .45. . . . . . . . . . . . . . . . . . .50. . . . . . . . . . . . . . . . . . .55. . . . . . . . . . . . . . . . . . .60. . . . . . . . . . . . . . . . . . .65. . . . . . . . . . . . . . . . . . .70. . . . . . . . . . . . . . . . . . .75. . . . . . . . . . . . . . . . . . .80. . . . . . . . . . . . . . . . . . .85. . . . . . . . . . . . . . . . . . .90. . . . . . . . . . . . . . . . . . .95. . . . . . . . . . . . . . . . . . .100 39541,22525,31411,3573,2181Life tables by Hispanic origin are based on death rates that have been adjusted for race and ethnicity misclassification on death certificates. Updated classification ratios were applied; seeTechnical Notes.SOURCE: National Center for Health Statistics, National Vital Statistics System, Mortality.3
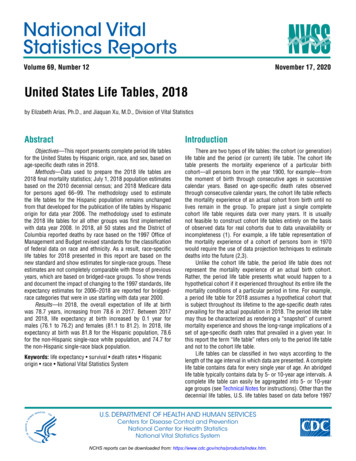
4National Vital Statistics Reports, Vol. 69, No. 12, November 17, 2020Column 3. Number surviving (lx)—Shows the number ofpersons from the original hypothetical cohort of 100,000 livebirths who survive to the beginning of each age interval. The lxvalues are computed from the qx values, which are successivelyapplied to the remainder of the original 100,000 persons stillalive at the beginning of each age interval. Thus, out of 100,000female babies born alive, 99,494 will complete the first year oflife and enter the second; 99,360 will reach age 10; 99,151 willreach age 20; and 49,763 will live to age 85 (Table 3).Column 4. Number dying (dx)—Shows the number dyingin each successive age interval out of the original 100,000 livebirths. For example, out of 100,000 males born alive, 621 will diein the first year of life; 107 between ages 20 and 21; and 1,003after reaching age 100 (Table 2). Each figure in column 4 is thedifference between two successive figures in column 3.Column 5. Person-years lived (Lx)—Shows the number ofperson-years lived by the hypothetical life table cohort within anage interval x to x 1. Each figure in column 5 represents thetotal time (in years) lived between two indicated birthdays byall those reaching the earlier birthday. Thus, the figure 98,732for males in the age interval 20–21 is the total number of yearslived between the 20th and 21st birthdays by the 98,785 males(column 3) who reached their 20th birthday out of 100,000males born alive (Table 2).Column 6. Total number of person-years lived (Tx)—Showsthe total number of person-years that would be lived after thebeginning of the age interval x to x 1 by the hypothetical lifetable cohort. For example, the figure 5,638,574 is the totalnumber of years lived after attaining age 20 by the 98,785 malesreaching that age (Table 2).Column 7. Expectation of life (ex)—The expectation of lifeat any given age is the average number of years remaining tobe lived by those surviving to that age, based on a given setof age-specific rates of dying. It is derived by dividing the totalperson-years that would be lived beyond age x by the numberof persons who survived to that age interval (Tx /lx). Thus, theaverage remaining lifetime for males who reach age 20 is 57.1years (5,648,574 divided by 98,785) (Table 2).ResultsLife expectancy in the United StatesTables 1–12 show complete life tables for 2018 by Hispanicorigin, race, and sex. Table A summarizes life expectancy by age,Hispanic origin, race, and sex. Life expectancy at birth for 2018represents the average number of years that a group of infantswould live if they were to experience throughout life the agespecific death rates in 2018. In 2018, life expectancy at birth was78.7 years, increasing by 0.1 year from 78.6 in 2017 (Table 13).The difference in life expectancy between the sexes was 5.0years in 2018, which was unchanged from 2017. From 1900through 1975, the difference in life expectancy between the sexesincreased from 2.0 years to 7.8 years (Figure 1 and Table 13).The increasing gap during these years is attributed to increasesin male mortality due to ischemic heart disease and lung cancer,both of which increased largely as the result of men’s early andwidespread adoption of cigarette smoking (10,11). Between1979 and 2010, the difference in life expectancy between thesexes narrowed from 7.8 years to 4.8 years and then increasedto 5.0 in 2017 (Figure 1 and Table 13).The 2018 life table may be used to compare life expectancy atany age from birth onward. On the basis of mortality experiencedin 2018, a person aged 65 could expect to live an average of 19.5more years, for a total of 84.5 years; a person aged 85 couldexpect to live an additional 6.6 years, for a total of 91.6 years;and a person aged 100 could expect to live an additional 2.2years, on average (Table A).Changes in mortality by age and cause of death can have amajor effect on life expectancy. Life expectancy between 2017and 2018 increased due to decreases in mortality from cancer,unintentional injuries, Chronic lower respiratory diseases, heartdisease, homicide, and increases in mortality from Influenza andpneumonia, suicide, Nutritional deficiencies, Chronic liver diseaseand cirrhosis, and Parkinson disease. For males, life expectancyincreased due to decreases in mortality from unintentionalinjuries, cancer, homicide, Chronic lower respiratory diseases,Viral hepatitis, and increases in mortality from Influenza andpneumonia, suicide, Chronic liver disease and cirrhosis,kidney disease, and Nutritional deficiencies. For females, lifeexpectancy increased due to decreases in mortality from cancer,unintentional injuries, heart disease, Chronic lower respiratorydiseases, stroke, and increases in mortality from Influenza andpneumonia, Nutritional deficiencies, suicide, Parkinson disease,and Chronic liver disease and cirrhosis (5).Life expectancy by Hispanic origin and raceAmong the six Hispanic-origin and race–sex groups(Figure 2), Hispanic females have the highest life expectancyat birth (84.3 years), followed by non-Hispanic white females(81.1), Hispanic males (79.1), non-Hispanic black females(78.0), non-Hispanic white males (76.2), and non-Hispanic blackmales (71.3). The smallest difference is between Hispanic malesand non-Hispanic black females, with Hispanic males havingan advantage of 1.1 years. The largest difference is betweenHispanic females and non-Hispanic black males, with Hispanicfemales having a life expectancy at birth 13.0 years greater.Life expectancy did not change from 2017 to 2018 for thetotal (81.8), male (79.1), and female (84.3) Hispanic populations(Figure 3 and Table 13). Since 2006, when life tables by Hispanicorigin were added to the U.S. life table program, life expectancyat birth increased by 1.6 years (77.5 to 79.1) for Hispanic males,1.5 years (80.3 to 81.8) for the total Hispanic population, and 1.4years (82.9 to 84.3) for Hispanic females (Figure 3). Changes inlife expectancy between 2017 and 2018 for the non-Hispanic whiteand non-Hispanic black populations are discussed below in thesection “Effects of the transition to the 1997 race standard onlife expectancy.”Survivorship in the United StatesTable B summarizes the number of survivors out of 100,000persons born alive (lx) by age, Hispanic origin, race, and sex for2018. In 2018, 99.4% of all infants born in the United Statessurvived the first year of life; 99.0% survived to age 20; 83.8%
National Vital Statistics Reports, Vol. 69, No. 12, November 17, 20205Figure 1. Life expectancy, by sex: United States, 1900–20189080FemaleTotal70Age 7019801990200020102018SOURCE: National Center for Health Statistics, National Vital Statistics System, Mortality.survived to age 65; 42.8% survived to age 85; and 1.9% survivedto age 100.Survivorship by Hispanic origin and raceIn 2018, 99.5% of Hispanic and non-Hispanic whiteinfants survived the first year of life, compared with 98.9% ofnon-Hispanic black infants (Figure 4 and Table B). For both theHispanic and non-Hispanic white populations, 99.1% survivedto age 20; 98.1% of the non-Hispanic black population survivedto age 20. By age 65, the Hispanic population has a clearsurvival advantage compared with the other two populations.Overall, 87.7% of the Hispanic population survived to age 65,compared with 83.7% of the non-Hispanic white and 76.3%of the non-Hispanic black populations. The Hispanic survivaladvantage increases with age so that by age 85, 52.3% of theHispanic population has survived compared with 42.4% ofthe non-Hispanic white and 33.3% of the non-Hispanic blackpopulations.Effects of the transition to the 1997 racestandard on life expectancyTable C presents life expectancy at select ages by sex for thenon-Hispanic white and non-Hispanic black populations based onbridged race and the 1997 single-race standard in 2018. Singlerace life expectancy at birth was lower by 0.1 year than bridged-race life expectancy for the non-Hispanic white population andby 0.2 year for the non-Hispanic black population. There were nodifferences in life expectancy between the two race standards atany other ages or by sex for the non-Hispanic white population.Among the non-Hispanic black population, life expectancy at birthfor single race was 0.2 and 0.1 year lower for males and females,respectively. Life expectancy at age 65 for single race was lowerthan bridged race by 0.1 year for both non-Hispanic black malesand females.Based on bridged race, life expectancy at birth increased by0.2 year for the total non-Hispanic white population and by 0.1year for non-Hispanic white males and females between 2017and 2018 (Table 13). For the non-Hispanic black population,life expectancy at birth by bridged race did not change for thetotal or either males or females between 2017 and 2018. Theeffects of transitioning from bridged race to single race was toreduce the 0.2 year increase in life expectancy to 0.1 year forthe non-Hispanic white population. For the non-Hispanic blackpopulation, the transition led to a decline in life expectancy of 0.2year from no change between 2017 and 2018.
6National Vital Statistics Reports, Vol. 69, No. 12, November 17, 2020Figure 2. Life expectancy at birth, by Hispanic origin and race and sex: United States, 2018908584.381.1Age (years)8079.178.076.27571.370650Hispanic femaleNon-Hispanicwhite femaleHispanic maleNon-Hispanicblack femaleNon-Hispanicwhite maleNon-Hispanicblack maleSOURCE: National Center for Health Statistics, National Vital Statistics System, Mortality.Figure 3. Life expectancy at birth among the Hispanic population, by sex: United States, 2006–20189085FemaleAge E: National Center for Health Statistics, National Vital Statistics System, Mortality.2012201320142015201620172018
7National Vital Statistics Reports, Vol. 69, No. 12, November 17, 2020Figure 4. Percentage surviving, by Hispanic origin and race, age, and sex: United States, 2018100Hispanic female80Non-Hispanic single-race white femaleHispanic male60PercentNon-Hispanic single-race black femaleNon-Hispanic single-race white male40Non-Hispanic single-race black male20001020304050Age (years)60708090100SOURCE: National Center for Health Statistics, National Vital Statistics System, Mortality.Table C. Comparison of life expectancy at selected ages between bridged-race and single-race standards: United States, 2018TotalMaleBridged raceSingle raceBridged raceSingle 9.67.32.778.019.57.32.7Bridged raceNon-Hispanic white0. . . . . . . . . . . . . . . . . . . . . . . . . . . . . . . . . . . . . . . . .65. . . . . . . . . . . . . . . . . . . . . . . . . . . . . . . . . . . . . . . .85. . . . . . . . . . . . . . . . . . . . . . . . . . . . . . . . . . . . . . . .100. . . . . . . . . . . . . . . . . . . . . . . . . . . . . . . . . . . . . . .Non-Hispanic black0. . . . . . . . . . . . . . . . . . . . . . . . . . . . . . . . . . . . . . . . .65. . . . . . . . . . . . . . . . . . . . . . . . . . . . . . . . . . . . . . . .85. . . . . . . . . . . . . . . . . . . . . . . . . . . . . . . . . . . . . . . .100. . . . . . . . . . . . . . . . . . . . . . . . . . . . . . . . . . . . . . .12Race categories are consistent with 1977 Office of Management and Budget (OMB) standards.Race categories are consistent with 1997 OMB standards.2SOURCE: National Center for Health Statistics, National Vital Statistics System, Mortality.1FemaleSingle raceRace for non-Hispanic population and age121
8National Vital Statistics Reports, Vol. 69, No. 12, November 17, 16.Shryock HS, Siegel JS, Larmon EA. The methods and materials ofdemography, vol 2. U.S. Bureau of the Census. Washington, DC:U.S. Government Printing Office. 1971.Moriyama IM, Gustavus SO. Cohort mortality and survivorship:United States death-registration states, 1900–1968. NationalCenter for Health Statistics. Vital Health Stat 3(16). 1972. Availablefrom: https://www.cdc.gov/nchs/data/series/sr 03/sr03 016.pdf.Preston SM, Heuveline P, Guillot M. Demography: Measuring andmodeling population processes. Oxford: Blackwell Publishers.2001.Sirken MG. Comparison of two methods of constructing abridgedlife tables by reference to a “standard” table. National Center forHealth Statistics. Vital Health Stat 2(4). 1966. Available from:https://www.cdc.gov/nchs/data/series/sr 02/sr02 004.pdf.Murphy SL, Xu JQ, Kochanek KD, Arias E, Tejada-Vera B. Deaths:Final data for 2018. National Vital Statistics Reports; vol 69 no 13.Hyattsville, MD: National Center for Health Statistics. 2020.Office of Management and Budget. Revisions to the standards forthe classification of federal data on race and ethnicity. Fed Regist62(210):58782–90. 1997. Available from: pdf/97-28653.pdf.Heron M. Comparability of race-specific mortality data based on1977 versus 1997 reporting standards. National Vital StatisticsReports. Hyattsville, MD: National Center for Health Statistics.[Forthcoming].Office of Management and Budget. Race and ethnic standardsfor federal statistics and administrative reporting. StatisticalPolicy Directive 15. 1977. Available from: dged-race/Directive15.html.Arias E, Heron M, Hakes JK. The validity of race and Hispanicorigin reporting on death certificates in the United States: Anupdate. National Center for Health Statistics. Vital Health Stat2(172). 2016. Available from: https://www.cdc.gov/nchs/data/series/sr 02/sr02 172.pdf.Waldron I. Recent trends in sex mortality ratios for adults indeveloped countries. Soc Sci Med 36(4):451–62. 1993.Kochane
There are two types of life tables: the cohort (or generation) life table and the period (or current) life table. The cohort life table presents the mortality experience of a particular birth cohort—all persons born in the year 1900, for example—from the moment of birth through consecutive ages in successive calendar years.