Transcription
SPSS Step-by-StepTutorial: Part 1For SPSS Version 11.5
DataStep Development 2004
Table of Contents1SPSS Step-by-StepIntroduction 5Installing the Data56Installing files from the Internet 6Installing files from the diskette 6Introducing the interface6The data view 7The variable view 7The output view 7The draft view 10The syntax view 10What the heck is a crosstab?212Entering and modifyingdata 13Creating the data definitions: the variable view13Variable types 13SPSS Step-by-Step3
Variable names and labels 15Missing values 15Non-numeric numbers, or when is a number not anumber? 15Binary variables 15Creating a new data set 16Getting help in creating data sets and definingvariables 22Creating primary reference lists 24Frequencies 24Descriptive statistics: descriptives (univariate) 25Recodes and Transformations 26Backup the original file 26Recoding existing variables 27Recode income data 27Recoding variables revisited 37The one exception in recoding variablesThe other exception 3734SPSS Step-by-StepCharting your data39Using the automated chart function40Using the Interactive Chart functionCreating a chart from scratch 454237
1SPSS Step-by-StepIntroductionSPSS (Statistical Package for the Social Sciences) has now been in development formore than thirty years. Originally developed as a programming language for conducting statistical analysis, it has grown into a complex and powerful applicationwith now uses both a graphical and a syntactical interface and provides dozens offunctions for managing, analyzing, and presenting data. Its statistical capabilitiesalone range from simple perentages to complex analyses of variance, multipleregressions, and general linear models. You can use data ranging from simple integers or binary variables to multiple response or logrithmic variables. SPSS alsoprovides extensive data management functions, along with a complex and powerfulprogramming language. In fact, a search at Amazon.com for SPSS books returns2,034 listings as of March 15, 2004.In these two sessions, you won’t become an SPSS or data analysis guru, but youwill learn your way around the program, exploring the various functions for managing your data, conducting statistical analyses, creating tables and charts, and preparing your output for incorporation into external files such as spreadsheets andword processors. Most importantly, you’ll learn how to learn more about SPSS.SPSS Step-by-Step5
Installing the DataInstalling the DataThe data for this tutorial is available on floppy disk (if you received this tutorial aspart of a class) and on the Internet. Use one of the following procedures to installthe data on your computer.Installing files from the InternetBefore you begin to download the files, create a new folder on your computer’shard disk named SPSSTutorialData. When you download the files, you’ll savethem in this directory.1.Go to ftp.datastep.com. Do not type “www” or “http://”.2.When prompted for a user name, enter: SPSS3.For the password, enter: tutorial.4.To download each file, click it once, press Ctrl-C or select Edit Copy from themenu.5.Switch to a window for your computer and save the file in the directory namedSPSSTutorialData. To do so, open the folder and press Ctrl-V or select Edit Paste from the menu.6.Once you have downloaded all the files, close the Internet browser.Installing files from the diskette1.With the diskette in the floppy drive, open a window for the C drive on yourcomputer (or any other drive where you want to save the data files).2.Create a new folder named SPSSTutorialData.3.Copy the files from the floppy disk to the SPSSTutorialData folder by copyingand pasting or by dragging.Introducing the interfaceWhen you use SPSS, you work in one of several windows: the data view, the variable view, the output view, the draft output view, and the script view. Eventuallyyou’ll also use the syntax editor (think: code) to save or refine your queries.6SPSS Step-by-Step
Introducing the interfaceThe data viewThe data view displays your actual data and any new variables you have created(we’ll discuss creating new variables later on in this session).1.From the menu, select File Open Data.2.In the Open File window, navigate to C:\SPSSTutorialData\Employee data.savand open it by double-clicking. SPSS opens a window that looks like a standardspreadsheet. In SPSS, columns are used for variables, while rows are used forcases (also called records).3.Press Ctrl-Home to move to the first cell of the data view.4.Press Ctrl-End to move to the last cell of the data view.5.Press Ctrl-Home again to move back to the first cell.The variable view‘At the bottom of the data window, you’ll notice a tab labeled Variable View. Thevariable view window contains the definitions of each variable in your data set,including its name, type, label, size, alignment, and other information.1.Click the Variable View tab.2.Review the information in the rows for each variable.Note: While the variables are listed as columns in the Data View, they are listed asrows in the Variable View. In the Variable View, each column is a kind ofvariable itself, containing a specific type of information.3.Click the Data View tab to return to the data.4.Double-click the label id at the top of the id column. Notice that double-clickingthe name of a variable in the data view opens the variable view window to thedefinition of that variable.5.Click the data view tab again.The output viewThe output window is where you see the results of your various queries such as frequency distributions, cross-tabs, statistical tests, and charts. If you’ve worked withExcel, you’re probably used to seeing all your work on one page, charts, data, andcalculations. In SPSS, each window handles a separate task. The output window iswhere you see your results.SPSS Step-by-Step7
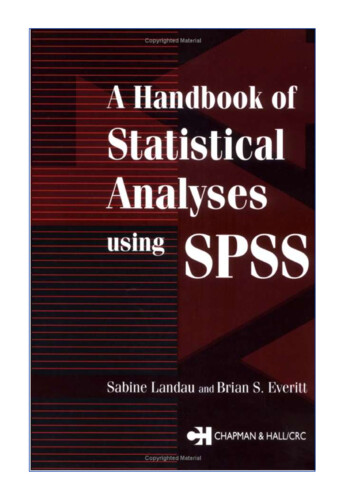
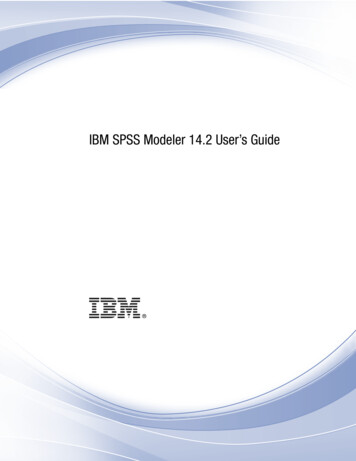
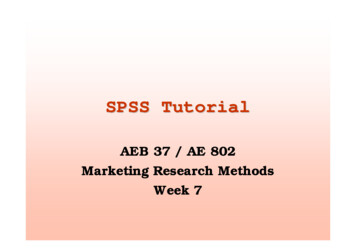
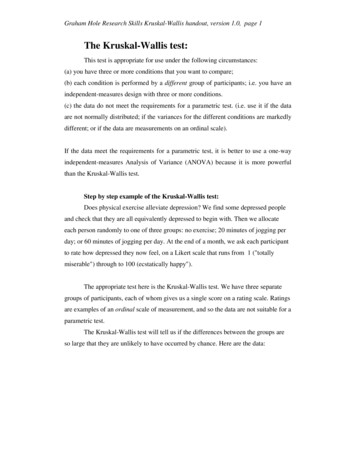
Introducing the interfaceTry it:1.From the menu, select Analyze Descriptive Statistics Crosstabs.2.Click once on Employment, then click the small right arrow next to Rows tomove the variable to the Rows pane (Figure 1).FIGURE 1.3.8Moving a variable to the Rows paneClick Gender, then click the small right arrow next to Columns to move theGender variable to the Columns pane. (Figure 2).SPSS Step-by-Step
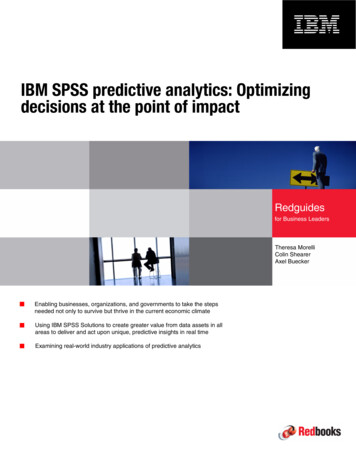
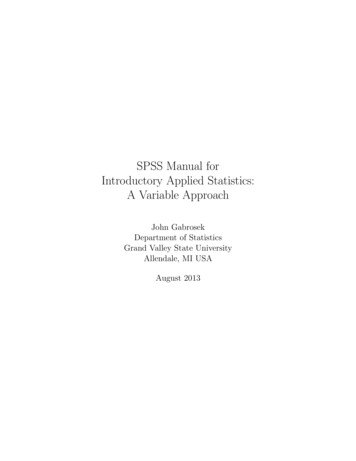
Introducing the interfaceFIGURE 2.4.Selecting a column variableClick Display clustered bar charts (Figure 3).FIGURE 3.Selecting clustered bar chartsclick here to displaythe clustered barchartsSPSS Step-by-Step9
Introducing the interface5.Click OK. SPSS brings the output window to the front displaying two tablesand the clustered bar chart you requested. Take a moment to review the contentsof the tables and the chart. Notice that the red arrow next to the title Crosstabscorresponds to the Crosstabs icon in the left pane of the window. The left panedisplays the contents of the right pane and is a convenient method of movingaround among the various output you’ll be generating.Note: In some cases, you may see asterisks instead of numbers in a table cell.Asterisks indicate that the current column is too narrow to display the complete number. Widen the column by dragging its margin to the right.The draft viewThe draft view is where you can look at output as it is generated for printing. Thedraft view does not contain the contents pane or some of the notations present in theoutput pane.Try it:1.From the menu, select File New Draft Output. SPSS opens a Draft Outputwindow that contains its own menu.2.From the menu, select Analyze Descriptive Statistics Crosstabs. Notice thatthe dialog box opens with your previous selections.3.Click OK. From here you can select charts or tables, copy them, and paste theminto other applications like spreadsheets or word processors.Note: If you want to maintain the correct spacing of the tables, use a non-proportional font like Courier New.The syntax viewSPSS has never lost its roots as a programming language. Although most of yourdaily work will be done using the graphical interface, from time to time you’ll wantto make sure that you can exactly reproduce the steps involved in arriving at certainconclusions. In other words, you’ll want to replicate your analysis. The best methodof preserving the exact steps of a particular analysis is the syntax view. In the syntax view, you’ll preserve the code used to generate any set of tables or charts.Syntax is basically the actual computer code that produces a specific output. Itlooks like this:10SPSS Step-by-Step
Introducing the interfaceCROSSTABS/TABLES jobcat BY gender/FORMAT AVALUE TABLES/CELLS COUNT/BARCHART .In the code shown above, SPSS is instructed to create crosstabs, using the variablejobcat, sorting the crosstabs by gender using a specific format, to put a count intoeach cell, and then to create a corresponding barchart.Note: Preserving the steps you take in arriving at a conclusion is especially important if you are writing for publication, peer review, or any other situation inwhich others might want to test your conclusions.In the next steps, you’ll create a simple chart and frequency distribution, save thesyntax and then recreate the chart and frequency distribution by running the savedsyntax.Try it:1.From the menu, select Analyze Descriptive Statistics Crosstabs. Notice thatyour previous selections are still present.2.This time, instead of clicking OK, click Paste.3.SPSS opens the Syntax Editor with the code you just pasted.When you select Paste instead of OK in dialog boxes like the Crosstabs box,the code generated by the function is pasted into the Syntax Editor. If youwanted, you could generate all your output from the syntax window alone. Generally, however, you will probably work with your data and output until they arejust the way you want them, then repeat the steps you took and paste the codeinto the syntax editor. You can then run the syntax at any time to recreate theoutput.4.If the cursor is not already located somewhere in the syntax, click anywhere inthe word CROSSTABS, then click the small right arrow on the toolbar or selectfrom the menu Run Current. SPSS opens the draft output window with thesame chart you created using the menu commands. This time, however, you created the output by running the syntax (code) you created with the Paste function. Notice that you can scroll up to the previous output you created using themenu commands.SPSS Step-by-Step11
What the heck is a crosstab?What the heck is a crosstab?A crosstab (short for cross tabulation) is a summary table, with the emphasis onsummary. Here’s an example:Employment Category * Gender 58Total3632784474Notice that the rows contain one set of categories (employment category) while thecolumns contain another (gender). In this crosstab, the cells contain counts, but inothers you can use percentages, means, standard deviations, and the like.Here’s the important part: crosstabs are used for only categorical (discrete) data,that is, groups like employment categories or gender. You can’t use a crosstab forcontinuous data like temperature or dosage or income. BUT, you can change datalike temperature or dosage or income into categories by creating groups, likeincome less than 25,000, income between 25000 and 49999, income 50000 orhigher. We’ll discuss these data conversions known as transformations or recodeslater. For now, you just need to understand that crosstabs deal with groups or categories.Now that you’ve seen the various windows you’ll be using, we’ll move on to thetechniques you’ll use in SPSS for managing your data files.12SPSS Step-by-Step
2Entering and modifying dataIn this section, you’ll learn how to define variables and create a data set fromscratch.Creating the data definitions: the variable viewIt’s impossible to talk about SPSS (or any analysis program) without talking aboutdata and types of data. So here goes. Each particular type of information (such asincome or gender or temperature or dosage) is called a variable. You can have various types of variables such as numeric variables (any number that you can use in acalculation), string variables (text or numbers that you can’t use in calculations),currency (numbers with two and only two decimal places) and variables with specific formats.Variable typesSPSS uses (and insists upon) what are called strongly typed variables. Stronglytyped means that you must define your variables according to the type of data theywill contain. You can use any of the following types, as defined by the SPSS Helpfile.SPSS Step-by-Step13
Creating the data definitions: the variable view Numeric. A variable whose values are numbers. Values are displayed in standard numeric format. The Data Editor accepts numeric values in standard format or in scientific notation. Comma. A numeric variable whose values are displayed with commas delimiting every three places, and with the period as a decimal delimiter. The Data Editor accepts numeric values for comma variables with or without commas; or inscientific notation. Dot. A numeric variable whose values are displayed with periods delimitingevery three places, and with the comma as a decimal delimiter. The Data Editoraccepts numeric values for dot variables with or without dots; or in scientificnotation. (Sometimes known as European notation.) Scientific notation. A numeric variable whose values are displayed with anembedded E and a signed power-of-ten exponent. The Data Editor acceptsnumeric values for such variables with or without an exponent. The exponentcan be preceded either by E or D with an optional sign, or by the sign alone--forexample, 123, 1.23E2, 1.23D2, 1.23E 2, and even 1.23 2. Date. A numeric variable whose values are displayed in one of several calendardate or clock-time formats. Select a format from the list. You can enter dateswith slashes, hyphens, periods, commas, or blank spaces as delimiters. The century range for 2-digit year values is determined by your Options settings (fromthe Edit menu, choose Options and click the Data tab). Custom currency. A numeric variable whose values are displayed in one of thecustom currency formats that you have defined in the Currency tab of theOptions dialog box. Defined custom currency characters cannot be used in dataentry but are displayed in the Data Editor. String. Values of a string variable are not numeric, and hence not used in calculations. They can contain any characters up to the defined length. Uppercase andlowercase letters are considered distinct. Also known as an alphanumeric variable.1Because SPSS uses strongly typed variables, you have to make sure that all the datain any field (variable) is consistent.1. SPSS Base System Version 11.5 Help.14SPSS Step-by-Step
Creating the data definitions: the variable viewVariable names and labelsForget all the nice conveniences you find in Windows and the Mac for handlinglong, interesting file names, or even the leniency that some database applicationsprovide in naming fields. In SPSS, variable names are eight characters, period. Andno funny characters like spaces or hyphens. Here are the rules: Names must begin with a letter.Names must not end with a period.Names must be no longer than eight characters.Names cannot contain blanks or special characters.Names must be unique.Names are not case sensitive. It doesn’t matter if you call your variable CLIENT, client, or CliENt. It’s all client to SPSS.Missing valuesIf you do not enter any data in a field, it will be considered as missing and SPSSwill enter a period for you.Non-numeric numbers, or when is a number not a number?Some numbers aren’t really numbers. That is, they’re numbers but you can’t usethem in mathematical calculations. Take a phone number, for example, or anaccount number or a zip code. You can sort them, but you can’t add or subtract ormultiply them. Well, you could, but the result would be meaningless. In essence,these numbers are actually just text which happens to be numeric. A good exampleis an address, which contains both numbers and text. We refer to these variables asstring or text variables.Binary variablesBinary variables are a special subgroup of numeric variables. Sometimes you treatthem as strings and sometimes you treat them as numeric. For example, yes/no,male/female, and 0/1 are all binary variables. That is, they have two and only twopossible values. Obviously, you can’t do a calculation on yes/no or male/female,BUT and this is a very big and very important BUT, you can recode these variablesinto numeric values, like assigning a value of 0 to female and 1 to male.SPSS Step-by-Step15
Creating a new data setRecoding binary variables is a critically important part of data analysis. Suppose,for example, that all you want to know is whether a specific event occurred. Forexample, suppose you want to know whether a client ever applied for welfare. As ithappens, the data set you’re using contains the date when each person applied forwelfare for the first time, if they ever did; if they didn’t the field is blank. Using thisdate, you can create a new variable called, say, welfapp that contains a 1 if there isany value in the first welfare application field and a 0 if there isn’t. Now you have asimple value (0 or 1) that you can use for further calculations or subsetting.Let’s get back to the male/female issue for a moment. Say you have recoded thevariable into a 0 for female and a 1 for male. If you calculate an average (mean) forthis variable, what you now have is a proportion. Say the average of your new variable is .45. You now know that there are somewhat more men than women in yourpopulation. In other words, you have calculated a proportion.Creating a new data setIf you’re doing original research or, in our case, creating databases for clients, therecomes a time when you have to create your own data file from scratch. In this task,you’ll create a new data set, define a set of variables, and then enter some data inthe variables. You’ll also create some automatic data entry constraints to improvethe accuracy of your data entry.In this task, you will create four types of variables: numeric, date, string, andbinary.1.From the menu, select File New Data. If you’re asked to save the contentsof the current file, click No.2.When the new file opens in the Data View, click the Variable View tab at thebottom of the window.3.With the cursor in the Name column on the first row (referring to the name ofthe variable) type:4.In the Type column, click the build button (“build button” is actually aMicrosoft term, but since SPSS’s documentation doesn’t give the button aname, we’ll use “build”) to open the Variable Type dialog box. (Figure 4)clientid16SPSS Step-by-Step
Creating a new data setFIGURE 4.5.Select (click) String. Notice that you can now define the length of the variable(Figure 5).FIGURE 5.6.Variable type dialog boxDefining the length of a string variableSelect all the text in the Characters field and type:147.Click OK. The dialog box closes and the variable is now set to a length of 14with no decimal places.8.Press tab or Enter three times to move to the label column.9.Type:Client IDThis is the label that will appear on all output and in dialog boxes like those youused in crosstabs and charts.SPSS Step-by-Step17
Creating a new data set10.Press tab or Enter three times to move to the “columns” column. “Columns”defines the width of the display of the variable, not its actual contents. The display width affects how the column will be displayed in output like crosstabs andpivot tables.11.Select all the text in the “columns” column and type:1412.Leave the remaining columns as they are, with left alignment and “nominal” asthe measure.13.On the next row, click in the name column and type:14.Press tab or Enter to move to the next column.15.Click the build button to open the Variable Type dialog box.16.Select String and click OK to accept the width.17.Click in the Label column for gender and type:genderGenderNotice that in the variable labels, you can use upper and lower case as well asspaces and punctuation.18.Press tab or Enter to move to the Values column.19.Click the build button in the Values column to open the Value Labels window(Figure 6).FIGURE 6.Value labels windowNote: Variable labels determine how the name of the variable is displayed in output. Value labels determine how each value is displayed. Thus, setting a18SPSS Step-by-Step
Creating a new data setlabel of “Female” for “f” in the gender variable instructs SPSS to display“Female” as a column heading for all cases with a value of f in gender.20.In the Value field, type:f21.In the Value Label field, type:Female22.Click Add.23.In the Value field, type:m24.In the Value Label field, type:Male25.Click Add.26.The Value Labels window should now look like Figure 7.FIGURE 7.Completed Value Labels window27.Click OK.28.On the next row, click in the Name column and type:employed29.Press tab or Enter or click in the Type field.30.Click the build button to open the Variable Type window.31.Employed is going to be a numeric, binary variable, so leave numeric selected,but change Width to 1 and Decimal Places to 0.SPSS Step-by-Step19
Creating a new data set32.Click OK.33.Tab to or click in the Label field and type:Employed year-end34.Press tab or Enter to move to the Values field and click the Build Button.35.In the Value field, type:36.In the Value Label field, type:1Yes37.Click Add.38.In the Value field, type:039.In the Value Label field, type:No40.Click Add.41.Click OK.42.On the next row, click in the Name field and type:nextelig43.Press tab or Enter or click in the Type field and click the build button to openthe Variable Type window.44.Select Date by clicking it.45.In the pane to the right, select the date format mm/dd/yyyy as in Figure 8.FIGURE 8.20Selecting a date formatSPSS Step-by-Step
Creating a new data set46.Click OK.47.Tab to or click in the Label field and type:Next eligibility date48.Tab to or click in the columns field and set the column with to 12.49.From the menu, select File Save As.50.Navigate to the A:\ drive and name the file TestData.sav.51.Click OK.52.Click the Data View tab. Notice that you now have four columns in whichyou’ll enter data for each record.53.On the first row, click in the clientid column and type:483920954.In the gender column, type:55.Press tab. Notice that when you leave the field, SPSS updates the field to thevalue label you assigned for f.56.In the Employed field, click the drop-down arrow and select Yes.57.In the nextelig field, type 4/1/2004.58.Use the following table to complete the data entry for this 20045938209fYes4/15/20049583902mYes6/1/2004You have now seen how you can define variables, assign labels to both variables and values, and define constraints that will control the type of data thatcan be entered. In future research, you’ll probably receive a file that has alreadybeen entered in another application such as Access, Excel, or some other application. If you’re doing your own data entry in SPSS, however, you should beaware of its data entry capabilities.SPSS Step-by-Step21
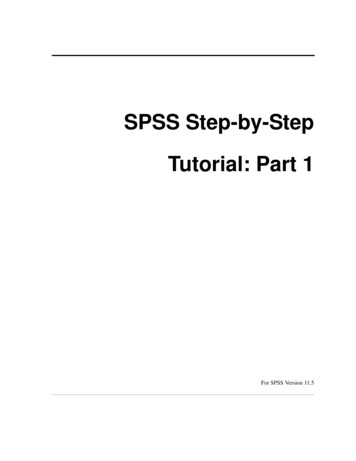
Getting help in creating data sets and defining variablesGetting help in creating data sets and definingvariablesNow that you have had some practice in creating a data set, let’s review the kind ofhelp SPSS provides to answer your questions.1.From the menu, select Help Topics.2.On the Index tab, click in the field named: Type in the keyword to find:3.Type:variable attri224.Double-click the highlighted text in the list (Variable attributes) to display thetopics found.5.SPSS opens the Topics Found window with Applying Variable DefinitionAttributes highlighted.6.Click Display.7.The Help window is updated to this topic (Figure 9).SPSS Step-by-Step
Getting help in creating data sets and defining variablesFIGURE 9.Help window for Applying Variable Definition Attributesclick one of the highlighted topics for more information8.Click the highlighted item Displaying or Defining Variable Attributes.9.When the window is updated, click Show Me. SPSS now opens the tutorialwindow that is included as part of the application. Any time you see Show Mein a help window, you can click it to see that specific section of the tutorial.10.Click the Next arrow a few times to see how the steps are illustrated.11.Close the Show Me window (the Internet Explorer window) to return to thestandard help window.12.Under Related Topics, click Value Labels. As you can see, you can follow thelinks in the help file, start a new search, or select any of the topics listed on theleft to move around in the SPSS Help system.13.Close the help window.14.From the menu, select File Open Data.15.Navigate to the Employee data.sav file on the floppy disk and open it.SPSS Step-by-Step23
Creating primary reference listsCreating primary reference listsThere is one set of outputs you’ll create that is more important than anything else,and that is the set of primary references. Primary references describe your overalldata set. In other words, how many in all? How many in each category? What arethe maximums and minimums? Means? Standard deviations? Here’s our rule: listout the summaries and put them somewhere where you refer to them quickly.You may not always want to print out all the details of your data set. For example,printing out every single income for a data set of one million people, would not beuseful, economical, or nice to either your printer or the trees. So here are the basicrules: print frequencies for categorical variables and descriptive (also calledunivariate) statistics for continuous variables.In this exercise, we’ll use the sample Employee dat.sav file.Frequencies1.If it’s not already open, open the Employee dat.sav file by selecting File Openand navigating to C:\SPSSTutorialData\Employee data.sav.2.From the menu, select File New Draft Output.3.From the menu, select Analyze Descriptive Statistics Frequencies.4.Double-click Gender, Employment Category, and Minority Classification tomove them to the Variables list.5.Click the check box labeled Display frequency tables.6.Click Statistics.7.Make sure all the check boxes are cleared (not checked).8.Click Continue.9.Click Charts.10.If it is not already selected, select None by clicking it.11.Click Continue.12.Click OK.13.From the menu, select File Save As.14.Navigate to C:\SPSSTutorialData\ and save the file as AllFreqs.When you’re working with your own file, follow these steps, then print the outputso you’ll have it handy.24SPSS Step-by-Step
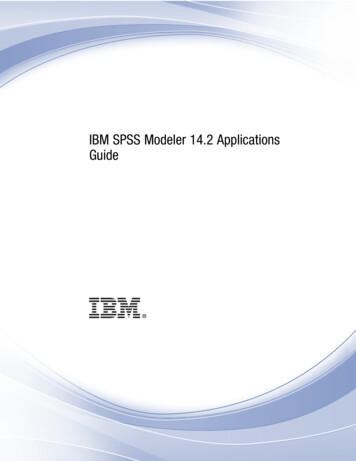
Creating primary reference listsDescriptive statistics: descriptives (univariate)The next step is to print the descriptive or univariate statistics for the continuousvariables.1.From the menu, select File New Draft Output.2.From the menu, select Analyze Descriptive Statistics Descriptives.3.Click Reset to clear any previous selections.4.Double-click Current Salary, Beginning Salary, Months since Hire, and Previous Experience to move them to the Variables list.5.Click Options.6.In the Descriptives: Options window, click Mean, Std. deviation, Variance,Range, Minimum, Maximum, Kurtosis, and Skewness (Figure 10).FIGURE 10.Selected measures for Options7.Click Continue.8.Click OK.9.When the resulting table is displayed, notice that the variables you selected arelisted as rows, while the statistics are listed in columns.10.From the menu, select File Save As.11.Navigate to C:\SPSSTutorialData\ and save the file as AllDescriptives.12.Notice that the statistic Range displays the distance between the minimum andmaximum.SPSS Step-by-Step25
Recodes and TransformationsWhen you are working with your own file, be sure to print this output and save itsomeplace handy (we use binders for, well, just about everything). These two printouts, frequencies and descriptives give you a picture of the overall shape of yourdata.Recodes and TransformationsSooner or later, no matter how carefully you planned your data design, you’ll probably want to work with some variables in different forms. If you collected incomeor age data, for example, you might want to group the continuous variables into categories. Or you might want to create a variable that combines various conditions,say, all minority managers by gender. This type of data manipulation is calledtransforming or recoding. In this exercise, you’ll create several new variables, somethat indicate multiple conditions and some that recode continuous variables intocategorical variables.Backup the original fileThe first step before making any changes to your data file is: BACK UP YOURDATA. And the easiest way to back up your data is to save it under another name.261.If you don’t have the data view open, select it from the menu by selecting Window Employee data.sav - SPSS Data Editor.2.From the menu, select File Save As, then navigate to C:\SPSSTutorialData\.3.Name the new file EmployeeData01 (Figure 11).SPSS Step-by-Step
Recodes and TransformationsFIGURE 11.Naming the new fileEnter new name4.Click Save. Notice that the title bar of your window now identifies the file asEmployeeData01.sav. Now you can begin your transformations.Recoding existing variablesRecoding refers to assigning codes (or different codes) to an existing variable.NEVER ever, ever, EVER recode your variables into the same variable name (withone exception). That way lies madness. And chaos. For one thing it deletes yourexisting data. And for another it destroys the history of the data. Always create anew variable to contain the new codes.Recode income data1.From the menu, select Transform Recode Into Different Variables to openthe Recode window (Figure 12).SPSS Step-by-Step27
Recodes and TransformationsFIGURE 12.2.Double-click Current Salary to move it to the Input Variable --
SPSS Step-by-Step 3 Table of Contents 1 SPSS Step-by-Step 5 Introduction 5 Installing the Data 6 Installing files from the Internet 6 Installing files from the diskette 6 Introducing the interface 6 The data view 7 The variable view 7 The output view 7 The draft view 10 The syntax view 10 What the heck is a cross