Transcription
150 Practice ECGs:Interpretation and ReviewThird EditionPart I: How to Interpret ECGsChapter 1: Baseline DataChapter 2: Morphologic Changes in P, QRS, ST, and TPart II: 150 Practice ECGsPart III: Interpretation and Comments
For Marilyn
150 Practice ECGs:Interpretation and ReviewThird EditionGeorge J. Taylor, MDProfessor of MedicineThe Medical University of South CarolinaThe Ralph H. Johnson VA Medical CenterCharleston, South Carolina, USA
2006 George J. TaylorPublishedBlackwellBlackwellBlackwellby Blackwell Publishing LtdPublishing, Inc., 350 Main Street, Malden, Massachusetts 02148-5020, USAPublishing Ltd, 9600 Garsington Road, Oxford OX4 2DQ, UKPublishing Asia Pty Ltd, 550 Swanston Street, Carlton, Victoria 3053, AustraliaThe right of the Author to be identified as the Author of this Work has been asserted inaccordance with the Copyright, Designs and Patents Act 1988.All rights reserved. No part of this publication may be reproduced, stored in a retrievalsystem, or transmitted, in any form or by any means, electronic, mechanical, photocopying,recording or otherwise, except as permitted by the UK Copyright, Designs and Patents Act1988, without the prior permission of the publisher.First published 1997Second edition 2002Third edition 2006Library of Congress Cataloging-in-Publication DataTaylor, George Jesse.150 practice ECGs : interpretation and review / George J. Taylor.—3rd ed.p. ; cm.Includes index.ISBN-13: 978-1-4051-0483-8 (pbk. : alk. paper)ISBN-10: 1-4051-0483-X (pbk. : alk. paper)1. Electrocardiography—Problems, exercises, etc. I. Title. II. Title: One hundred fiftypractice ECGs.[DNLM: 1. Electrocardiography—Examination Questions. WG 18.2T241z 2006]RC683.5.E5T34 2006616.1’207547—dc22 2005017378ISBN-13: 978-1-4051-0483-8ISBN-10: 1-4051-0483-XA catalogue record for this title is available from the British LibrarySet in 10 on 13 pt Meridien by SNP Best-set Typesetter Ltd., Hong KongPrinted and bound by Edwards Brothers Inc., USACommissioning Editor: Gina AlmondDevelopment Editor: Vicki DonaldProduction Controller: Kate CharmanFor further information on Blackwell Publishing, visit our website:www.blackwellcardiology.comNotice: The indications and dosages of all drugs in this book have been recommended inthe medical literature and conform to the practices of the general community. The medications described do not necessarily have specific approval by the Food and DrugAdministration for use in the diseases and dosages for which they are recommended. Thepackage insert for each drug should be consulted for use and dosage as approved by theFDA. Because standards for usage change, it is advisable to keep abreast of revised recommendations, particularly those concerning new drugs.The publisher’s policy is to use permanent paper from mills that operate a sustainable forestry policy, and which has been manufactured from pulp processed using acid-free and elementary chlorine-free practices. Furthermore, the publisher ensures that the text paper andcover board used have met acceptable environmental accreditation standards.
ContentsPreface, viIntraventricular ConductionAbnormalities, 38Right Bundle Branch Block, 38Incomplete Right Bundle BranchBlock, 41Left Bundle Branch Block, 41Left Anterior and Posterior FascicularBlock, 43Bifascicular Block, 43Ventricular Hypertrophy, QRS Amplitude,and R Wave Progression, 44Left Ventricular Hypertrophy, 45Right Ventricular Hypertrophy, 46Delayed, or Poor, R Wave Progression inPrecordial Leads, 47Low QRS Voltage, 48Patterns of Ischemia and Infarction, 49ST Segment Depression, 49T Wave Inversion, 53ST Segment Elevation, 55Q Waves and Evolution of MyocardialInfarction, 58PART I: How to Interpret ECGS, 1Normal Intervals, 1Chapter 1: Baseline Data, 3A Protocol for Reading ECGs, 3How to Use This Book, 3The ECG Is a Voltmeter, 4Measuring Heart Rate, 6Intervals, 7PR Interval, 7QRS Duration, 8T Wave and the QT Interval, 9Rhythm, 11Sinus Rhythm and Sinus Arrhythmia, 11Heart Block, 12Atrial Arrhythmias, 18Ventricular Arrhythmias, 28Electrical Axis, 33QRS Axis, 33T Wave Axis, 35PART II: 150 Practice ECGs, 63PART III: Interpretation andComments, 215Chapter 2: Morphologic Changesin P, QRS, ST, and T, 37Atrial (P Wave) Abnormalities, 37Left Atrial Abnormality, 37Right Atrial Abnormality, 38Index, 253Notes, 265
PrefaceYour problem as a student of electrocardiography is that you may not get enoughpractice to become good at it. The best way to get experience is to read ECGs from thehospital’s daily accumulation, commit your interpretation to paper, then look over theshoulder of the experienced person who is reading those ECGs for the record.Unfortunately, most students and residents do not have that opportunity. Trainingprograms are placing an ever-increasing clinical load on their faculties. One-on-oneteaching experiences are hard to program. It is the rare institution that provides most ofits students and residents headed for primary care practice with an adequate ECGreading experience.This book is intended as an ECG curriculum that emphasizes practice. My goal is tohave you reading ECGs as quickly as possible. The introductory chapters are shorterthan those found in the usual beginner’s manual, but there is plenty there to get youstarted. Where you want additional depth, refer to an encyclopedic text in the library.The practice ECGs include clinical data and questions that are designed to maketeaching points. My brief discussion emphasizes daily issues in clinical medicine, aswell as material that you may encounter on Board exams (Internal Medicine, FamilyPractice, Flex, and National Boards). Spend five evenings with these practice ECGs, andyou will be far more comfortable than the average house officer with this basic part ofthe clinical examination.Credit for the high quality of ECG reproduction in this book goes to Gordon Grindyand his colleagues at Marquette Electronics, Inc. My partner, Wes Moses, proofread thetext and ECG interpretations, and I am also grateful to Dr. Hans Traberg who madeuseful suggestions for the 3rd edition. I again acknowledge that Marilyn Taylor is apatient woman, and I appreciate her forbearance during this writing adventure. G.J.T.vi
PART IHow to Interpret ECGsNormal IntervalsHeart Rate 60–99 beats/minbradycardia 60 beats/mintachycardia 100 beats/minPR 0.12–0.21 secPR prolongation 0.22 secQRS 0.12QRS axis -30 to 105 QTc the corrected QT interval (calculated as QT RR interval).It varies with age and gender, but is roughly 0.45 sec.
PART IHow to Interpret ECGsNormal IntervalsHeart Rate 60–99 beats/minbradycardia 60 beats/mintachycardia 100 beats/minPR 0.12–0.21 secPR prolongation 0.22 secQRS 0.12QRS axis -30 to 105 QTc the corrected QT interval (calculated as QT RR interval).It varies with age and gender, but is roughly 0.45 sec.
CHAPTER 1Baseline DataA Protocol for Reading ECGsThe protocol that you should follow when reading ECGs is outlined in Table 1.1. It isthe approach cardiologists have taught generations of students, and it works. Afterreading ECGs for decades—and for a living—I still use it. With experience, I am goodat pattern recognition. I glance at an ECG and promptly recognize major abnormalities.As you gain experience, you will develop this ability, and you will be tempted to focusimmediately on the gross abnormalities that seem to jump out of the page. Resist thattemptation! Do what the pros do, and make yourself follow the steps outlined in Table1.1. Regardless of your ability and experience, if you do not focus on the rate, rhythm,intervals, and axis, you will miss subtle and important abnormalities. This is one ofthose areas of clinical medicine where you should not cut corners. Not addressingintervals, for example, would be like omitting the family history from a history andphysical exam.That analogy is a good one. The beauty of the history and physical examinationformat is that it allows you to collect meaningful data, even when the patient has anillness that you do not understand. Collecting basic data from the ECG serves a similarpurpose for the novice.How to Use This BookFirst, read the introductory chapters that explain ECG findings and provide diagnosticcriteria. Although useful, this exercise will not teach you how to read ECGs. You willtake that step when you work through the practice tracings in Part II of this book.When reading the unknown ECGs in Part II, write your interpretation. First, recordrate, rhythm, intervals, and QRS axis. Then, analyze QRS and ST-T wave morphologies, and record your impression beginning with “ECG abnormal due to. . . .” If you donot commit yourself on paper, it does not count! Finally, check your interpretation withmine, which is in Part III. Read five to ten tracings, or more, before checkinganswers. You will get into a kind of rhythm when you read ECGs withoutinterruption.
150 Practice ECGs: Interpretation and ReviewTable 1.1 ECG Reading ProtocolThe basicsRateRhythmIntervalsQRS axisMorphologic changes, interpretationConduction abnormalityAtrial abnormalityVentricular hypertrophyST segment—T wave changesPatterns of ischemia and infarctionBasic clinical data are provided with the ECGs, and I ask questions about management and diagnosis that go beyond the formal ECG report. Reading ECGs is a greatopportunity to think (and teach) about heart disease, and I will not miss that opportunity here.The remainder of this and the next chapter deal with each item on the ECG readingprotocol (see Table 1.1). This book is for the near-beginner; most of you have hadsome introduction to the ECG. I will avoid lengthy description of technical areas suchas the origin of lead systems. My goal is to provide brief yet clear explanations, and toget you through the introductory material as quickly as possible. Then it’s on to thepractice ECGs.The ECG is a VoltmeterIt measures the small amount of voltage generated by depolarization of heart muscle.The vertical, or y axis, on the ECG is voltage, with each millimeter (mm) of paper equalto 0.1 millivolt (mV) (Fig 1.1). For practical purposes, we often refer to the amplitude,or height, of an ECG complex in millimeters of paper rather than in millivolts. At thebeginning or end of the ECG, you may see a square wave, machine induced, that is10 mm tall; this is a 1-mV current entered by the machine for calibration. The gain canbe changed so that high-voltage complexes fit on the paper, or so that low-voltagecomplexes are magnified. Changing the gain is uncommon, but it would be apparentfrom the calibration marker.Voltage may have either a negative or a positive value. This is because voltage is avector force with direction as well as amplitude. All the rules of vector analysis apply.Note that the wave of depolarization moves through the heart in three dimensions,but that each ECG lead records it in just one dimension, between two poles. Having 12leads grouped in frontal and horizontal planes allows us to reconstruct electrical events inthree dimensions (Fig 1.2). The vectorcardiogram, popular 40 years ago and seldom usednow, displayed the wave of depolarization in three dimensions, using x, y, and z axes.On the ECG, when the wave of depolarization moves toward the positive pole of anindividual lead the deflection is upright, or positive. For example, if depolarization progresses from the right side of the heart to the left, the net voltage is positive in lead I(Fig 1.2). Downward deflections are negative. The general direction of the wave ofdepolarization, the orientation of its vector in space, is referred to as the electrical axis.Depolarization of the atria progresses from the upper right toward the lower left, so the
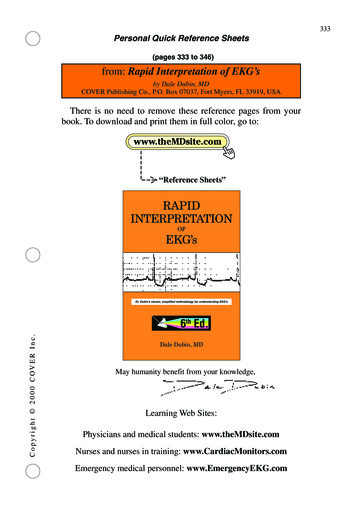
chapter 1:Baseline Data FIGURE 1.1 The square wave at the beginning is a 1-mV calibration marker. At full standard, 10 mm ofpaper 1 mV of current. The ECG paper runs at 25 mm/sec. Thus, each millimeter 0.04 second, andeach large square (5 mm) 0.2 second. The time between two positive deflections, or R waves, is the RRinterval. If that is 1 second, the heart rate is 60 beats/min. This patient’s heart rate is 100 beats/min (60seconds per minute 0.6 second per beat).FIGURE 1.2 Spatial orientation of the 12 ECG leads. Each of the ECG leads functions as a voltmeter andhas spatial orientation (as voltage is a vector force). Leads that have an inferior orientation are best atdetecting changes from the inferior surface of the heart. Anterior precordial leads are most sensitive indetecting anterior wall changes, and the lateral leads, lateral wall abnormalities.
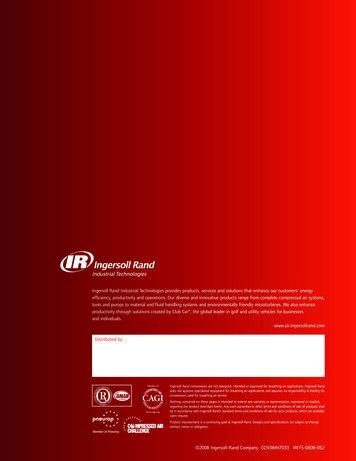
150 Practice ECGs: Interpretation and ReviewFIGURE 1.3 Sequence of cardiac activation. The sinoatrial (SA) node, located in the high right atrium, isthe cardiac pacemaker. It fires at a rate of 60 to 100 beats/min, and the rate is influenced by both sympathetic and parasympathetic tone. Atrial muscle depolarization produces enough current to cause a deflection on the surface ECG, the P wave. The wave of depolarization is funneled into the atrioventricular (AV)node, located near the junction of the atrial and ventricular septa. Current is delayed in the AV node, producing the PR interval. This delay allows time for atrial contraction (which completes ventricular filling).Current exits the AV node into the bundle of His, which then divides into the left and right bundlebranches. Initial depolarization of the interventricular septum takes place from the left to the right side.Current then moves simultaneously through the left and right bundle branches into the ventricular myocardium, producing the QRS complex. The left ventricle (LV) is much thicker than the right and thus generatesmore voltage. LV depolarization dominates the QRS complex. The ventricles are then repolarized, producingthe T wave on the ECG. Normally, no voltage is apparent between the end of the QRS and the T wave. ThisST segment may shift up or down with myocardial ischemia.normal P wave axis is about 60 . Measurement of the QRS axis is discussed at the endof this chapter.The ECG records the voltage generated by depolarization of the different regions ofthe heart through time. Following discharge of the sinoatrial (SA) node, the atria aredepolarized (the P wave, Fig 1.3). Current then passes through the atrioventricular(AV) node, where there is delay (the PR interval). When the wave of depolarization exitsthe AV node, it passes through the His bundle, then the bundle branches, and on tothe ventricles. Discharge of the muscular ventricles produces the QRS complex. This isfollowed by repolarization of the ventricles (T wave).Measuring Heart RateOn older ECG machines, the paper moved at an arbitrarily set speed of 25 mm/sec. Oncurrent machines the paper is stationary and the stylus moves at 25 mm/sec, yet wecustomarily refer to “paper speed.” At this speed, each millimeter of ECG paper is equalto 1/25, or 0.04 second (see Fig 1.1). ECG paper is boldly ruled at 5-mm, or 0.2second, intervals. And 5 of these large (5-mm) squares equals 1 second—straightforward arithmetic. Using this, there are a couple of fast ways to calculate heart ratewhen the rhythm is regular.
chapter 1:Baseline Data 1.Check the distance (that is to say, the time) between two R waves. (The R wave isthe dominant and easily identified positive (upright) wave or deflection in the QRScomplex [see Fig 1.1].) That is the time for one cardiac cycle, or one heartbeat, andit is called the RR interval. If the RR interval is 5 large squares, or 1 second, thenone heartbeat takes 1 second, and the rate is 60 beats/min. If the RR interval is 4squares, or 0.8 sec/beat, then the heart rate is 60 sec/min divided by 0.8 sec/beat,which equals 75 beats/min. Three squares: 60 0.6 100 beats/min.2.A simpler way to do the arithmetic, and the way I determine rate quickly, is tomeasure the number of large squares between R waves, then divide that into 300:for 2 large squares, rate 150 beats/min; 3 squares, rate 100 beats/min;4 squares, rate 75/min; 5 squares, rate 60/min; 6 squares, rate 50/min;5.5 squares, rate between 50 and 60/min. When the rhythm is regular, I selectan easily identifiable R wave that falls on, or near, a boldly scored line, then countthe number of large squares to the next R wave. It is a crude but fast way tomeasure rate, but it does not work when the rhythm is grossly irregular. In mostcases, it allows you to determine quickly whether the patient has a normal rate,bradycardia (less than 60 beats/min), or tachycardia (more than 100 beats/min).IntervalsAfter emphasizing the importance of following the reading protocol (see Table 1.1), Iam already violating it by considering intervals before rhythm. This is useful, however,because the intervals are at times necessary to determine rhythm. First, let us reviewevents of the normal cardiac cycle and the basic ECG nomenclature.Depolarization of the SA node normally initiates the cardiac cycle (see Fig 1.3). Thisneural structure is small, and its depolarization generates a small amount of currentthat cannot be seen on the surface ECG (e.g., the 12-lead ECG measured from thesurface of the body). The wave of depolarization spreads through both left and rightatria, producing the P wave (see Fig 1.3).Although the atria and ventricles have a broad area of surface contact, they areeffectively insulated from each other by connective tissue. The wave of depolarizationfrom the atrium is funneled through what I think of as a hole in the insulation, but itis actually specialized conducting tissue called the atrioventricular (AV) node. Currentmoves rapidly along nerves and fairly quickly through heart muscle. But the AV nodeputs the brakes on the wave of depolarization. This slowing creates a delay betweenatrial depolarization and ventricular depolarization. A pause in the AV node gives theatria time to contract, providing the final increment of ventricular filling. According toDr. Starling, that is important; he discovered that greater ventricular volume—or individual muscle fiber length—at the beginning of ventricular contraction produces stronger contraction.PR IntervalThe interval that includes a measure of the AV node conduction delay is the PR interval (see Fig 1.3). It is often easier to identify the beginning of the P wave than its end,
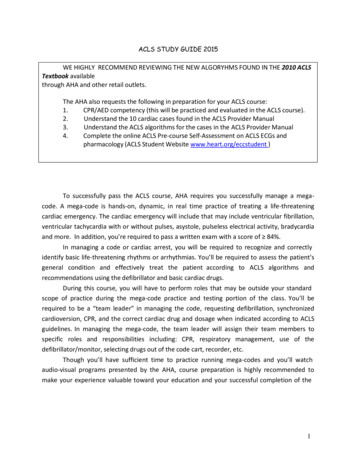
150 Practice ECGs: Interpretation and Reviewand by convention, this interval is measured from the start of the P wave. The intervalthus includes the time of atrial depolarization, the P wave itself, and the delay duringAV node conduction (roughly the time from the end of the P wave until the beginningof the QRS complex). However, when the PR interval is prolonged, it is usually a resultof delayed AV node conduction; I know of no condition that lengthens the P waveenough to cause prolongation of the PR interval.A common question is which ECG lead to use for measuring the PR or other intervals.What you are trying to measure with the PR interval is the time from initiation ofatrial depolarization until the beginning of ventricular depolarization. There are slightvariations in the sensitivities of particular ECG leads for recording the onset of the Pwave, and which lead is most sensitive will vary from patient to patient. It makes senseto use the lead that records atrial depolarization earliest and ventricular depolarizationearliest.Do you get the feeling that these are rough measurements, despite the fact that weare dealing with milliseconds and microvolts? The truth is that they are, and that thesurface ECG is a crude tool. As a practical matter, measure intervals from a lead wherethe onset of the waves—P and QRS—is well defined, and where the interval seemslongest. This general rule applies to the measurement of all intervals.The normal PR interval ranges from 0.12 to 0.22 second (see page 1). First-degreeatrioventricular block (1 AV block) is defined as a PR interval of 0.22 second or more.QRS DurationVentricular depolarization produces the QRS complex, the largest deflection on theECG (Fig. 1.4, and see Fig 1.3). As a rule, the voltage generated is proportional to theamount of muscle depolarized, and the ventricles contain the bulk of cardiac muscle.FIGURE 1.4 QRS nomenclature. Any positive deflection is an R wave. An initial negative deflection is a Qwave. A negative deflection following an R wave is an S wave. Small, low-voltage deflections may be designated with lowercase letters. When there are two R waves separated by an S wave, the second may bereferred to as R’ (R prime).
chapter 1:Baseline Data QRS nomenclature may seem confusing at first, but it follows quite simple conventions(Fig 1.4).The QRS duration, or interval, is a measure of the time it takes to depolarize the twoventricles. Look again at Figure 1.3. Current exits the AV node and the His bundle andmoves simultaneously through the infranodal bundle branches. Normally, the ventriclesare activated at the same time, and the time of ventricular depolarization is roughly theduration of the QRS.On the surface ECG, measure the QRS duration where it seems longest and wherethe beginning and end of the QRS are obvious. The normal duration is less than 0.12second (3 mm). There are no illnesses that cause pathologic shortening of the QRScomplex.T Wave and the QT IntervalRepolarization, or the return of muscle to its resting state, spontaneously follows depolarization in heart muscle. Repolarization of the thin-walled atrium produces no apparent deflection on the surface ECG. Repolarization of the ventricles produces the T wave.This usually has the same axis as the QRS complex; that is to say, in ECG leads wherethe QRS complex is positive, the T wave is positive as well.The QT interval is measured from the beginning of the QRS complex to the end ofthe T wave (see Fig 1.3). Why measure from the beginning of the QRS, apart fromconvention? It is probably because the beginning of the QRS often is easier to identifythan the end, and the QRS complex is short relative to the duration of the QT interval.Measure the QT interval using the lead where it seems longest.The normal duration of the QT interval varies with heart rate. The corrected QT(QTc) is calculated using Dr. Bazett’s formula:QTc QT RR intervalThe RR interval, or the duration of one cardiac cycle, is a measure of heart rate.Therefore, when the heart rate is 60 beats/min, and the RR interval is 1 second, theQTc equals the measured QT. When the heart rate is greater than 60 beats/min and theRR interval is less than 1 second, the QTc will be greater than the measured QT. MostECG manuals provide tables that give the top-normal QT (measured) for a given heartrate, and these tables are based on Bazett’s formula with a top normal QTc that isroughly 0.45 sec. The normal range varies with age and gender.There is a quick and easy method for determining whether the QT interval isnormal, and it is the method I use when plowing through a stack of ECGs. If the measured QT is less than half the RR interval, then it is probably normal. If it is clearlylonger, then it is probably abnormal. Using this shortcut, my ECG interpretationusually reads “QT normal for the rate” or “QT prolonged for the rate.” In borderlinesituations I calculate the QTc. The QTc provided by the ECG computer is occasionallyinaccurate. Particularly with rapid heart rates, there is a tendency to overdiagnose QTprolongation, even with careful measurement.The T wave may contain a second hump, or even a separate wave, which is called
10150 Practice ECGs: Interpretation and Reviewthe U wave, and this is a part of the ventricular repolarization process. It may be anormal finding. There is general agreement that it should be considered a part of the Twave when thinking of QT, or QTU, prolongation. Hypokalemia, especially in combination with hypomagnesemia, causes an increase in U wave amplitude and prolongationof the QTU interval.QT interval prolongation is important. You will miss it unless you look for it onevery ECG you read. One place you will see it is on Board exams. Conditions anddrugs that prolong the QT interval are summarized in Table 1.2.Table 1.2 Conditions and Drugs Affecting ECG IntervalsInterval ConditionPR1 AV blockQRSQT/QTUVentricular conduction abnormalities,including bundle branch block;pre-excitationMyocardial ischemia, hypothermia,intracranial bleeding, long QTsyndromeDrugs/metabolic abnormalityDigoxin, b-adrenergic blockers, calciumchannel blockers, intravenous adenosineQuinidine, flecainide, propafenone andother antiarrhythmics; extremehyperkalemiaQuinidine, procainamide, disopyramide, sotalol,amiodarone, phenothiazine and phenothiazinederivatives, erythromycin; hypokalemia,hypomagnesemia, hypocalcemiaPATHOPHYSIOLOGYRecall the shape of the action potential of isolated nerve or muscle cells.Repolarization (the return of the cell membrane to resting potential after depolarization) is a brief event, a sharp downward deflection. However, the repolarization wave on the surface ECG is broad. That is because the T wave is generatedby repolarization of the large population of cardiac cells, some of which repolarizeearly and others much later. Doesn’t the T wave look like a bell-shaped curve?In a sense it is, with the average cell repolarizing at the peak of the T wave. Abroader T wave indicates greater heterogeneity of the repolarization processamong cardiac muscle cells so that it takes longer (electrophysiologists call thistemporal dispersion of refractoriness).This is clinically important because increased heterogeneity of repolarizationis the substrate for reentry, which is the mechanism of most ventricular tachyarrhythmias. A long QT interval (a measure of the duration of repolarization) mayidentify the patient at risk for ventricular arrhythmias and sudden death (Table1.2).The QT prolongation of hypocalcemia is an exception, with somewhat lessrisk. That is probably because the heterogeneity of ventricular repolarization isless affected. This is the only cause of QT prolongation where the duration of theT wave is not prolonged—a normal T wave just occurs later.
chapter 1:Baseline Data11RhythmMy purpose is to help the student read through a stack of ECGs in the heart station(and look good to the attending). I will review selected rhythms common in this setting,but I will not attempt a comprehensive discussion of the rhythm abnormalities thatyou will encounter in telemetry units.Sinus Rhythm and Sinus ArrhythmiaNormal sinus rhythm is a regular rhythm between 60 and 100 beats/min, with a Pwave before each QRS complex and a QRS after each P wave. A faster rate definestachycardia and a slower rate, bradycardia. The term sinus indicates that the rhythm originates in the sinoatrial (SA) node, that there is atrial depolarization (a P wave beforeeach QRS), and that atrial contraction precedes ventricular contraction.CLINICAL INSIGHTWhen you are excited, or when you walk up stairs and are short winded and yourpulse is 120 beats/min, you have sinus tachycardia. This usually is a benign rhythm,but not always. It is a normal response of healthy people to exercise. But sinustachycardia in a patient who is at rest and pain free the day after an MI may indicate severe left ventricular dysfunction. Cardiac output stroke volume heartrate. A depressed left ventricle generates less stroke volume, and increasing therate is the first compensatory response to maintain output. Although a heart rate 90 beats/minute does not require specific treatment, it is a marker of decom pensation and poor prognosis in patients who have had an MI and in those withcongestive heart failure. Do not overlook other illnesses that may cause sinustachycardia, such as thyrotoxicosis, anemia, and fever. It may also be caused bydrugs, such as thyroid hormone, catecholamines, caffeine, and amphetamines.Sinus bradycardia is a common finding. In the absence of conduction abnormalities, when all the intervals are normal, bradycardia at rest is a normal variant. It usually indicates good cardiovascular fitness, and it is common in trainedathletes. It can be a drug effect (digitalis, b-adrenergic blockers, or the calciumchannel blockers diltiazem and verapamil). A variety of illnesses can cause sinusslowing, including the sick sinus syndrome, hypothyroidism, sleep apnea, andother conditions that cause hypoxemia. Vasovagal attacks may include profoundsinus bradycardia, sinus pauses, and syncope.Sinus ArrhythmiaDuring the respiratory cycle, the vagus nerve is intermittently activated, producing abeat-to-beat variation in heart rate. On the 12-lead ECG (which is a relatively shortrhythm strip), this is seen as a variable RR interval. When pronounced, it may affectyour quick and easy calculation of heart rate using the technique just described. Beaware of this, but do not worry as long as the rate is within the normal limits.Sinus arrhythmia usually indicates good cardiovascular health. It disappears whenthe heart is sick, as in the case of heart failure. The autonomic nervous system
12150 Practice ECGs: Interpretation and ReviewCLINICAL INSIGHTIn addition to heart disease, autonomic dysfunction may also reduce heart rate variability, but with no increased risk of ventricular arrhythmias. This generallyoccurs in illnesses that cause peripheral (sensory) neuropathy, including alcoholism, diabetes, uremia, and Guillain-Barré syndrome. Dysfunction of medullarycenters that control autonomic function may also reduce heart rate variability,such as cerebral hypoxia. It is a minor criterion for determining brain death.compensates for low cardiac output by suppressing the parasympathetic nervoussystem as well as increasing sympathetic tone. Resting heart rate increases. In addition,the vagus nerve is not activated during the respiratory cycle, so there is little if anyvariation in RR intervals. The rhythm becomes perceptibly more regular.Precise quantification of sinus arrhyth
ment and diagnosis that go beyond the formal ECG report. Reading ECGs is a great opportunity to think (and teach) about heart disease, and I will not miss that opportu-nity here. The remainder of this and the next chapter deal with each item on the ECG reading protocol (see Table 1.1). This boo