Transcription
March 2021ResearchInstituteCredit Suisse Global Investment ReturnsYearbook 2021 Summary EditionElroy Dimson, Paul Marsh, Mike StauntonThought leadership from Credit Suisse and the world’s foremost experts
Summary EditionExtract from the Credit Suisse Global InvestmentReturns Yearbook 2021Important informationThis report is a summary version of the full244-page Credit Suisse Global InvestmentReturns Yearbook 2021, which is availablein hardcopy upon request.Coverage of Summary EditionThis report contains extracts from the full hardcopy Credit Suisse Global Investment ReturnsYearbook. In the Yearbook, renowned financialhistorians Professor Elroy Dimson, Professor PaulMarsh and Dr. Mike Staunton assess the returnsand risks from investing in equities, bonds, cash,currencies and factors in 23 countries and in fivedifferent composite indexes since 1900. Thisyear, the database is broadened to include 90developed markets and emerging markets, andthe Yearbook presents an in-depth analysis ofnine new markets.This Summary Edition provides excerpts fromthe printed Yearbook and spotlights Chapter 8of the book. The summary starts with a historicalperspective on the evolution of equity and sovereign debt markets over the last 121 years, andthe industrial transformation that accompaniedthis. The next section explains why a long-termperspective is important and summarizes the longrun returns on stocks, bonds, bills and inflationsince 1900. This is followed by a discussion oncurrencies and their impact on investment returns.The section on investment risk looks at dispersionin stock and bond markets – on both the upsideand downside – culminating with global evidenceon the historical risk premium.2The Summary Edition then moves to prospectivereturns, showing how returns vary with real interestrates, looking at how expected returns vary overtime and across markets, reflecting interest andinflation rates. In a discussion of factor investing,there is an overview of the historical rewards fromsize, value, income, momentum, volatility andother factors. Chapter 8 of the printed Yearbookexamines emerging markets in detail and thischapter is reproduced in this Summary Edition.Topics include the nature, importance, evolutionand profitability of emerging market investing, andstudies of factor investing and rotation strategieswithin the developing world.The hardcopy publication provides an in-depthhistorical analysis of the investment performanceof the 32 Yearbook countries and five compositeindexes, providing data sources and references.This Summary Edition includes an overview of theinvestment performance of some of the world’smost important markets since 1900, includingAustralia, China, Switzerland, the United Kingdomand the United States. It also includes analysisof three of the Yearbook’s composite indexes(developed markets, emerging markets and theWorld) and a list of references.Details on how to access the full Credit SuisseGlobal Investment Returns Yearbook or theunderlying DMS dataset are provided on page 70.
Cover photo: Kuala Lumpur, Malaysia; Getty Images, Piero Damiani; photo right: Kuala Lumpur, Malaysia; Getty Images, Alexander Spatari02Important information04Message from the Chairman05Introduction and historical perspective12Long-run asset returns18Currencies21Investment risk26The low-return world29Factor premiums32Emerging markets52Individual ited KingdomUnited StatesDeveloped marketsEmerging l disclaimer / important informationExtracted from:Credit Suisse Global Investment ReturnsYearbook 2021:Elroy Dimson, Paul Marsh, Mike Stauntonemails: edimson@london.edu, pmarsh@london.edu,and mstaunton@london.eduISBN for full Yearbook 978-3-033-08425-4For more information, contact:Richard Kersley, Head of Global Research Product,Credit Suisse Securities Researchrichard.kersley@credit-suisse.com orNannette Hechler-Fayd’herbeCIO International Wealth Management andGlobal Head of Economics & Research, Credit comSee page 70 for copyright and acknowledgementinstructions, guidance on how to gain access to theunderlying data, and for more extensive contact details.Credit Suisse Global Investment Returns Yearbook Summary Edition 20213
Message from the ChairmanWe are delighted to publish the 13th edition of theCredit Suisse Global Investment Returns Yearbookproduced in collaboration with Professor ElroyDimson of Cambridge University, and ProfessorPaul Marsh and Dr. Mike Staunton of LondonBusiness School. The long-term perspective thisunique annual study provides has rarely seemedmore valuable after a truly remarkable year infinancial markets, with the COVID-19 pandemicand the economic and scientific responses to itthe defining influences.By way of new thematic content, the 2021edition of the Yearbook brings to the table ahighly topical deep-dive into emerging markets,reflecting the ever greater importance to globalmarkets they reflect. Only 20 years ago, emerging markets made up less than 3% of worldequity market capitalization and 24% of grossdomestic product. Today, they comprise 14%of the free-float investable universe and 43% ofgross domestic product, with their influence onlylikely to grow further.We have seen equities plumb the depths of asevere bear market, with US equities falling bymore than a third at their lows last March, but tothen recover almost as swiftly as they fell and setnew all-time highs – all within the same calendaryear. While no perfect parallel for prevailing eventsexists, the Yearbook, bringing a historical perspective that stretches across 32 countries and up to121 years, provides extensive examples to learnfrom as to the impact on markets from crisesand economic policy, and technology responsesto them. As is often said, “history may not repeatitself, but it rhymes.” This is the essence of theYearbook.To help investors frame assumptions for futurereturns and valuation, the study presents asubstantial extension of the Dimson, Marsh andStaunton dataset. Nine new emerging marketshave been added providing for each at least 50years of performance of equities, bonds, bills,currencies and inflation. The markets includeseven from Asia – India, Hong Kong SAR, SouthKorea, Singapore, Taiwan (Chinese Taipei),Malaysia, and Thailand – and two from LatinAmerica – Brazil and Mexico. We also carryhistorical data on a further 58 countries, if lesscomprehensive in nature and longevity.A legacy of this crisis is record-low real interestrates and now-burgeoning fiscal deficits asgovernments have sought to soften the blowof the pandemic. Pulling this combination ofpolicy levers has of course been to the benefitof financial assets. However, the policy dilemmaof if, and how, to unwind these crisis measureslooms large, particularly with inflation expectations hardening. The Yearbook underlines theconstraints for returns that a base line of low realrates poses if rates have indeed bottomed. Thehistorical precedent would be for more modestreal equity returns in their wake, but perhapseven greater challenges for bonds after their“equity-like” returns.4Are emerging market equities a route to outperform in a low-return world? The authors seea superior prospective equity risk premium onoffer compared to that in developed markets.However, an irony arguably emerges. In marketsoften perceived as “growth” opportunities, factorinvesting and rotation strategies reveal “value”is the factor to unlock the superior performancethat investors may be seeking.We hope you enjoy this year's Yearbook and findits insights instructive as we all look to navigatean investment world beyond the pandemic.Urs RohnerChairman of the Board of DirectorsCredit Suisse Group AG
Introduction and historicalperspectiveYears seldom match their start-year expectations. In 2020, this wastrue on an epic scale. The year started with guarded optimism, butended defined by the COVID-19 pandemic. The pandemic had globalreach, extending to every continent, even Antarctica. It took its placein history for the lives lost and the extraordinary measures taken tomitigate the spread of the virus. Households everywhere felt its impact– lockdowns, damage to livelihoods, joblessness, illness, death andfear. Many companies were hard hit, with shutdowns or severerestrictions on businesses involving human contact and social mixing.It was an extraordinary year for investors. Itstarted well for equities and bonds, with manymarkets hitting all-time highs in February. Then,within a month, equity markets plummeted,typically by a third or more, while bonds gainedin the flight to safety. Market volatility hit extreme levels, higher even than in the globalfinancial crisis.Markets then rallied strongly, fueled by massivemonetary and fiscal stimulus. In the fourth quarter,the market started looking through the increasein COVID-19 cases to the eventual full reopeningof the global economy on news of two viablevaccines. From its March low until the year-end,the all-important US market rose by 77%.By end-2020, US equities were up 21% onthe year, while bonds returned 17%. TheYearbook’s world equity and bond indexesrecorded returns of 17% and 12%. Equityvolatility had fallen back almost to its long-runaverage. The year 2020 was indeed a year ofsurprises.The purpose of the YearbookFor many, 2020 was a year to forget. One result,however, is that it has caused investors to reachfor their history books to see what they couldlearn from the past.The Yearbook documents and analyzes globalinvestment returns over the last 121 years since1900. Its aim is to use financial history to shedlight on the issues facing investors today. AsWinston Churchill said, “The longer you can lookback, the farther you can look forward.”The lengthy period spanned by the Yearbooksaw two world wars, civil wars, revolutions, crises,slumps, bear markets, the Great Depression andpandemics. It also saw times of recovery, growthand booms; extended periods of peace, prosperityand technological advance.Using the past to illuminate the present needscareful analysis. It is not simply a matter, forexample, of checking the market’s reaction topast pandemics and extrapolating. Not least, thisis because even with 121 years of history, wehave experienced only one pandemic as severeas COVID-19, namely the Spanish ‘flu of1918–19.The two pandemics have had much in common.The world and medical science were unprepared.Disease control initially had to rely on hygiene,social distancing and face coverings, quarantines,lockdowns and partial closure of the economy.The Spanish ‘flu came in three waves, the secondbeing the worst. Sadly, this lesson was largelyforgotten after the first wave of COVID-19.Credit Suisse Global Investment Returns Yearbook Summary Edition 20215
Despite these similarities, equity markets weresurprisingly resilient during the Spanish ‘flu, withthe US market rising by 7% over this period.An obfuscating factor was that the Spanish ‘flucoincided with good news about the end ofWorld War I. It is thus hard to learn much aboutmarket reactions to pandemics. That said, thestock market’s measured reaction was still ofinterest, despite contamination from other events.The Spanish ‘flu was also a reminder of humanresilience, and that “this, too, shall pass.”More generally, there is much to learn from history.As is often said, “History does not repeat itself,but it rhymes.” The Yearbook provides extensiveevidence on the market impact of crises, theduration of market declines and their time torecovery, the impact of fiscal and monetary stimulion stock and bond prices, the effects of increasesand decreases in real interest rates and theimpact of low real interest rates on futureexpected returns, the speed with which we canexpect market volatility to revert to “normal” and,finally, the impact of changes in technology. Thepandemic has accelerated many existing trendsin the use of technology. Many of these changeswill be permanent, often for the better.equity premium. It looks at how volatility and riskpremiums vary over time. It provides estimates ofexpected stock and bond returns, comparingthese with returns over recent decades.Chapter 6 of the full book presents evidence onfactor investing around the world. It documentsthe historical premiums from size, value, income,momentum, volatility and other factors. Chapter7 addresses prospective factor premiums. Itreviews the statistical evidence and theoreticalbasis for factor premiums and discusses whetherthey are likely to persist. Chapter 8 looks atemerging markets, their nature, importance,evolution and long-run performance. It examinesfactor investing and rotation strategies withinthe emerging world.Finally, Chapter 9 of the full printed GlobalInvestment Returns Yearbook presents adetailed historical analysis of the performanceof each of our 32 Yearbook countries and fivecomposite indexes, providing data sources andreferences.The Yearbook databaseThe contents of the YearbookThe core of the Credit Suisse Global InvestmentReturns Yearbook is the long-run DMS database(Dimson, Marsh, and Staunton, 2021) coveringinvestment returns in 32 countries over periodsof up to 121 years. We believe the unrivalledbreadth and quality of its underlying data makethe Yearbook the global authority on the long-runperformance of stocks, bonds, bills, inflation andcurrencies. The Yearbook updates and extendsthe key findings from our book “Triumph of theOptimists.”The global database that underpins the Yearbookcontains annual returns on stocks, bonds, bills,inflation, and currencies for 32 countries. Ofthese, 23 (the DMS 23) have 121-year historiesfrom 1900 to 2020. This year, we have added afurther nine markets, with start dates in the secondhalf of the 20th century, and typically more than50 years of data. Together with the DMS 23,these make up the DMS 32. These are the 32individual markets that we refer to later in thisdocument in Figure 17 and in the accompanyingdiscussion.The full printed Yearbook provides detailed analysisof long-term trends, so a review of its contentsmay be helpful. It provides historical perspectiveon the evolution of equity markets and sovereigndebt over the last 121 years, and the industrialtransformation that accompanied this. In thehardcopy book, Chapter 2 explains why a longrun perspective is important and summarizes thelong-run returns on stocks, bonds, bills andinflation since 1900. Chapter 3 focuses oncurrencies, looking at long-run exchange ratechanges, purchasing power parity and the casefor hedging.The DMS 23 countries, all with 1900 start dates,comprise the United States and Canada, teneurozone countries (Austria, Belgium, Finland,France, Germany, Ireland, Italy, the Netherlands,Portugal, and Spain), six other Europeancountries (Denmark, Norway, Russia, Sweden,Switzerland, and the United Kingdom), fourAsia-Pacific markets (Australia, China, Japan,and New Zealand) and one African market(South Africa).Continuing with the full Yearbook that underpinsthis summary, Chapter 4 deals with equity andbond risk. It looks at extreme periods of historyand examines equity and bond drawdowns andtime-to-recovery, and presents data on the historical equity risk premium around the world.Chapter 5 moves from historical to prospectivereturns, and shows how returns vary with thereal interest rate and estimates the prospective6Of the nine new markets, seven are fromAsia-Pacific and two from Latin America. Themarkets and their start dates are: Brazil (1951),Hong Kong SAR (1963), India (1953), Malaysia(1970), Mexico (1969), Singapore (1966),South Korea (1963), Taiwan (Chinese Taipei)(1967) and Thailand (1976). There are 58further countries for which we have equity returns,inflation and currency data, but not yet bond orbill returns. These start later, with the periodcovered ranging from 11 to 45 years.
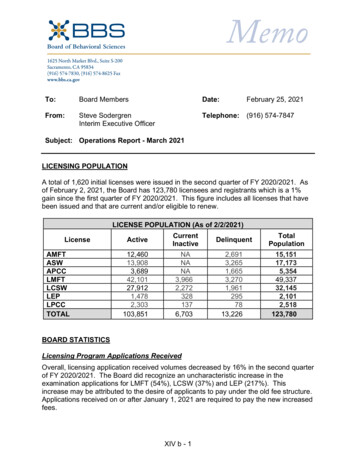
The DMS database also includes five compositeindexes for equities and bonds denominated ina common currency, here taken as US dollars.These cover the World, World ex-USA, Europe,Developed markets and Emerging markets. Theequity indexes are based on the full DMS 90universe, and are weighted by each country’smarket capitalization. The bond indexes arebased on the DMS 32 and are weighted bygross domestic product (GDP).Together, at the start of 2021, the 32 Yearbookmarkets (the DMS 32) make up 98.5% of theinvestable equity universe for a global investor,based on free-float market capitalizations. Our90-country world equity index spans the entireinvestable universe. We are not aware of anyother world index that covers as many as 90countries.Most of the DMS 32, and all of the DMS 23countries experienced market closures at somepoint, mostly during wartime. In almost all cases,it is possible to bridge these closures and constructa returns history that reflects the experience ofinvestors over the closure period. Russia andChina are exceptions. Their markets were interrupted by revolutions, followed by long periods ofcommunist rule. Markets were closed, not justtemporarily, but with no intention of reopening,and assets were expropriated.For 21 countries, we thus have a continuous121-year history of investment returns, for whichwe present summary statistics in the next chapter.For Russia and China, we have returns for thepre-communist era, and for the period sincethese markets reopened in the early 1990s.The expropriation of Russian assets after 1917and Chinese assets after 1949 could be seenas wealth redistribution, rather than wealth loss.But investors at the time would not have warmedto this view. Shareholders in firms with substantialoverseas assets may also have salvaged someequity value, e.g. Chinese companies with assetsin Hong Kong (now Hong Kong SAR), andFormosa (now Taiwan (Chinese Taipei)). Despitethis, when incorporating these countries into ourcomposite indexes, we assume that shareholdersand bondholders in Russia and China sufferedtotal losses in 1917 and 1949. We then reinclude these countries in the indexes aftertheir markets re-opened in the early 1990s.The DMS 23 series all commence in 1900,and this common start date aids internationalcomparisons. Data availability and qualitydictated this start date, which proved to be theearliest plausible date that allowed broad coveragewith good quality data (see Dimson, Marsh, andStaunton, 2007).Financial markets have changed and grownenormously since 1900. Meanwhile, over thelast 121 years, the industrial landscape haschanged almost beyond recognition.In the following sections, we look at the development of equity markets over time, and at theGreat Transformation that has occurred inindustrial structure due to technological change.The evolution of equity marketsAlthough stock markets in 1900 were ratherdifferent from today, they were by no means anew phenomenon. The Amsterdam exchangehad already been in existence for nearly 300years; the London Stock Exchange had beenoperating for over 200 years; and five othermarkets, including the New York StockExchange, had been in existence for 100 yearsor more.Figure 1 overleaf shows the relative sizes ofworld equity markets at our starting date of end1899 (left panel) and how they had changed byend-2020 (right panel). The right panel showsthat the US market dominates its closest rivaland today accounts for nearly 56% of total worldequity market value. Japan (7.4%) is in secondplace, ahead of China (5.1%) in third place, andthe United Kingdom (4.1%) in fourth position.France, Switzerland and Germany each representjust under 3% of the global market, followed byCanada, Australia, South Korea and Taiwan(Chinese Taipei), all with close to 2% weightings.In Figure 1, eleven of the Yearbook countries –all those accounting for around 2% or more ofworld market capitalization – are shown separately, with the remaining 21 Yearbook marketsgrouped together as “Smaller DMS 32,” with acombined weight of 10%. The remaining area ofthe right-hand pie chart labelled “Not in DMS32” shows that the 32 Yearbook countries nowcover all but 1.4% of total world market capitalization. This remaining 1.4% is captured withinthe DMS 90 and is made up almost entirely ofemerging and frontier markets.Note that the right-hand panel of Figure 1 isbased on the free-float market capitalizations ofthe countries in the FTSE All-World index, whichspans the investable universe for a global investor.Emerging markets represent a higher proportionof the world total when measured using full-floatweights or when investability criteria are relaxed.The left panel of Figure 1 shows the equivalentbreakdown at the end-1899 start of the DMSdatabase. The chart shows that, at the start ofthe 20th century, the UK equity market was thelargest in the world, accounting for almost aquarter of world capitalization, and dominatingCredit Suisse Global Investment Returns Yearbook Summary Edition 20217
Figure 1: Relative sizes of world stock markets, end-1899 (left) versus start-2021 (right)Germany 13%France 11.2%Japan 7.4%USA55.9%Russia 5.9%USA 15%China 5.1%UK 4.1%Austria 5.0%France 2.9%Belgium 3.4%Switzerland 2.6%Australia 3.4%Germany 2.6%Canada 2.4%South Africa 3.2%Australia 2.1%Korea 1.8%Taiwan (Chinese Taipei) 1.7%Netherlands 2.5%Italy 2.0%UK 24%Not in DMS 234.7%Smaller DMS 237.5%Not in DMS 321.4%Smaller DMS 3210.0%Sources: Elroy Dimson, Paul Marsh and Mike Staunton, Triumph of the Optimists, Princeton University Press, 2002, and Global Investment Returns Yearbook, CreditSuisse, 2021; FTSE Russell All-World Index Series Monthly Review, December 2020. Not to be reproduced without express written permission from the authors.even the US market (15%). Germany (13%)ranked in third place, followed by France, Russia,and Austria-Hungary. Again, 11 Yearbook countries are shown separately, while the remaining12 countries for which we have data for 1900are grouped together and labelled “Smaller DMS23” countries.more, Russia was a large market in 1900,accounting for some 6% of world market capitalization. While Austria-Hungary was not a totalinvestment disaster, it was the worst-performingequity market and the second worst-performingbond market of our 21 countries with continuousinvestment histories.In total, the DMS database covered over 95% ofthe global equity market in 1900. The countriesrepresenting the missing 4.7% labelled as “Notin DMS 23” have been captured in later years bythe nine new markets added in 2021, and by thefull DMS 90 database. However, we do not havereturns data for these markets back in 1900.Ensuring that the DMS database containedreturns data for Austria, China, and Russia from1900 onward was thus important in eliminatingsurvivorship and “non-success” bias. The secondand opposite source of bias, namely successbias, is even more serious.A comparison of the left- and right-hand sides ofFigure 1 shows that countries had widely differingfortunes over the intervening 121 years. Thisraises two important questions. The first relatesto survivorship bias. Investors in some countrieswere lucky, but others suffered financial disasteror dreadful returns. If countries in the lattergroup are omitted, there is a danger of overstatingworldwide equity returns.Austria and Russia are small markets today,accounting for just 0.05% and 0.34% of worldcapitalization. Similarly, China was a tiny marketin 1900, accounting for 0.34% of world equities.In assembling the DMS database, it might havebeen tempting to ignore these countries, and toavoid the considerable effort required to assembletheir returns data back to 1900.However, Russia and China are the two bestknown cases of markets that failed to survive,and where investors lost everything. Further8The USA is by far the world’s best-documentedcapital market. Prior to assembly of the DMSdatabase, the evidence cited on long-run assetreturns was almost invariably taken from USmarkets and was typically treated as beinguniversally applicable. Yet organized tradingin marketable securities began in Amsterdamin 1602 and London in 1698, but did notcommence in New York until 1792.Since then, the US share of the global stockmarket has risen from zero to 56%. This reflectsthe superior performance of the US economy,the large volume of IPOs, and the substantialreturns from US stocks. No other market canrival this long-term accomplishment. But thismakes it dangerous to generalize from US assetreturns since they exhibit “success bias.” This iswhy our focus in the Yearbook is on globalreturns.
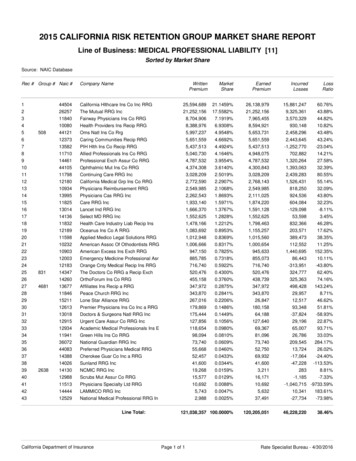
Meanwhile, makers of horse-drawn carriagesand wagons, canal boats, steam locomotives,candles, and matches have seen their industriesdecline. There have been profound changes inwhat is produced, how it is made, and the way inwhich people live and work.The great industrial transformationAt the start of 1900 – the start date of our globalreturns database – virtually no one had driven acar, made a phone call, used an electric light,heard recorded music, or seen a movie; no onehad flown in an aircraft, listened to the radio,watched TV, used a computer, sent an e-mail,or used a smartphone. There were no x-rays,body scans, DNA tests, or transplants, and noone had taken an antibiotic; as a result, manywould die young.These changes can be seen in the shiftingcomposition of the firms listed on world markets.Figure 2 shows the industrial composition oflisted companies in the USA and the UK. Theupper two charts show the position at the startof 1900, while the lower two show the beginningof 2021. Markets at the start of the 20th centurywere dominated by railroads, which accountedfor 63% of US stock market value and almost50% of UK value. More than a century later,railroads declined almost to the point of stockmarket extinction, representing less than 1% ofthe US market and close to zero in the UK.Mankind has enjoyed a wave of transformativeinnovation dating from the Industrial Revolution,continuing through the Golden Age of Inventionin the late 19th century, and extending intotoday’s information revolution. This has givenrise to entire new industries: electricity andpower generation, automobiles, aerospace,airlines, telecommunications, oil and gas,pharmaceuticals and biotechnology, computers,information technology, and media and entertainment.Of the US firms listed in 1900, more than 80%of their value was in industries that are todaysmall or extinct; the UK figure is 65%. Besidesrailroads, other industries that have declinedprecipitously are textiles, iron, coal, and steel.Figure 2: Industry weightings in the USA (left) and UK (right), 1900 compared with 2021United StatesUnited 900Iron, coalsteelRailIron, coalsteelUtilitiesDrinksTobaccoOther industrialTelegraphOtherFoodOther ialOtherfinancial2021Oil &gasTobaccoBanksMediaOil & avel & leisureTelecomsDrinksTravel & rces: Elroy Dimson, Paul Marsh and Mike Staunton, Triumph of the Optimists, Princeton University Press, 2002, and Global Investment Returns Yearbook, CreditSuisse, 2021; FTSE Russell All-World Index Series Monthly Review, December 2020. Not to be reproduced without express written permission from the authors.Credit Suisse Global Investment Returns Yearbook Summary Edition 20219
These industries still exist, but have moved tolower-cost locations in the emerging world. Yetsimilarities between 1900 and 2021 are alsoapparent. The banking and insurance industriescontinue to be important. Similarly, such industries as food, beverages (including alcohol),tobacco, and utilities were present in 1900 justas they are today. And, in the UK, quoted miningcompanies were important in 1900 just as theyare in London today.reward as well as disappoint. It all depends onwhether stock prices correctly embed expectations. For example, we noted above that, instock-market terms, railroads were the ultimatedeclining industry in the USA in the period since1900. Yet, over the last 121 years, railroadstocks have beaten the US market, and outperformed both trucking stocks and airlines sincethese industries emerged in the 1920s and1930s.But even industries that initially seem similarhave often altered radically. For example,compare telegraphy in 1900 with smartphonesin 2021. Both were high-tech at the time. Orcontrast other transport in 1900 – shipping lines,trams, and docks – with their modern counterparts, airlines, buses, and trucking. Similarly,within industrials, the 1900 list of companiesincludes the world’s then-largest candle makerand the world’s largest manufacturer of matches.Indeed, the research in the 2015 Yearbookindicated that, if anything, investors may haveplaced too high an initial value on new technologies, overvaluing the new, and undervaluing theold. We showed that an industry value rotationstrategy helped lean against this tendency andhad generated superior returns.Another statistic that stands out from Figure 2is the high proportion of today’s companies thatcome from industries that were small or nonexistent in 1900: 63% by value for the USA and44% for the UK. The largest industries in 2021are technology (in the USA, but not the UK), thecatch-all group of industrials, healthcare, oil andgas, banking, mining (for the UK, but not theUSA), insurance, other financials and retail. Ofthese, oil and gas, technology, and healthcare(including pharmaceuticals and biotechnology)were almost totally absent in 1900. Telecomsand media, at least as we know them now, arealso new industries.This year, we added nine new markets, and twonew composite indexes to our database. TheYearbook now covers in detail 32 markets andfive composite indexes. Twenty-three of thecountries and all five indexes span the 121-yearperiod since 1900. This year, we have als
Yearbook. In the Yearbook, renowned financial historians Professor Elroy Dimson, Professor Paul Marsh and Dr. Mike Staunton assess the returns and risks from investing in equities, bonds, cash, currencies and factors in 23 countries and in five different composite indexes since 1900. This year, the database is broadened to include 90