Transcription
DC Electrical Circuit AnalysisLaboratory ManualJames M. Fiore
2Laboratory Manual for DC Electrical Circuit Analysis
Laboratory ManualforDC Electrical Circuit AnalysisbyJames M. FioreVersion 1.4.3, 28 October 2020Laboratory Manual for DC Electrical Circuit Analysis3
This Laboratory Manual for DC Electrical Circuit Analysis, by James M. Fiore is copyrighted underthe terms of a Creative Commons license:This work is freely redistributable for non-commercial use, share-alike with attributionPublished by James M. Fiore via dissidentsISBN13: 978-1796777543For more information or feedback, contact:James Fiore, ProfessorElectrical Engineering TechnologyMohawk Valley Community College1101 Sherman DriveUtica, NY 13501jfiore@mvcc.eduFor the latest revisions, related titles, and links to low cost print versions, go to:www.mvcc.edu/jfiore or my mirror sites www.dissidents.com and www.jimfiore.orgYouTube Channel: Electronics with Professor FioreCover art, Chapman's Contribution, by the author4Laboratory Manual for DC Electrical Circuit Analysis
IntroductionThis laboratory manual is intended for use in a DC electrical circuits course and is appropriate for two andfour year electrical engineering technology curriculums. The manual contains sufficient exercises for atypical 15 week course using a two to three hour practicum period. The topics range from basic laboratoryprocedures and resistor identification through series-parallel circuits, mesh and nodal analysis,superposition, Thevenin’s theorem, maximum power transfer theorem, and concludes with anintroduction to capacitors and inductors. For equipment, each lab station should include a dual adjustableDC power supply and a quality DMM capable of reading DC voltage, current and resistance. A selection ofstandard value ¼ watt carbon film resistors ranging from a few ohms to a few mega ohms is requiredalong with 10 kΩ and 100 kΩ potentiometers, 100 nF and 220 nF capacitors, and 1 mH and 10 mHinductors. A decade resistance box may also be useful.Each exercise begins with an Objective and a Theory Overview. The Equipment List follows with spaceprovided for serial numbers and measured values of components. Schematics are presented next alongwith the step-by-step procedure. All data tables are grouped together, typically with columns for thetheoretical and experimental results, along with a column for the percent deviations between them.Finally, a group of appropriate questions are presented. For those with longer scheduled lab times, auseful addition is to simulate the circuit(s) with a SPICE-based tool such as Multisim, PSpice, TINA-TI,LTspice, or similar software, and compare those results to the theoretical and experimental results as well.A companion laboratory manual for AC electrical circuits is also available. Other manuals in this seriesinclude Semiconductor Devices (diodes, bipolar transistors and FETs), Operational Amplifiers & LinearIntegrated Circuits, Computer Programming with Python and Multisim , and Embedded ControllersUsing C and Arduino. Texts are available for DC and AC Electrical Circuit Analysis, EmbeddedControllers, Op Amps & Linear Integrated Circuits, and Semiconductor Devices.A Note from the AuthorThis work was borne out of the frustration of finding a lab manual that covered all of the appropriatematerial at sufficient depth while remaining readable and affordable for the students. It is used at MohawkValley Community College in Utica, NY, for our ABET accredited AAS program in Electrical EngineeringTechnology. I am indebted to my students, co-workers and the MVCC family for their support andencouragement of this project. While it would have been possible to seek a traditional publisher for thiswork, as a long-time supporter and contributor to freeware and shareware computer software, I havedecided instead to release this using a Creative Commons non-commercial, share-alike license. Iencourage others to make use of this manual for their own work and to build upon it. If you do add to thiseffort, I would appreciate a notification.“Begin with the possible and move gradually towards the impossible”-Robert FrippLaboratory Manual for DC Electrical Circuit Analysis5
6Laboratory Manual for DC Electrical Circuit Analysis
Table of Contents1. The Electrical Laboratory.82. DC Sources and Metering .143. Resistor Color Code .184. Ohm’s Law.24.286. Parallel DC Circuits .327. Series-Parallel DC Circuits .368. Ladders and Bridges.409. Potentiometers and Rheostats.4410. Superposition Theorem.4811. Thévenin’s Theorem .5212. Maximum Power Transfer.5613. Nodal Analysis.6014. Mesh Analysis.6415. Capacitors and Inductors .68Appendix A: Technical Report Guidelines.72Appendix B: Example Technical Report.74Appendix C: Creating Graphs Using a Spreadsheet79Appendix D: Using a Solderless Breadboard .81.5. Series DC Circuits.Laboratory Manual for DC Electrical Circuit Analysis.7
1The Electrical LaboratoryObjectiveThe laboratory emphasizes the practical, hands-on component of this course. It complements thetheoretical material presented in lecture, and as such, is integral and indispensible to the mastery of thesubject. There are several items of importance here including proper safety procedures, required tools,and laboratory reports. This exercise will finish with an examination of scientific and engineeringnotation, the standard form of representing and manipulating values.Lab Safety and ToolsIf proper procedures are followed, the electrical lab is a perfectly safe place in which to work. There aresome basic rules: No food or drink is allowed in lab at any time. Liquids are of particular danger as theyare ordinarily conductive. While the circuitry used in lab is normally of no shock hazard, some of the testequipment may have very high internal voltages that could be lethal (in excess of 10,000 volts). Spilling abottle of water or soda onto such equipment could leave the experimenter in the receiving end of a severeshock. Similarly, items such as books and jackets should not be left on top of the test equipment as itcould cause overheating.Each lab bench is self contained. All test equipment is arrayed along the top shelf. Beneath this shelf atthe back of the work area is a power strip. All test equipment for this bench should be plugged into thisstrip. None of this equipment should be plugged into any other strip. This strip is controlled by a singlecircuit breaker which also controls the bench light. In the event of an emergency, all test equipment maybe powered off through this one switch. Further, the benches are controlled by dedicated circuit breakersin the front of the lab. Next to this main power panel is an A/B/C class fire extinguisher suitable forelectrical fires. Located at the rear of the lab is a safety kit. This contains bandages, cleaning swaps andthe like for small cuts and the like. For serious injury, the Security Office will be contacted.A lab bench should always be left in a secure mode. This means that the power to each piece of testequipment should be turned off, the bench itself should be turned off, all AC and DC power and signalsources should be turned down to zero, and all other equipment and components properly stowed with labstools pushed under the bench.8Laboratory Manual for DC Electrical Circuit Analysis
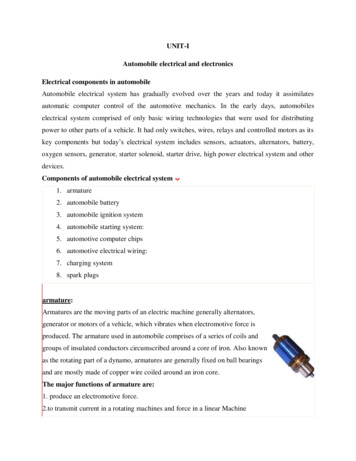
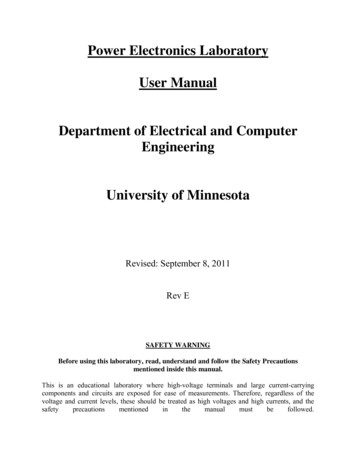
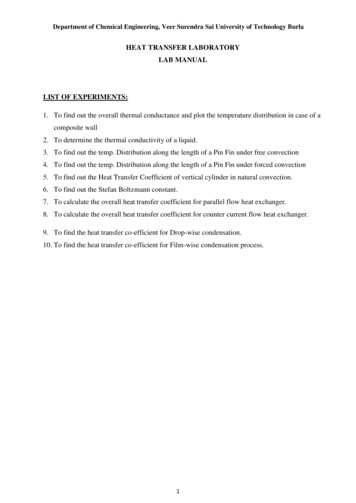
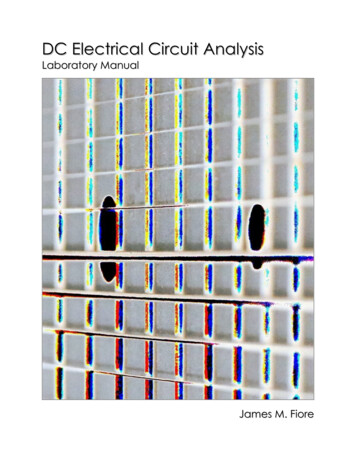
It is important to come prepared to lab. This includes the class text, the lab exercise for that day, classnotebook, calculator, and hand tools. The tools include an electronic breadboard, test leads, wire strippers,and needle-nose pliers or hemostats. A small pencil soldering iron may also be useful. A basic DMM(digital multimeter) rounds out the list.A typical breadboard or protoboard is shown below:This particular unit features two main wiring sections with a common strip section down the center.Boards can be larger or smaller than this and may or may not have the mounting plate as shown. Theconnections are spaced 0.1 inch apart which is the standard spacing for many semiconductor chips. Theseare clustered in groups of five common terminals to allow multiple connections. The exception is thecommon strip which may have dozens of connection points. These are called buses and are designed forpower and ground connections. Interconnections are normally made using small diameter solid hookupwire, usually AWG 22 or 24. Larger gauges may damage the board while smaller gauges do not alwaysmake good connections and are easy to break.In the picture below, the color highlighted sections indicate common connection points. Note the longblue section which is a bus. This unit has four discrete buses available. When building circuits on abreadboard, it is important to keep the interconnecting wires short and the layout as neat as possible. Thiswill aid both circuit functioning and ease of troubleshooting.Examples of breadboard usage can be found in Appendix D. Be sure to read it!Laboratory Manual for DC Electrical Circuit Analysis9
Laboratory ReportsUnless specified otherwise, all lab exercises require a non-formal laboratory report. Lab reports areindividual endeavors not group work. The deadline for reports is one week after the exercise isperformed. A letter grade is subtracted for the first half-week late and two letter grades are subtracted forthe second half-week late. Reports are not acceptable beyond one week late. A basic report should includea statement of the Objective (i.e., those items under investigation), a Conclusion (what was found orverified), a Discussion (an explanation and analysis of the lab data which links the Objective to theConclusion), Data Tables and Graphs, and finally, answers to any problems or questions posed in theexercise. Details of the structure of the report along with an example report may be found in AppendicesA, B and C.Scientific and Engineering NotationScientists and engineers often work with very large and very small numbers. The ordinary practice ofusing commas and leading zeroes proves to be very cumbersome in this situation. Scientific notation ismore compact and less error prone method of representation. The number is split into two portions: aprecision part (the mantissa) and a magnitude part (the exponent, being a power of ten). For example, thevalue 23,000 could be written as 23 times 10 to the 3rd power (that is, times one thousand). The exponentmay be thought of in terms of how places the decimal point is moved to the left. Spelling this out isawkward, so a shorthand method is used where “times 10 to the X power” is replaced by the letter E(which stands for exponent). Thus, 23,000 could be written as 23E3. The value 45,000,000,000 would bewritten as 45E9. Note that it would also be possible to write this number as 4.5E10 or even 0.45E11. The10Laboratory Manual for DC Electrical Circuit Analysis
only difference between scientific notation and engineering notation is that for engineering notation theexponent is always a multiple of three. Thus, 45E9 is proper engineering notation but 4.5E10 isn’t. Onmost scientific calculators E is represented by either an “ EE” or “EXP” button. The process of entering thevalue 45E9 would be depressing the keys 4 5 EE 9.For fractional values, the exponent is negative and may be thought of in terms how many places thedecimal point must be moved to the right. Thus, 0.00067 may be written as 0.67E 3 or 6.7E 4 or even670E 6. Note that only the first and last of these three are acceptable as engineering notation.Engineering notation goes one step further by using a set of prefixes to replace the multiples of three forthe exponent. The prefixes are:E12 Tera (T)E 3 milli (m)E9 Giga (G)E 6 micro (µ)E6 Mega (M)E 9 nano (n)E3 kilo (k)E 12 pico (p)Thus, 23,000 volts could be written as 23E3 volts or simply 23 kilovolts.Besides being more compact, this notation is much simpler than the ordinary form when manipulatingwide ranging values. When multiplying, simply multiply the precision portions and add the exponents.Similarly, when dividing, divide the precision portions and subtract the exponents. For example, 23,000times 0.000003 may appear to be a complicated task. In engineering notation this is 23E3 times 3E 6.The result is 69E 3 (that is, 0.069). Given enough practice it will become second nature that kilo (E3)times micro (E 6) yields milli (E 3). This will facilitate lab estimates a great deal. Continuing,42,000,000 divided by 0.002 is 42E6 divided by 2E 3, or 21E9 (the exponent is 6 minus a negative 3, or9).When adding or subtracting, first make sure that the exponents are the same (scaling if required) and thenadd or subtract the precision portions. For example, 2E3 plus 5E3 is 7E3. By comparison, 2E3 plus 5E6 isthe same as 2E3 plus 5000E3, or 5002E3 (or 5.002E6).Perform the following operations. Convert the following into scientific and engineering notation.1. 1,5003. 0.02345. 1702. 63,200,0004. 0.000059Convert the following into normal longhand notation:6. 1.23E38. 2E 310. 4.39E77. 54.7E69. 27E 9Laboratory Manual for DC Electrical Circuit Analysis11
Use the appropriate prefix for the following:11. 4E6 volts13. 3.3E 6 grams12. 5.1E3 feetPerform the following operations:14. 5.2E6 1.7E616. 1.7E3 2E618. 20 / 4E320. 8 n / 2 m1215. 12E3 90017. 48E3 / 4E619. 10 M 2 kLaboratory Manual for DC Electrical Circuit Analysis
Laboratory Manual for DC Electrical Circuit Analysis13
2DC Sources and MeteringObjectiveThe objective of this exercise is to become familiar with the operation and usage of basic DC electricallaboratory devices, namely DC power supplies and digital multimeters.Theory OverviewThe adjustable DC power supply is a mainstay of the electrical and electronics laboratory. It isindispensible in the prototyping of electronic circuits and extremely useful when examining the operationof DC systems. Of equal importance is the handheld digital multimeter or DMM. This device is designedto measure voltage, current, and resistance at a minimum, although some units may offer the ability tomeasure other parameters such as capacitance or transistor beta. Along with general familiarity of theoperation of these devices, it is very important to keep in mind that no measurement device is perfect;their relative accuracy, precision, and resolution must be taken into account. Accuracy refers to how far ameasurement is from that parameter’s true value. Precision refers to the repeatability of the measurement,that is, the sort of variance (if any) that occurs when a parameter is measured several times. For ameasurement to be valid, it must be both accurate and repeatable. Related to these characteristics isresolution. Resolution refers to the smallest change in measurement that may be discerned. For digitalmeasurement devices this is ultimately limited by the number of significant digits available to display.A typical DMM offers 3 ½ digits of resolution, the half-digit referring to a leading digit that is limited tozero or one. This is also known as a “2000 count display”, meaning that it can show a minimum of 0000and a maximum of 1999. The decimal point is “floating” in that it could appear anywhere in the sequence.Thus, these 2000 counts could range from 0.000 volts up to 1.999 volts, or 00.00 volts to 19.99 volts, or000.0 volts to 199.9 volts, and so forth. With this sort of limitation in mind, it is very important to set theDMM to the lowest range that won’t produce an overload in order to achieve the greatest accuracy.A typical accuracy specification would be 1% of the reading plus two counts. “Reading” refers to thevalue displayed. If the 2 volt range was selected to read 1 volt (a measurement range of 0.000 to 1.999 fora 3 ½ digit meter), 1% would be 10 millivolts (0.01 volts). To this a further uncertainty of two counts(i.e., the finest digit) must be included. In this example, the finest digit is one millivolt (0.001 volts) sothis adds another 2 millivolts for a total of 12 millivolts of potential inaccuracy. In other words, the valuedisplayed by the meter could be as much as 12 millivolts higher or lower than the true value. For the 20volt range the inaccuracy would be computed in like manner but notice that accuracy is lost because thelowest digit is larger (i.e., the “counts” represent a larger value). In this case, the counts portion jumps upto 20 mV for a total inaccuracy of 30 mV. Obviously, if a signal in the vicinity of, say, 1.3 volts was to bemeasured, greater accuracy will be obtained on the 2 volt scale than on either the 20 or 200 volt scales. Incontrast, the 200 millivolt scale would produce an overload situation and cannot be used. Overloads areoften indicated by either a flashing display or a readout of “OL”. Finally, analog meters typically give abase accuracy in terms of a percentage of “full scale” (i.e., the selected scale or range) and not the signalitself, and obviously, there is no “counts” specification.14Laboratory Manual for DC Electrical Circuit Analysis
Equipment(1) Adjustable DC power supply(1) Digital multimeter(1) Precision digital multimetermodel: srn:model: srn:model: srn:Procedure1. Assume a general purpose 3 ½ digit DMM is being used. Its base accuracy is listed as 2% of readingplus 5 counts. Compute the inaccuracy caused by the scale and count factors and determine the totalfor a full scale reading. Record these values in Table 2.1.2. Repeat step one for a precision 4 ½ digit DMM specified as 0.5% of reading plus 3 counts. Record theresults in Table 2.2.3. Set the adjustable power supply to 2.2 volts via its display. Use both the Coarse and Fine controls toget as close to 2.2 volts as possible. Record the displayed voltage in the first column of Table 2.3.Using the general purpose DMM set to the DC voltage function, set the range to 20 volts full scale.Measure the voltage at the output jacks of the power supply. Be sure to connect the DMM and powersupply red lead to red lead, and black lead to black lead. Record the voltage registered by the DMM inthe middle column of Table 2.3. Reset the DMM to the 200 volt scale, re-measure the voltage, andrecord in the final column4. Repeat step three for the remaining voltages of Table 2.3.5. Using the precision DMM, repeat steps three and four, recording the results in Table 2.4.Data TablesScale2% Reading5 CountsTotal200 mV20 VTable 2.1Laboratory Manual for DC Electrical Circuit Analysis15
Scale.5% Reading3 CountsTotal200 mV2VTable 2.2VoltagePower SupplyDMM 20V ScaleDMM 200V Scale2.25.09.6515.0Table 2.3VoltagePower SupplyDMM 20V ScaleDMM 200V Scale2.25.09.6515.0Table 2.4Questions1. For the general purpose DMM of Table 2.1, which contributes the larger share of inaccuracy; the fullscale percentage or the count spec?2. Bearing in mind that the power supply display is really just a very limited sort of digital volt meter,which voltages in Table 2.3 and 2.4 do you suspect to be the most accurately measured and why?3. Assuming that the precision DMM used in Table 2.4 has a base accuracy spec of 0.1% plus 2 countsand is properly calibrated, what is the range of possible “true” voltages measured for 15.0 volts on the20 volt scale?16Laboratory Manual for DC Electrical Circuit Analysis
Laboratory Manual for DC Electrical Circuit Analysis17
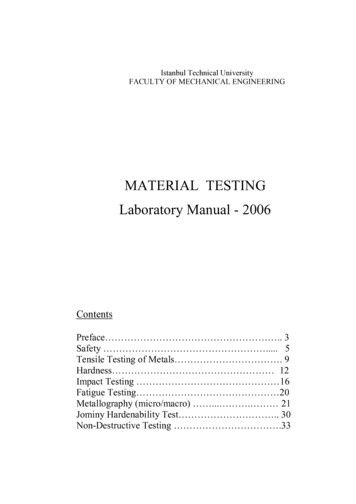
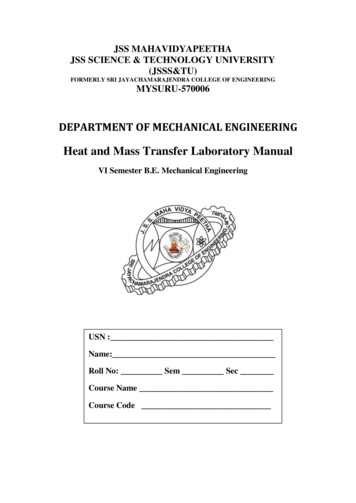
3Resistor Color CodeObjectiveThe objective of this exercise is to become familiar with the measurement of resistance values using adigital multimeter (DMM). A second objective is to learn the resistor color code.Theory OverviewThe resistor is perhaps the most fundamental of all electrical devices. Its fundamental attribute is therestriction of electrical current flow: The greater the resistance, the greater the restriction of current.Resistance is measured in ohms. The measurement of resistance in unpowered circuits may be performedwith a digital multimeter. Like all components, resistors cannot be manufactured to perfection. That is,there will always be some variance of the true value of the component when compared to its nameplate ornominal value. For precision resistors, typically 1% tolerance or better, the nominal value is usuallyprinted directly on the component. Normally, general purpose components, i.e. those worse than 1%,usually use a color code to indicate their value.The resistor color code typically uses 4 color bands. The first two bands indicate the precision values (i.e.the mantissa) while the third band indicates the power of ten applied (i.e. the number of zeroes to add).The fourth band indicates the tolerance. It is possible to find resistors with five or six bands but they willnot be examined in this exercise. Examples are shown below:18Laboratory Manual for DC Electrical Circuit Analysis
It is important to note that the physical size of the resistor indicates its power dissipation rating, not itsohmic value.Each color in the code represents a numeral. It starts with black and finishes with white, going throughthe rainbow in between:0 Black1 Brown2 Red3 Orange4 Yellow5 Green6 Blue7 Violet8 Gray9 WhiteFor the fourth, or tolerance, band:5% Gold10% Silver20% NoneFor example, a resistor with the color code brown-red-orange-silver would correspond to 1 2 followed by3 zeroes, or 12,000 ohms (more conveniently, 12 k ohms). It would have a tolerance of 10% of 12 k ohmsor 1200 ohms. This means that the actual value of any particular resistor with this code could beanywhere between 12,000 1200 10,800, to 12,000 1200 13,200. That is, 10.8 k to 13.2 k ohms.Note, the IEC standard replaces the decimal point with the engineering prefix, thus 1.2 k is alternatelywritten 1k2.Similarly, a 470 k 5% resistor would have the color code yellow-violet-yellow-gold. To help rememberthe color code many mnemonics have been created using the first letter of the colors to create a sentence.One example is the picnic mnemonic Black Bears Robbed Our Yummy Goodies Beating Various GrayWolves.Measurement of resistors with a DMM is a very straight forward process. Simply set the DMM to theresistance function and choose the first scale that is higher than the expected value. Clip the leads to theresistor and record the resulting value.Equipment(1) Digital multimetermodel: srn:Procedure1. Given the nominal values and tolerances in Table 3.1, determine and record the corresponding colorcode bands.2. Given the color codes in Table 3.2, determine and record the nominal value, tolerance and theminimum and maximum acceptable values.3.Obtain a resistor equal to the first value listed in Table 3.3. Determine the minimum and maximumacceptable values based on the nominal value and tolerance. Record these values in Table 3.3. Usingthe DMM, measured the actual value of the resistor and record it in Table 3.3. Determine thedeviation percentage of this component and record it in Table 3.3. The deviation percentage may befound via: Deviation 100 * (measured nominal)/nominal. Circle the deviation if the resistor is outof tolerance.4. Repeat Step 3 for the remaining resistor in Table 3.3.Laboratory Manual for DC Electrical Circuit Analysis19
Data TablesValueBand 1Band 2Band 3Band 427 @ 10%56 @ 10%180 @ 5%390 @ 10%680 @ 5%1.5 k @ 20%3.6 k @ 10%7.5 k @ 5%10 k @ 5%47 k @ 10%820 k @ 10%2.2 M @ 20 %Table dorange-orange-brown-silvergreen-blue-brown een-black-green-silverTable 3.220Laboratory Manual for DC Electrical Circuit Analysis
ValueMinimumMaximumMeasuredDeviation22 @ 10%68 @ 5%150 @ 5%330 @ 10%560 @ 5%1.2 k @ 5%2.7 k @ 10%8.2 k @ 5%10 k @ 5%33 k @ 10%680 k @ 10%5 M @ 20 %Table 3.3Laboratory Manual for DC Electrical Circuit Analysis21
Questions1. What is the largest deviation in Table 3.3? Would it ever be possible to find a value that is outside thestated tolerance? Why or why not?2. If Steps 3 and 4 were to be repeated with another batch of resistors, would the final two columns beidentical to the original Table 3.3? Why or why not?3. Do the measured values of Table 3.3 represent the exact values of the resistors tested? Why or whynot?22Laboratory Manual for DC Electrical Circuit Analysis
Laboratory Manual for DC Electrical Circuit Analysis23
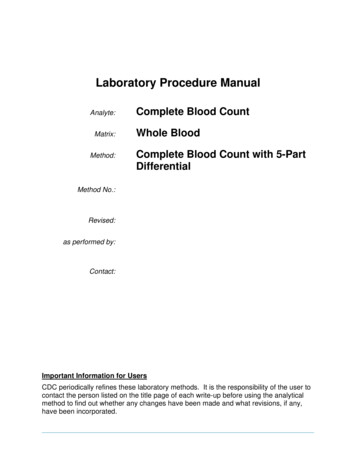
4Ohm’s LawObjectiveThis exercise examines Ohm’s law, one of the fundamental laws governing electrical circuits. It statesthat voltage is equal to the product of current times resistance.Theory OverviewOhm’s law is commonly written as V I * R. That is, for a given current, an increase in resistance willresult in a greater voltage. Alternately, for a given voltage, an increase in resistance will produce adecrease in current. As this is a first order linear equation, plotting current versus voltage for a fixedresistance will yield a straight line. The slope of this line is the conductance, and conductance is thereciprocal of resistance. Therefore, for a high resistance, the plot line will appear closer to the horizontalwhile a lower resistance will produce a more vertical plot line.Equipment(1) Adjustable DC power supplymodel: srn:(1) Digital multimetermodel: srn:(1) 1 kΩ resistor(1) 6.8 kΩ resistor(1) 33 kΩ resistorSchematicFigure 4.124Laboratory Manual for DC Electrical Circuit Analysis
Procedure1. Build the circuit of Figure 4.1 using the 1 kΩ resistor. Set the DMM to measure DC current and insertit in-line between the source and resistor. Set the source for zero volts. Measure and record thecurrent in Table 4.1. Note that the theoretical current is 0 and any measured value other than 0 wouldproduce an undefined percent deviation.2. Setting E at 2 volts, determine the theoretical current based on Ohm’s law and record this in Table4.1. Measure the actual current, determine the deviation, and record these in Table 4.1. Note thatDeviation 100 * (measured theory) / theory.3. Repeat step 2 for the remaining source voltages in Table 4.1.4. Remove the 1 kΩ and replace it with the 6.8 kΩ. Repeat steps 1 through 3 using Table 4.2.5. Remove the 6.8 kΩ and replace it with the 33 kΩ. Repeat steps 1 through 3 using Table 4.3.6. Using the measured currents from Tables 4.1, 4.2, and 4.3, create a plot of current versus voltage. Plotall three curves on the same graph. Voltage is the horizontal axis and current is the vertical axis.Data TablesE (volts)I theory00I measuredDeviation24681012Table 4.1 (1 kΩ)Laboratory Manual for DC Electrical Circuit Analysis25
E (volts)I theory00I measuredDeviation24681012Table 4.2 (6.8 kΩ)E (volts)I theory00I measuredDeviation24681012Table 4.3 (33 kΩ)Questions1. Does Ohm’s law appear to hold in this exercise?2. Is there a linear relationship between current and voltage?3. What is the relationship between the slope of the plot line and the circuit resistance?26Laboratory Manual for DC Electrical Circuit Analysis
Laboratory Manual for DC Electrical Circuit Analysis27
5Series DC CircuitsObjectiveThe focus of this exercise is an examination of basic series DC circuits with resistors. A key element isKirchhoff’s voltage law which states that the sum of voltage rises around a loop must equal the sum of thevoltage drops. The voltage divider rule will also be investigated.Theory OverviewA series circuit is defined by a single loop in which all components are arranged in daisy-chain fashion.The current is the same at all points in the loop and may be found by dividing the total voltage source bythe total resistance. The voltage drops across any resistor may then be found by multiplying that currentby the resistor value. Consequently, the voltage drops in a series circuit are directly proportional to theresistance. An alternate technique to find the voltage is the voltage divider rule. This states that thevoltage across any resistor (or combination of resistors) is equal to the total voltage source times the ratioof the resistance of interest to the total resistance.Equipment(1) Adjustable DC power supplymodel: srn:(1) Digital multimetermodel: srn:(1) 1 kΩ(1) 2.2 kΩ(1) 3.3 kΩ(1) 6.8 kΩSchematicsFigure 5.128Laboratory Manual for DC Electrical Circuit Analysis
Figure 5.2Procedure1. Using the circuit of Figure 5.1 with R1 1 k, R2 2.2 k, R3 3.3 k, and E 10 volts, determine thetheoretical current and record it in Table 5.1. Construct the circuit. Set the DMM to read DC currentand insert it in the circuit at point A. Remember, ammeters go in-line and require the circuit to beopened for proper measurement. The red lead should be placed closer to the positive source terminal.Record this current in Table 5.1. Repeat the current measurements at points B and C.2. Using the theoretical current found in Step 1, apply Ohm’s law to determine the expected voltagedrops across R1, R2, and R3. Record these values in the Theory column of Table 5.2.3. Set the DMM to measure DC voltage. Remember, unlike current, voltage is measured acrosscomponents. Place the DMM probes across R1 and measure its voltage. Again, red lead should beplaced closer to the positive source terminal. Record this value in Table 5.2. Repeat this process forthe voltages across R2 and R3. Determine the percent deviation between theoretical and measured foreach of the three resistor voltages and record these in the final column of Table 5.2.4. Consider the circuit of Figure 5.2 with R1 1 k, R2 2.2 k, R3 3.3 k, R4 6.8 k and E 20 volts.Using the voltage divider rule, determine the voltage drops across each of the four resistors andrecord the values in Table 5.3 under the Theory column. Note that the larger the resistor, the greaterthe voltage should be. Also determine the potentials V AC and VB, again using the voltage divider rule.5. Construct th
A companion laboratory manual for AC electrical circuits is also available. Other manuals in this series include Semiconductor Devices (diodes, bipolar transistors and FETs), Operational Amplifiers & Linear Integrated Circuits, Computer Programming with Python and