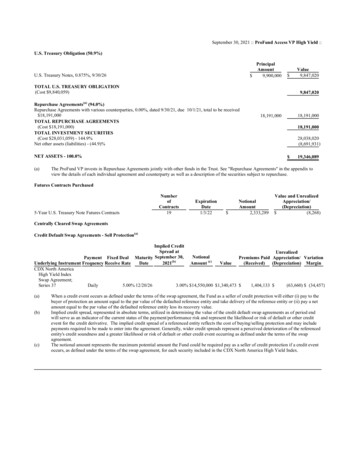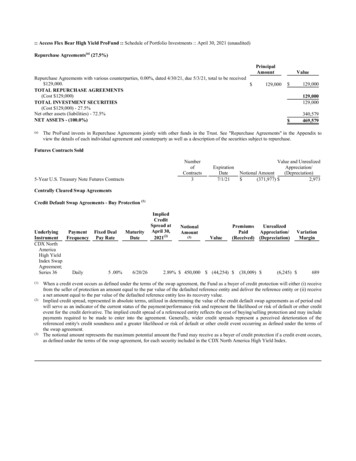
Transcription
U.S. Banks: Net Interest Income Gains Offer BufferAmid Emerging RisksLive webcast and Q&AMay 17th, 2022This report does not constitute a rating action
Recent Rating ActionsToFromEntityAction dateToFirstBank Puerto Rico4/26/2022BB/PositiveBB /StablePopular Inc.4/26/2022BB-/PositiveBB /StableHuntington Bancshares Inc.4/14/2022BBB /NegativeBBB /StableInvestors Bancorp Inc.*4/7/2022BBB-/Watch PosBBB /StablePeople’s United Financial Inc.4/4/2022BBB /StableNRBank Leumi USA*4/1/2022A-/Watch NegBBB /StableFirst Horizon Corp.**3/1/2022BBB-/PositiveBBB-/ Watch PosTexas Capital Bancshares Inc.2/25/2022BB /PositiveBBB-/Stable*Ratings subsequently withdrawn. ** Unsolicited rating. NR--Not rated. Source: S&P Global Ratings.2
U.S. Bank Rating Outlooks Maintain Positive BiasWe may raise the anchor for our ratings on U.S. banks to ‘a-’ from ‘bbb ’ in the next one to two years.Holding Company Rating DistributionHolding Company Outlook Distribution35PositiveWatch PosStableNegativeWatch 27%2015102512/31/20200AAA AA AAAA-A AA- BBB BBB BBB- BB 5/16/2022BBBB-B B6139B- CCC 3/31/2021Note: Includes banks domiciled in Puerto Rico. Data as of May 16, 2022. Source: S&P Global Ratings.3
Credit Conditions North AmericaS&P Global U.S. Economic Forecast OverviewMarch 2022)Key indicatorReal GDP (year % change)2020(3.4)(November 2021 .72.32.3Real consumer spending (year % change)(3.8)7.93.32.22.42.5Real equipment investment (year % 9Real residential investment, (year % change)6.89.1(0.4)0.11.21.4Core CPI (year % change)1.73.65.22.221.93.43.52.62.3Real nonresidential structures investment (year % change)(November 2021 forecast)Unemployment rate (%)8.15.43.63.53.53.5Housing starts (annual total in 2.75Light vehicle sales (annual total in mil.)10-year Treasury (%)Federal Reserve's fed funds policy target rate range (year-end%)Note: All percentages are annual averages, unless otherwise noted. Core CPI is the Consumer Price Index excluding energy and foodcomponents. f--forecast. Sources: Bureau of Economic Analysis, Bureau of Labor Statistics, Federal Reserve, Oxford Economics,and S&P Global Economics' forecasts.– We now expect real GDP growth of 3.2% in2022 (down from 3.9% in our prior forecast).– Supply-chain disruptions, worsened by theRussia-Ukraine conflict, remain the largeststumbling block for the U.S. economy.Extreme price pressures will likely last wellinto 2022 before decelerating and fallingbelow target in 2024.– Because inflation has remained elevated, weexpect the Federal Reserve to raise ratesseven times this year (including a 50-bpshike), four to five more times total in 2023.As inflation slows, the Fed will loosen policywith its first rate cut later in 2024.– We assess the risk of recession in the next12 months as about 1-in-4 (and less likelybefore 2023, as successive rate hikes takeeffect).4
2022 Forecast Rates, Loan Growth Play A Big PartWorseningNeutralImprovingRevenueNet interest income should rise materially on accelerated loan growth and monetary tightening by the Fed. But we expect fee income to declineowing to declines in mortgage volumes, capital markets, and financial asset valuations.ExpensesBanks will keep focusing on expenses, consolidating branches, and digitizing. However, wage inflation and investments in technology will driveexpenses up, likely at a low- to mid-single digit pace. Banks may continue to pursue mergers to gain scale and drive efficiencies.ProfitabilityProfitability will fall from 2021’s elevated levels as reserve releases ease. Provisions will move back into positive territory but most likely remainbelow 2019 levels. However, preprovision profitability should rise on higher net interest income, and we expect an industry return on commonequity of 9%-10%, somewhat below the 11% reached in 2019 and the 12% in 2021.Credit qualityIf the economy continues to grow, asset quality should remain in good shape, though delinquencies and charge-offs may inch up towardhistorical averages. Certain commercial loan categories, such as commercial real estate (CRE), may face medium-term challenges.CapitalFollowing a Q1 decline, capital ratios may fall modestly further. However, leverage requirements, stress testing, and other factors may limit theability of large banks to reduce capital.Funding and liquidityDeposit growth should slow meaningfully as the Fed tightens monetary policy. Funding and liquidity ratios will likely start to gradually weakenfrom historically strong levels.Source: S&P Global Ratings.5
Q1 Results
Earnings Fell In Q1 On Higher Provisions, Modestly Lower PPNR– Provisions, while still low, are up from the negative levels of 2020.– Higher expenses and lower fee income have offset improving net interest income, weighing on PPNR.– However, banks still generated a 10% ROAE and further increases in net interest income should support profitability.All FDIC-Insured Banks: Yearly PerformancePPNR (left scale)Net income (left scale)All FDIC-Insured Banks: Quarterly PerformanceProvisions for loan losses (left scale)ROAE (right scale)400PPNR (left scale)Net income (left scale)15350Provisions for loan losses (left scale)ROAE (right scale)1001315138030011116015071005509%200Bil. 9%Bil. 01Q21(20)2Q213Q214Q211Q221(1)PPNR--Preprovision net revenue. ROAE--Return on average equity. Sources: S&P Market Intelligence and FDIC.7
Allowances Fell Further – Near or Below Pre-Pandemic For Many–The ratio of allowances to loans for the industry is almost in line with where we estimate it was when CECL was implemented on Jan. 1,2020.– In the first quarter, that ratio was lower than on day 1 of CECL for almost half the banks we rate.– We do not expect further material declines, especially if the economic outlook weakens.Allowances/Loans And Provisions Of FDIC-Insured BanksAllowance to loans (left scale)Provisions for loan losses (right scale)702.5602.050%30201.010Total loans (bps)401.500.5(10)(20)0.0Jan 1, 2020Day 1 ent expected credit losses. Sources: S&P Global Ratings and S&P Market Intelligence based on aggregated data from call report schedule RI-C part II, which only applies to banks that have adopted ASU 2016-13and loans accounted for under amortized cost.8
Banks Have Reduced Allowances At Varying Rates– Good asset quality has allowed some banks to reduce allowances relative to loans well below the Day 1 CECL level (Jan. 1, 2020).– Others appear to have remained more cautious with allowances still materially higher than prior to the pandemic.Allowance/Loans: Top 10 Positive and Negative Difference Versus Day 1 of CECLBased on allowance for funded loansSallie MaeAmerican ExpressOFG BancorpPopular, Inc.First BanCorp.SVB FinancialAssociated Banc-CorpComericaKeyCorpJPMorgan ChasePNCCapital OneM&T Bank CorpHancock WhitneyWells FargoFirst CommonwealthAlly FinancialCullen/Frost .20)0.000.200.400.600.801.001.20%CECL--Current expected credit losses. Source: S&P Global Ratings.9
Provisions, Still Low, Should Rise But Remain Below 2019– Banks provisioned a modest 5 billion in in the first quarter as net charge-offs remained low at 23 bps and loans grewat a 5% annualized rate– We still expect provisions of roughly 35 billion- 45 billion, up from negative 31 billion in 2021, assuming: The allowances/loans ratio falls slightly lower to the pre-pandemic level ( 1.5%), Net charge-offs/average loans are 35 bps (up from 25 bps in 2021 and 23 bps in the first quarter), and Loan growth is 5%-7%.– These tables show sensitivity to those factors.Provisions(Bil. ) were 55 billion.–20222019provisions2022 Provisions (Bil. )Sensitivity to allowances and loan growth, assuming net charge-offs to loans of 35 basis pointsSensitivity to net charge-offs and loan growth assuming allowance to loans of 1.5%Loan growth (%)Loan growth (%)--Year-end 2022 allowance/loans----Net charge-offs/average 60529415273345103850NCO--Net charge-off. Source: S&P Global Ratings.10
NIMs Have Begun To Rise, Helping Offsetting Other Pressures– We expect net interest margins (NIMs) to climb from multi-decade lows as the Fed tightens monetary policy.– That should help drive higher net interest income and help offset pressure from higher provisions and expenses.Median NIM Of Rated BanksRegionalsBank Profitability Of All FDIC-Insured BanksPretax preprovision margin (left scale)Pretax margin (left scale)Return on average shareholders' equity (right scale)Money 211Q22Note: Money center banks include BAC, C, JPM, WFC. Sources: S&P Global Ratings, company filings, and FDIC.11
NIMs Should Rise Materially In The Next Several QuartersEffective Federal Funds, Three-Month LIBOR Based On USD, And 10-Year Treasury Minus Two-Year Treasury, Constant MaturityEffective Federal Funds rate (daily, not seasonally adjusted)3.0Three-month LIBOR based on USD10-year Treasury minus two-year Treasury, constant -22Median Q/Q Change in NIM, US Rated Banks4 bps in 1Q22 is the largest positive change since Q191Q202Q203Q204Q201Q212Q213Q214Q211Q22NIM--Net interest margin. LIBOR—London Inter-Bank Offered Rate. Source: S&P Global Ratings.12
Net Interest Income Could Rise Materially On Higher Rates– We believe net interest income could rise about 10%-12% this year and even faster next year, assuming the Fed increases its target rate to2.75%-3.00% this year (partially via multiple 50 bps hikes) and another 25 bps next year.–We believe liability betas will remain low due to banks’ currently good funding and liquidity.Hypothetical Impact of Higher Interest Rates, All FDIC-Insured Banks--Actual-(%)Change in avg. effectivefed funds .253.00-3.253.00-3.25Asset beta (full cycle)NANA051015151820232525Liability beta (full cycle)NANA00510101013151818Growth in avg earningassets and liabilitiesNANA0.81.01.01.06.00.00.00.00.02.0Avg. yield on .413.573.35Avg. cost of interestbearing end Fed targetrangeGrowth in net interestincomeNet interest marginAvg.--Average. N/A--Not applicable. Source: S&P Global Ratings.13
Loans Rising Across Consumer, Commercial, and CRE– Excluding Paycheck Protection Program loans, total loans rose 9% compared with the prior year and at a 5%-6% annualized ratecompared with the fourth quarter.– Commercial and industrial has accelerated in the last two quarters. Credit card and auto are driving consumer and multifamily iscontributing to CRE growth.– Still, economic uncertainty may limit that growth.Index Of Bank Loan Growth1Q21 100117112107Commercial ex-PPP, 114Consumer ex-auto, 112Total consumer, 111Auto, 109CRE, 108Total, 105102Res real estate, 103Commercial, 1019792Note: Commercial loans includes commercial and industrial (C&I), owner-occupied commercial real estate (CRE) loans, loans to banks and nondepository financial institutions, leases, and agriculture production loans onschedule RC-C Part I of the call report. Assumes banks include Paycheck Protection Program loans in those commercial loans. CRE includes non-owner-occupied CRE, construction, and multifamily loans. Sources: S&P GlobalRatings, S&P Market Intelligence, and call report data.14
Many Banks Reporting Fee Income Pressures– Declining revenues in investment banking, mortgage origination, overdraft fees and other areas is pressuring fee income after a strong2021.– A drop in asset prices may also weigh on asset and wealth management fees.Noninterest Income Select Components For All-FDIC BanksFiduciary activitiesService charges on deposit accountsTrading revenueInvestment banking, advisory, and underwriting feesGain on loans and servicing (e.g, mortgages)Other907780767677737033Bil. 1111Q212Q213Q214Q211Q220Sources: S&P Global Ratings, S&P Global Market Intelligence, and call report data.15
Capital Markets Revenue Down in Q1 On Lower Underwriting– Investment banking revenue fell significantly in the first quarter, especially on lower equity underwriting.– In our base case, we expect capital markets revenue – including investment banking and trading - to be down about 10% this year.Y/Y Change In Capital Markets RevenueFICCEquityInvestment bankingCapital Markets RevenueFICCTotal capital markets revenueEquityAdvisoryEquity IBDebt IB50904.47040503.030%104.94.613.3Bil. 10)9.210(30)(50)Q1 '17Q3 '17Q1 '18Q3 '18Q1 2'21Q3'2110.40Q1'21Q4'21Q1'22Note: Capital markets data derived by aggregating those on BAC, C, GS, JPM, and MS. FICC--Fixed income, currencies, and commodities. IB--Investment banking. Sources: S&P GlobalRatings and company filings.16
Expenses Rising On Tech Investments And Compensation– Expenses were little changed versus the fourth quarter but rose at a mid single-digit pace compared with the prior year.– Inflation, a tight labor market, and growth investments--including in fintech--are driving expenses higher.Non-Interest Expenses For All FDIC-Insured BanksSalary and benefitsPremises and fixed assetsOther 1Q221251261284852531212651Q21120Bil. 100806040200Source: S&P Global Ratings.17
Operating Leverage Now Negative On Higher Expenses, Lower Fees– Rising net interest income may help turn operating leverage back positive this year and next, but that will depend on banks’ ability tocontrol expenses.Operating Leverage And Efficiency, All FDIC-Insured BanksOperating Leverage Y/Y change in revenue – Y/Y change in noninterest expensesOperating leverageEfficiency ratio (right )(14.0)54Source: S&P Global Ratings.18
Asset Quality
Asset Quality Is Strong, But Should Deteriorate Modestly– Asset quality metrics have improved significantly aided by fiscal stimulus and accommodative monetary policies.– Criticized loans continue to decline, but nonperforming loans and net charge-offs have likely bottomed.– Continued supply chain constraints, elevated inflation, and surging interest rates amid Fed hikes will likely hurt loan performance.Asset Quality Metrics, All FDIC-Insured BanksCriticized loans (44 banks only)Nonperfoming loansAnnualized net charge-offsDelinquencies (30-90 4 '19Q1 '20Q2 '20Q3 '20Q4 '20Q1'21Q2'21Q3'21Q4'21Q1'22All U.S. commercial bank results based on aggregated call report data. Criticized loans are for 44 rated banks that have consistently reported such data for all reporting periods in the chart. Sources: S&P Global Ratings, S&PGlobal Market Intelligence, and regulatory filings.20
NCOs Remain Well Below Historical Levels, But Will Very Likely Rise– Loan losses declined further in the first quarter, but we expect them to gradually rise as the credit cycle eventually normalizes.– We think borrowers with adjustable-rate loans, high leverage, or already weak credit scores could be most vulnerable.Loan categoryConstruction and developmentloansClosed end real estate loanssecured by 1-4 family residentialproperties **Net charge-off rate 1Q22* (%)Y/Y change (%)LT median(1993 – 4Q21) (%)(1Q22 v. median) (%)Historical peak(1993 – 4Q21) 0Home equity lines of credit(0.27)(0.14)0.19(0.47)3.13Real estate load secured bynonfarm mmercial & industrial loans0.11(0.15)0.44(0.33)2.72Credit cards1.87(1.05)4.16(2.29)13.21Other loans to individuals0.44(0.11)0.99(0.55)3.04Auto loans**0.38(0.01)0.63(0.26)1.00Total loans & leases0.22(0.12)0.55(0.32)3.00Based on FDIC quarterly loan performance data for all FDIC-insured banks. *Q1 2022 net charge-offs based on call report data. **Auto loan data only available from Q1 2011. Closed End Real Estate Loans Secured by 1-4Family Residential Properties data only available from Q1 2002. NCO--Net Charge-Off. Source: S&P Global Ratings, Regulatory filings, and the FDIC.21
Lending Standards Have Eased, But Remain Generally Conservative– Lending standards have eased in recent quarters across most loan types from very conservative levels in 2020.– However, we think lending standards are generally conservative based on loan-to-value and coverage ratios, and documentationrequirements.Construction and land developmentNonfarm nonresidential (CRE)MultifamilyLarge and midsize ct-19Credit Apr-22GSE-eligible 9Jan-20Apr-20Jul-20Note: Pos More banks tightening; neg more banks loosening. CRE--Commercial real estate. GSE--Government-sponsored enterprise. Sources: FRB April 2022 Senior Loan Officer Opinion Survey on Bank LendingPractices.22
CRE Risk Recedes Despite Uncertainty For Select Property Types– Substantial commercial real estate (CRE) losses appear unlikely for most rated banks given generally rising property values and risingrental rates.– COVID-19-impacted property types such as hospitality, retail, and healthcare have recovered meaningfully, while office could struggle.Sensitivity Chart: Bank CRE Losses To Tier 1 Capital2,500CRE Past Due And Nonaccrual LoansBank CRE loans outstanding (left scale)Tier 1 capital (left scale)Losses (left scale)Capital (right scale)2,3112,3112,027Loans of U.S. commercial banks at least 30 days past dueCRE: .4861.2%Bil. 7%1,500CRE: .66%0.20.010CRE--Commercial real estate. CET1--Common Equity Tier 1. Sources: FDIC data and S&P Global Ratings.23
Property Prices Are Soaring, But Higher Rates Could Hurt Valuations– Soaring property prices have helped loan performance and limited loan losses so far.– Borrowers have generally locked in loan rates and have been able to increase rental rates.U.S. Real Estate Prices: Commercial Versus ResidentialIndex rebased to 100 as of 2003YECore commercial property price index (RCA)Office commercial property price index (RCA)Residential property price index (FHFA home purchase-only, SA)Retail commercial property price index (RCA)22520518516514512510585Note: Data as of May 11, 2022. Sources: Bloomberg and FHFA.24
Commercial Borrowers Are Healthy, But Some Could Be Vulnerable– So far, companies have been able to pass along higher costs to customers and maintain profit margins.– Large corporates have locked in low-cost debt, pushed out maturities, and have room to absorb higher interest rates.Nonfinancial Business And Household Sector Credit-To-GDP RatiosHousehold (left scale)Nonfinancial business (right 20002002200420062008201020122014201620182020Note: The shaded bars indicate periods of business recession as defined by the National Bureau of Economic Research. GDP--Gross domestic product. Data through 2021 Q3. Sources: Federal Reserve Board (FRB) staffcalculations based on Bureau of Economic Analysis, national income and product accounts, and FRB, Statistical Release Z.1, "Financial Accounts of the United States."25
Negative Bias Among S&P Ratings Has Declined Materially– Negative bias for U.S. companies has continued falling in recent months and is now at its lowest level since 2014.– Headwinds include high inflation, tightening financial conditions, ongoing supply chain disruptions, and escalating geopolitical . corporatenegative bias (leftscale)Count%The Number Of Sectors With Above-Average Downgrade Potential Falls To Zero12-month-trailingaverage U.S.corporate negativebias (left scale)U.S. corporatesectors with aboveaverage downgradepotential (right scale)Negative bias is the percentage of ratings with negative outlooks or that are on CreditWatch with negative implications. Count of U.S. corporate sectors with above-average downgrade potential shows the number of sectorswith a negative bias that is above the long-term negative bias for that sector. Source: S&P Global Ratings Research.26
Speculative-Grade Default Rates Have Plunged, But Will Likely Rise– U.S. corporate defaults were 1.5% in December 2021, but we are projecting them to rise to 3% by December 2022.– Following a brisk start to the year, leveraged loan and speculative-grade bond issuance volumes plunged in February and March.Regional Trailing 12-Month Speculative-Grade Default RatesGlobal8U.S.EuropeEmerging 20Dec-20Mar-21Jun-21Sep-21Dec-21Mar-22Data and default rates as of Feb. 28, 2022. Source: S&P Global Ratings.Net Issuance Of Risky Business DebtBil. High-yield and unrated bondsInstitutional leveraged 4201620182020Note: Institutional leveraged loans generally exclude loan commitments held by banks. Data through 2021 Q3. Sources: Mergent, Fixed Income Securities Database, S&P Global Market Intelligence, and LeveragedCommentary & Data.27
Consumers Are Well-Positioned Despite Higher Debt Balances– Consumer debt expanded across virtually all loan types in 2021, and we expect further growth if the economy remains strong.Total Consumer Debt Balance And CompositionMortgageHE revolvingAuto loanCredit cardStudent loanOther161412Tril. 3201420152016201720182019202020212022 Q1HE--Home equity. Source: New York Fed Consumer Credit Panel/Equifax.28
Credit Card Balances Increase As Payment Rates Normalize– After paying down credit card debt early in the pandemic, consumers are borrowing more again.RecessionSystemwide credit card loans (right scale)Unemployment rate (left scale)Systemwide net charge-off rate (left scale)1486512702 688 696 691 718107569031000942822800871800700600%64142 147 146 165115 126 13910084198266 250227 246 246 242 227292339500445 421399 396 385 422Bil. 19881987198619850Top 10 Largest Credit Card Lenders As Of Fourth-Quarter 2021 (Bil. ): Sample Is Roughly 90% Of Total Industry Card LoansCitigroup:149JPMorgan:138CapitalOne: 110Bank ofAmerica: 82Synchrony:81Discover:74AmericanExpress: 70WellsFargo: 38U.S.Bancorp: 24Barclays USLLC: 22Sources: S&P Global Ratings, FDIC Quarterly Banking Profile, regulatory filings, BLS, and Federal Reserve.29
Auto Originations Remain Elevated Amid Strong Resale Values– Auto originations are trending higher, but supply constraints (labor and semiconductors) continue to weigh on growth.– Despite a gradual shift toward longer loan maturities, loan losses have been modest amid rising resale values.Auto Originations Versus Price 620620-659660-719720-759760 Manheim used car index (right scale)250200Bil. 15010010050100 Q121:Q122:Q1Sources: New York Fed Consumer Credit Panel/Equifax and Bloomberg/Manheim Index.30
Capital, Liquidity, & Funding
Bank Capital Ratios Declined Moderately In Q1– Shareholder payouts and dividends will likely increase but will possibly be offset by performance on stress tests, loan growth, and otherbinding capital constraints.– Capital ratios could trend lower for regional banks depending on loan growth, but economic uncertainty may limit declines.Median CET1 Of Rated BanksMoney centerBroker dealersTrust banksRegional banksAll rated banks161514.45%14131211.401111.3011.2710.9310Q2 '17Q3 '17Q4 '17Q1 '18Q2 '18Q3 '18Q4 '18Q1 '19Q2 '19Q3 '19Q4 '19Q1 '20Q2 '20Q3 '20Q4 '20Q1'21Q2'21Q3'21Q4'21Q1'22Note: Transitional calculations. Excludes foreign US -based subsidiaries in portfolio. CET1--Common Equity Tier 1. Sources: S&P Global Ratings, bank regulatory filings, and S&P Global Market Intelligence.32
Some Banks Have Limited Room Over Capital Requirements– Many large banks look to maintain buffers of at least 50-100 bps over required risk-based minimums.– The upcoming June stress test and potential increases in global systemically important bank (GSIB) surcharges for some banks next yearwill affect requirements.Common Equity Tier 1 Ratio--Basel III Fully Phased In--Q1 2022--(%)--Q4 2021----Q/Q change (bps)--Advanced/standardized (lowerof the two)Q1 ET1 minimumCurrent CET1 surplus(deficit) over (under)proposed ndardizedAdvancedBank of America Corp.10.412.010.612.3(20)(30)S2.59.50.9Citigroup Inc.11.411.412.312.4(90)(100)S3.010.50.9JPMorgan Chase & Co.11.912.713.113.8(120)(110)S3.211.20.7Wells Fargo & Co.10.511.811.412.6(90)(80)S3.19.11.4Morgan n Sachs Group Inc.14.414.614.214.920(30)S6.413.41.0Bank of New York Mellon Corp.10.110.411.211.4(110)(100)S2.58.51.6State Street Corp.11.913.114.314.3(240)(120)S2.58.03.9Northern Trust Corp.11.412.111.913.2(50)(110)S2.57.04.4*SCB from June 2021 DFAST results. New SCB effective Oct. 1, 2021. CET1--Common Equity Tier 1. Sources: Company filings, S&P Global Ratings, the Federal Reserve Board, and S&P Cap IQ Pro.33
Rising Rates Hit Large Banks’ Capital Thru Lower Securities Values– Increased rates led to a rise in unrealized losses on available-for-sale securities, particularly for the trust banks.– Some banks are trying to limit further impacts by reclassifying securities as held to maturity and reducing duration with derivatives.– Other than the GSIBs and NTRS, banks are not required to count swings in unrealized losses in regulatory capital.Capital Impact of Net Unrealized Losses On AFS SecuritiesUnrealized losses/ RWA in 1Q22Net unrealized losses on AFS sec / RWA in 1Q (left scale)CET1 ratio 4Q21CET1 ratio 10.08.0AFS--Available for sale. CET1--Common Equity Tier 1. RWA--Risk weighted assets. GSIB--Global systemically important banks. NTRS—Northern Trust Corporation. Source: S&P Global Ratings.34
The Supplementary Leverage Ratio Has Constrained Capital– Risk-based ratios are still the most binding capital constraint for most global systemically important banks (GSIBs), but thesupplementary leverage ratio (SLR) has generally become more constraining following significant balance sheet expansion, especially atthe bank level.The Most Binding Capital Constraints Of The GSIBs, First-Quarter 2022(%)Wells FargoBank of New YorkMellonTotal capital ratio Tier 1 risk-based ratioTotal capital ratioGoldman SachsJPMorganCitigroupBank of AmericaMorgan StanleyTier 1 risk-based ratioSLRTotal capital ratioTotal capital ratioTotal capital ratio74647281313SLRSLRSLRSLRSLRSLRSLRTier 1 leverageGrowth in denominatorto breach minimum (%)15713524191318Assuming 10% growth,the retention of earnings (as a% of TTM earnings) necessaryfor 25 bps buffer over holdcoleverage minimums and 50bps buffer over holdco riskweighted minimums (%)32556665370147Holding companyGrowth in denominatorto breach minimum (%)Main subsidiary bankState StreetTTM--Trailing 12 months. Source: Company filings.35
Funding And Liquidity Remain Strong, But May Weaken Gradually– With the Fed raising rates and tightening, funding and liquidity levels should gradually weaken from historically strong levels.Liquidity Measures Of Commercial BanksFunding Measures Of Commercial BanksLiquid assets cash unpledged securities fed fundsCore deposits Deposits less brokered, jumbo, and foreign depositsLiquid assets/assetsLiquid assets/short-term debt depositsCash/(cash 555050Deposits/fundingCore deposits/depositsLoans/depositsSource: S&P Global Market Intelligence.36
Key Risks & Trends
Key Risks For U.S. Banking SectorThe probability ofrecession hasincreasedGeopoliticalrisksSecular changesaffecting commercialreal estateA potentially moreaggressive approach toaspects of regulatoryenforcements andsupervisionPersistently highinflation and marketdisruptionCeasing LIBOR-tiedoriginations in 2022 andfully transitioning by June2023Asset bubbles fromeconomic overheating(e.g. corporate debt,housing, CRE)Challenges fromfintech, cybersecurity,and digitaltransformation38
The Riskiness of Trading Assets Has D
AAA. AA . AA. AA-A . A. A-BBB . BBB. BBB-BB . BB. BB-B . B. B-CCC % 5/16/2022. 3/31/2021. . Sources: Bureau of Economic Analysis, Bureau of Labor Statistics, Federal Reserve, Oxford Economics, and S&P Global Economics' forecasts. . CECL--Current expected credit losses. Sources: S&P Global Ratings and S&P Market Intelligence based on .