Transcription
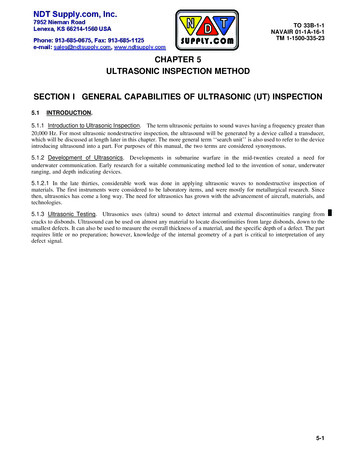
TO 33B-1-1NAVAIR 01-1A-16-1TM 1-1500-335-23CHAPTER 5ULTRASONIC INSPECTION METHODSECTION I GENERAL CAPABILITIES OF ULTRASONIC (UT) INSPECTION5.1INTRODUCTION.5.1.1 Introduction to Ultrasonic Inspection. The term ultrasonic pertains to sound waves having a frequency greater than20,000 Hz. For most ultrasonic nondestructive inspection, the ultrasound will be generated by a device called a transducer,which will be discussed at length later in this chapter. The more general term ‘‘search unit’’ is also used to refer to the deviceintroducing ultrasound into a part. For purposes of this manual, the two terms are considered synonymous.5.1.2 Development of Ultrasonics. Developments in submarine warfare in the mid-twenties created a need forunderwater communication. Early research for a suitable communicating method led to the invention of sonar, underwaterranging, and depth indicating devices.5.1.2.1 In the late thirties, considerable work was done in applying ultrasonic waves to nondestructive inspection ofmaterials. The first instruments were considered to be laboratory items, and were mostly for metallurgical research. Sincethen, ultrasonics has come a long way. The need for ultrasonics has grown with the advancement of aircraft, materials, andtechnologies.5.1.3 Ultrasonic Testing. Ultrasonics uses (ultra) sound to detect internal and external discontinuities ranging fromcracks to disbonds. Ultrasound can be used on almost any material to locate discontinuities from large disbonds, down to thesmallest defects. It can also be used to measure the overall thickness of a material, and the specific depth of a defect. The partrequires little or no preparation; however, knowledge of the internal geometry of a part is critical to interpretation of anydefect signal.5-1
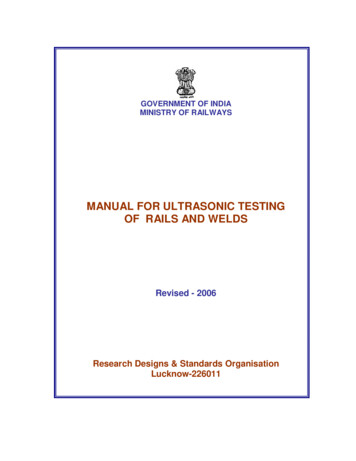
TO 33B-1-1NAVAIR 01-1A-16-1TM 1-1500-335-23SECTION II PRINCIPLES AND THEORY OF ULTRASONIC INSPECTION5.2INTRODUCTION.5.2.1 Characteristics of Ultrasonic Energy.5.2.1.1 Characteristics of Sound. The transmission of both audible sound and ultrasound is characterized by periodicvibrations of molecules or other small volume elements of matter. The vibration propagates through a material at a velocitycharacteristic to that material. As a particle is displaced from its rest position by any applied stress, it moves to a maximumdistance away from its rest position (this is called a maximum displacement). The particle then reverses direction and movespast its rest position to a maximum position in the negative direction (a second maximum displacement). The particle thenmoves back to its rest position, completing one cycle. This process continues until the source of vibration is removed and theenergy is passed on to an adjacent particle. The amplitudes of vibration in parts being ultrasonically inspected impose stresseslow enough, so that, there is no permanent effect to the part.5.2.1.2 To better understand the characteristics of sound, you must understand the terms associated with ultrasonics.5.2.1.2.1 The term “period” means the amount of time it takes to complete one cycle.5.2.1.2.2 The term “velocity” means the distance traveled per unit time (distance/second).5.2.1.2.3 The term “frequency” means the number of complete cycles that occur in one second.5.2.1.2.4 The term “hertz” means the cycles per second. For example: 1 hertz (Hz) one cycle/sec; 1 kilohertz (kHz) 1,000 cycles/sec; 1 Megahertz (MHz) 1,000,000 cycles/sec.5.2.1.2.5 The term “wavelength” is the distance a wave travels while going through one cycle.5.2.2 Generation and Receiving of Ultrasonic Vibrations. Ultrasonic vibrations are generated by applying electricalenergy to piezoelectric element contained within a transducer. This applied energy will be either a sudden high voltage spikefrom a discharging capacitor (a spike pulse), or a short pulse of constant voltage called a square wave. Also used wheremaximum power is needed from the transducer is a tone burst, which is a rapid series of square waves at a frequency matchedto the transducer. The spike pulse is most commonly used. The transducer element transforms the electrical energy intomechanical energy (vibration) at a frequency determined by the material and thickness of the element. For aircraft NDI, thisfrequency will be ultrasonic. This element is also capable of receiving ultrasonic (mechanical) energy and transforming it intoelectrical energy (e.g., reverse piezoelectric) (Figure 5-1). Ultrasonic energy is transmitted between the transducer and thetest part through a coupling medium (e.g., oil, grease, or water) (Figure 5-2). The purpose of a coupling material is toeliminate air at the interface between the transducer and the part under inspection. Air has high acoustic impedance, and thus,is a poor transmitter of ultrasound. Like audible sound waves, ultrasonic waves are capable of propagating through anyelastic medium (solid, liquid, gas), but not in a vacuum. Propagation in any gas is very poor.5-2
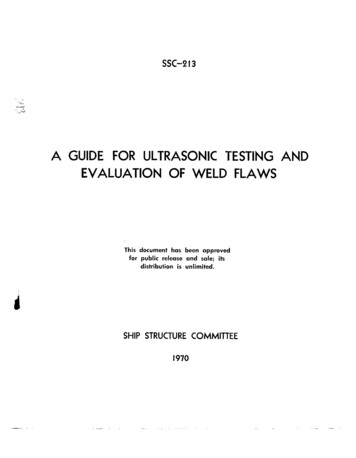
TO 33B-1-1NAVAIR 01-1A-16-1TM 1-1500-335-23Figure 5-1.Figure 5-2.Generation of Ultrasonic VibrationsCoupling Between the Transducer and the Test Part to Transmit Ultrasonic Energy5.2.3 Modes of Ultrasonic Vibration. Ultrasonic energy is propagated in a material by the vibration of particles in thematerial. The mode of vibration is dependent upon the direction in which the particles vibrate in relation to the propagationdirection of the bulk ultrasonic beam. Ultrasonic waves are classified by the following modes of vibration: longitudinal,transverse, surface, and Lamb modes.5.2.3.1 Longitudinal Waves. Waves in which the particle motion of the material moves in essentially the same directionas the sound wave propagation, are called longitudinal waves (also referred to as “compressional waves” or “L-waves”) (Figure 5-3). Longitudinal waves can be generated within solids, liquids, and gases. Longitudinal waves are generated in apart under inspection when an incident longitudinal wave is near normal (90 ) to the surface of the part under inspection. Thelongitudinal wave velocity is determined by the material’s elastic modulus and density, and is a constant for each material.Longitudinal wave inspections are used extensively for thickness inspections, corrosion thinning, and for the detection ofother defects parallel to the inspection surface.5-3
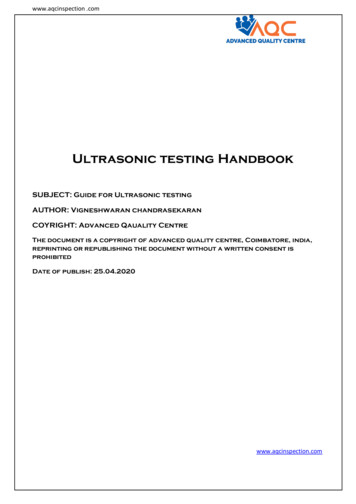
TO 33B-1-1NAVAIR 01-1A-16-1TM 1-1500-335-23Figure 5-3.Longitudinal and Transverse Wave Modes5.2.3.2 Transverse (Shear) Waves. Transverse (also known as “shear” or “s-wave”) waves denote the motion of wavesin which the particle motion is perpendicular to the direction of propagation (Figure 5-3). These inspections are also calledangle beam inspections. Shear waves travel at approximately 50-percent (half) of the velocity of longitudinal waves for thesame material. Transverse waves can exist in any elastic solid, but are not supported by liquids or gases. Shear waves aregenerated in a test piece when a longitudinal wave impinges on the surface at an angle within a range of angles other thannormal (90 ) to the surface. This range is from the first to the second critical angles. These will be discussed at length later inthis chapter. (The angle between the incident longitudinal wave and a line normal to the surface is referred to as the incidentangle.) Part of the sound is reflected, but over a wide range of incident angles, part of the sound enters the test piece wheremode conversion and refraction occur, resulting in a shear wave at an angle in the part. The portion converted to a shear wavewill vary with the incident angle. Shear wave inspections are used extensively for crack and other defect inspections wherethe defect is suspected to be located at other than parallel to the inspection surface.5.2.3.3 Surface (Rayleigh) Waves. Surface (Rayleigh) waves have a particle motion elliptical in a plane, parallel to thepropagation direction, and perpendicular to the surface. Surface waves are generated when an incident longitudinal wave(paragraph 5.2.4.2) impinges on the test piece at an incident angle just beyond the second critical angle for that material.Once generated, surface waves can travel along curves and complex contours. Surface waves travel at approximately 90percent of the velocity of shear waves for the same material. Surface waves are confined to a thin layer of the material underinspection, up to one wavelength deep, and can only be sustained when the medium on one side of the interface is a gas. Anangle beam transducer containing a steeply angled wedge is shown in Figure 5-4. The energy of surface waves decays rapidlybelow the surface of a test part as shown in Figure 5-5. Surface waves are most suitable for detecting surface flaws, but mayalso be used to detect discontinuities lying up to one-half wavelength below the surface.5-4
TO 33B-1-1NAVAIR 01-1A-16-1TM 1-1500-335-23Figure 5-4.Figure 5-5.Surface Wave ModeDistribution of Surface Wave Energy With Depth5.2.3.4 Lamb (Plate) Waves. Lamb (plate) waves propagate within thin plates, a few wavelengths thick. Wavepropagation is between the two parallel surfaces of the test piece, and can continue for long distances. Lamb waves aregenerated in a complex variety of modes. The propagation characteristics of Lamb waves are dependent on the properties andthickness of test material, as well as the test frequency. Two basic forms of Lamb waves exist symmetrical and asymmetrical.Although not widely used in production, Lamb waves are beneficial in large area inspection applications, such as corrosionand disbonds, because they can propagate for long distances.5-5
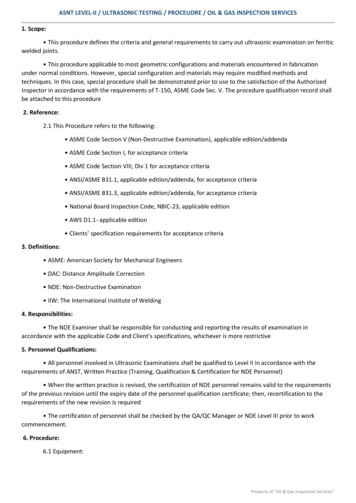
TO 33B-1-1NAVAIR 01-1A-16-1TM 1-1500-335-235.2.4 Refraction and Mode Conversion.5.2.4.1 Snell’s Law. When an incident longitudinal beam is normal to the test part surface (θ1 0 ), the longitudinalsound beam is transmitted straight into the test part and no refraction occurs. When the incident angle is other than normal;refraction, reflection, and mode conversion occur. Refraction is a change in propagation direction. Mode conversion is achange in the nature of the wave motion. A portion of the longitudinal incident beam is refracted into one or more wavemodes traveling at various angles in the test piece (Figure 5-6). Wave refraction at an interface is defined by Snell’s Law.The Snell’s Law formula is located in (paragraph 5.7.2).Figure 5-6.Sound Beam Refraction5.2.4.2 Refracted Beam Energy. The relative energy for longitudinal, shear, and surface wave beams in steel, fordifferent incident angles of longitudinal waves (paragraph 5.2.3.1) in plastic, is shown in Figure 5-7. The curves shown wereobtained using plastic wedges on steel. Similarly shaped curves MAY be obtained for other test materials (i.e., aluminum andtitanium). Similarly curves MAY also be generated for the immersion inspection (paragraph 5.4.2.1.1.2) in water. Refractionangles are greater in water than plastic.Figure 5-7.5-6Relative Amplitude in Steel of Longitudinal, Shear, and Surface Wave Modes With Changing PlasticWedge Angle
TO 33B-1-1NAVAIR 01-1A-16-1TM 1-1500-335-235.2.4.3 Multiple Refracted Beams. When an incident longitudinal beam is normal to the test part surface (θ1 0 ), thelongitudinal sound beam is transmitted straight into the test part and no refraction occurs. When the incident angle is otherthan normal, refraction and mode conversion occur. A portion of the longitudinal beam is refracted at some angle greater than0 and is mode converted into one or more wave modes traveling at various angles and intensities, depending on the incidentangle of the longitudinal beam. The angles of the refracted and mode converted beams are determined by Snell’s law(paragraph 5.7.2). The relative energy for longitudinal, shear, and surface wave beams in steel, for different incident angles oflongitudinal waves (paragraph 5.2.3.1) in plastic, is shown in Figure 5-7. The curves shown were obtained using plasticwedges on steel. Similarly shaped curves can be obtained for other test materials, such as aluminum and titanium. Similarlycurves can also be generated for the immersion inspection (paragraph 5.4.2.1.1.2) with the plastic replaced by water.Refraction angles are greater with water than plastic.5.2.4.3.1 Critical Angles. In angle beam inspection, it is important to know what types of waves and at what angles thewaves exist in the test material. Because shear waves (paragraph 5.2.3.2) and longitudinal waves (paragraph 5.2.3.1) travel atdifferent velocities in a given material, confusing signals can be generated and lead to false calls or missed indications.5.2.4.3.1.1 First Critical Angle. The incident angle that yields a 90 refracted longitudinal wave is defined as the firstcritical angle. At incident angles equal to or greater than the first critical angle, longitudinal waves no longer exist in thematerial. Beyond this angle, only shear waves remain in the test material.5.2.4.3.1.2 Second Critical Angle. The incident angle at which the refracted angle for shear waves reaches 90 is definedas the second critical angle. At incident angles equal to or greater than this, shear waves no longer exist in the material.Slightly beyond the second critical angle, surface waves (paragraph 5.2.3.3) are propagated along the surface of the material.5.2.4.3.1.3 Most angle beam inspections are performed with only a shear wave present in the test material, therefore mostincident angles useful for shear-wave inspection NDI fall between the two critical angles. The first critical angle in plastic forsteel (Figure 5-7) is approximately 30 ; the second critical angle is approximately 56 . For surface wave inspection theincident angle is purposely increased past the second critical angle to generate the desired surface wave.5.2.4.4 Determining the Angle of Incidence in Plastic to Generate 45-Degree Shear Waves in Aluminum. FieldNDI personnel are responsible for using the correct refracted beam angle for a particular application. The specific proceduredetails the correct refracted beam angle; however, it is important for the field NDI inspector to know how the correct anglewas obtained. Snell’s law is the tool for determining wedge angles for contact testing (paragraph 5.4.2.1.1.1), or the angle ofincidence in water for immersion testing (paragraph 5.4.2.1.1.2). An example showing how Snell’s law is used to determinethe angle of incidence in plastic needed to generate 45 shear waves in aluminum is shown in paragraph 5.7.3.5.2.5 Ultrasonic Inspection Variables. Ultrasonic inspection is affected by several variables. The ultrasonic inspectionsystem consists of the instrument, transducer, wedges or shoes, coupling medium, etc. A discussion of variables related to thetest part follows the paragraphs describing system variables. It is important the operator be familiar with and recognize theeffects of all these variables.5.2.5.1 Frequency. For flaw detection using the contact method (paragraph 5.4.2.1.1.1), frequencies between 2.25 MHzand 10 MHz are commonly used. The higher frequencies in this range provide greater sensitivity for detection of smalldiscontinuities, but do not have the penetrating power of the lower frequencies. The higher frequencies can also be moreaffected by small metallurgical discontinuities in the structure. Signals from these discontinuities can often interfere with thedetection of relevant discontinuities, such as small cracks. The size of the defect detected SHOULD be the primeconsideration when selecting the inspection frequency. Typically, defects must have at least one dimension equal to orgreater than 1/2 the wavelength in order to be detected. For example, straight beam (paragraph 5.3.2.3.1) inspection ofaluminum at 2.25 MHz with a wavelength of 0.111-inch, requires a defect be 0.066-inch or larger in order to be detected(e.g., at 5 MHz, the minimum defect size is 0.025-inch and at 10 MHz, it is 0.012-inch).5.2.5.2 Frequency Bandwidth. The above discussion on frequency pertains to the peak frequency used in an inspection.In all cases, the ultrasonic instrument and transducer produces a band of ultrasonic energy covering a range of frequencies.The range is expressed as bandwidth. Ultrasonic inspection procedures can be sensitive to frequency; therefore, theinspection results can be affected by variation in the bandwidth of the inspection system. For example, certain inspections useloss of back reflection as criteria for rejection. Frequencies too high can lead to diminished or complete loss of backreflection due to the sound being scattered by a rough inspection surface, large grain structure in the test material, or smallirrelevant discontinuities. In other words, improper choice of peak frequency and bandwidth of the inspection system canproduce irrelevant indications that affect inspection results. Both the instrument and the transducer affect the bandwidth of5-7
TO 33B-1-1NAVAIR 01-1A-16-1TM 1-1500-335-23the inspection. Therefore, it is best to have a reference standard of the same material manufactured with the samemanufacturing process and the same surface conditions as the test part, so the inspection results will be the same for differentinspection systems. Instruments are constructed to pulse the transducer, and measure the response in different ways withrespect to bandwidth.5.2.5.2.1 Some instruments use a spike pulser and a broadband amplifier. With these instruments, the bandwidth iscontrolled by the transducer. A given transducer has a maximum response at the natural resonant frequency of the transducerelement; however, the element will also respond at other frequencies. The transducer response to these other frequencies iscontrolled by its internal construction. Modern instruments are designed to be operated in either narrow band or broadbandmodes to accommodate a variety of transducers. A broad bandwidth means better resolution; and a narrow bandwidth meansgreater sensitivity. Ultrasonic systems are generally designed with respect to bandwidth to provide a reasonable compromisebetween resolution and sensitivity.5.2.6 Sound Beam Characteristics. The sound beam does not propagate uniformly through the volume defined by thestraight-sided projection of the transducer face. Side lobes exist along the outer edges of the beam near the transducer face,and sound intensity is not uniform throughout the beam.5.2.6.1 Dead Zone. During contact testing (paragraph 5.4.2.1.1.1), there is test specimen thickness beneath the transducerin which no useful ultrasonic inspection can take place. This region is defined as the dead zone. When a transducer is excited,it vibrates for a finite amount of time during which it cannot act as a receiver for a reflected echo. Reflected signals fromdefects located in the dead zone arrive back at the transducer while it is still transmitting. A dead zone is inherent in allultrasonic equipment. In some ultrasonic inspection equipment, the transmitted pulse length can be electronically shortened,effectively making the dead zone shallower, but it cannot be eliminated. The dead zone length can be estimatedexperimentally.5.2.6.2 Near Field. Extending from the face of the transducer is an area characterized by wide variations in sound beamintensity. These intensity variations are due to the interference effects of spherical wave fronts emanating from the peripheryof the transducer crystal. The region where this interference occurs is called the near field or Fresnel (pronounced Fray-nel)Zone (Figure 5-8). The equation for calculating the length of the near field is located in paragraph 5.7.5.The smaller the transducer element diameter or the lower the frequency, the shorter the near field will be. Due to inherentamplitude variations, inspection within the near field is not recommended without careful calibration on reference flawswithin the near field.Figure 5-8.5-8Schematic Presentation of Sound Beam
TO 33B-1-1NAVAIR 01-1A-16-1TM 1-1500-335-235.2.6.3 Far Field. At distances beyond the near field there are no interference effects. This region is called the far field(Fraunhofer Zone) (Figure 5-8). Most ultrasonic inspection procedures are designed to occur in the far field. The intensity ofthe sound beam in the far field falls off exponentially as the distance from the face of the transducer increases.5.2.6.4 Distance Versus Amplitude.NOTEThe important thing to remember is, wide variations in amplitude from discontinuities can occur when inspectingin the near field.It is always best to compare discontinuity signals with signals from reference standards, such as flat-bottom holes having thesame metal travel distance as the discontinuity. A typical curve showing the amplitude response versus distance from thetransducer face is shown in Figure 5-9.Figure 5-9.Amplitude Response Curve of Typical Transducer5.2.6.5 Beam Spread. In the near field, the sound beam essentially propagates straight out from the face of thetransducer. In the far field, the sound beam spreads outward and decreases in intensity with increasing distance from thetransducer face as shown in Figure 5-9. Beam spread is important to consider because in certain inspection applications thespreading sound beam may reflect off of walls or edges, causing erroneous or confusing signals on the A-scan presentation(Figure 5-10). The formula for calculating the half-angle of the beam spread is located in paragraph 5.7.6.5-9
TO 33B-1-1NAVAIR 01-1A-16-1TM 1-1500-335-23Figure 5-10.Example of Beam Spread Causing Confusing Signals5.2.6.5.1 In addition to the main sound beam pattern discussed above, there is also a small amount of side lobe energy(Figure 5-11). Some of the effects of this side lobe energy are discussed in paragraph 5.5.3.1. Another adverse affect of sidelobes, is a reduction in the efficiency of the transducer. Due to the interference created by the side lobes, the actual useablewidth of a sound beam near the face of the transducer is less than the actual width of the piezoelectric element (Figure 5-11).Figure 5-11.Main Sound Beam and Side Lobe Energy5.2.6.6 Beam Intensity. Beam intensity is the sound wave energy transmitted through a unit cross-sectional area of thebeam. The intensity is proportional to the square of the acoustic pressure exerted in the material by the sound wave. Theacoustic pressure is directly related to the amplitude of the material particle vibrations caused by the sound wave. Transducerelements sense the acoustic pressure of the reflected sound wave and convert it to an electrical voltage. Ultrasonic instrumentreceiver-amplifier circuits receive the input voltage from the transducer and produce an output voltage value proportional tothe intensity of the reflected sound. This output voltage is typically displayed on the instrument display as an A-scan signal.5-10
TO 33B-1-1NAVAIR 01-1A-16-1TM 1-1500-335-235.2.6.7 Attenuation. Attenuation is the loss in acoustic energy that occurs between any two points of travel. The amountof loss is measured in decibels, but direct measurement of material attenuation can be very difficult. Beam attenuation occursdue to many factors that include absorption, scattering, diffraction, beam spread, geometry of the part, or other materialcharacteristics.5-11
TO 33B-1-1NAVAIR 01-1A-16-1TM 1-1500-335-23SECTION III ULTRASONIC INSPECTION EQUIPMENT AND MATERIALS5.3INTRODUCTION.5.3.1 Ultrasonic Instruments.5.3.1.1 General Description. Ultrasonic equipment performs the functions of generating, receiving, and displayingpulses of electrical energy, which have been converted to and from pulses of ultrasonic energy by a transducer attached to aninstrument. All portable ultrasonic equipment consists of a power supply, a clock circuit, a pulser, a sweep circuit, atransducer, a receiver-amplifier circuit, and an instrument display. By properly adjusting an instrument an operator canmeasure the amplitude of displayed pulse signals and determine the time/distance relationships of the received signals.Detailed instructions for operation of individual models SHALL be obtained by consulting the operating and maintenancemanual for the specific instrument being used.5.3.1.2 Scanning Equipment. Many applications lend themselves to either automated, or semi-automated scanningtechniques. Most scanning applications are computer controlled and can result in A-scan, B-scan, or C-scan outputs.Scanning equipment ensures full coverage of the inspection zone and can be accomplished at resolutions unobtainable bymanual scanning. Scanning mechanisms come in many levels of sophistication. Two-axis scanners can be manuallymanipulated or computer-automated to any extent. Large gantry-based immersion or “squirter” systems have up to 16 ormore axes and offer full-contour scanning of complex shapes.5.3.1.3 Physical Characteristics of Instrument Controls. The physical nature of the instrument controls varies with thetype and age of the instrument. Older instruments have rotary knobs for fine adjustments, slide switches for coarseadjustments, and screwdriver rotary controls for infrequent adjustments, of waveform position and visibility. Newerinstruments have push buttons or a sealed membrane keypad, both to select the desired control from a displayed menu and tomake the respective adjustments. Alternatively, some menu driven instruments have a single rotary (“smart”) knob formaking adjustments after a control has been selected from the menu.5.3.1.4 Waveform Display Controls. An ultrasonic instrument may have one of several types of waveform displays;traditional cathode ray tube (CRT), liquid crystal display (LCD), or electroluminescent display (EL). Controls affecting thewaveform display are discussed below.5.3.1.4.1 Scale Illumination.CAUTIONIf the intensity of a CRT is allowed to remain at a high level for long periods, it is possible to permanently burnthe display.The horizontal and vertical scales are illuminated in various ways. On some instruments, the scales are scribed on thefaceplate and cannot be illuminated. On a CRT, the brightness control for the scales may be integrated with a rotary powerswitch or a separate control. Other types of display may simply have an on/off switch for illumination control.5.3.1.4.2 Waveform Positioning Controls. The events in an ultrasonic inspection are related to time referenced to thepulses produced by the instrument. Pulses or signals will be represented along a horizontal line (typically called the sweep orbaseline) at the bottom of the screen. Time starts at the left end of the sweep and progresses to the right. The sweep, includedwithin the “frame” Figure 5-12), is a visual presentation of a portion of the time base. The following typical controls are usedto properly align the baseline on the display screen. These two adjustments are generally not required on digital display flawdetectors.5-12
TO 33B-1-1NAVAIR 01-1A-16-1TM 1-1500-335-23Figure 5-12.Time Base5.3.1.4.2.1 Horizontal Position. The horizontal position control should be adjusted so that the horizontal baseline (sweep)begins at the left edge of the display.5.3.1.4.2.2 Vertical Position. The vertical position control should be adjusted so the horizontal time base is at zero positionof the vertical scale.5.3.1.4.3 Type of Waveforms.5.3.1.4.3.1 Radio-Frequency (RF) Display, (Non-rectified). This type of waveform has the baseline at 50-percent of fullscreen height and shows the full waveform with both the positive and negative peaks. This type of waveform contains all ofthe signal information and is often used during procedure development to decide which waveform display is best suited for aparticular inspection.5.3.1.4.3.2 Full-Wave (FW) (Rectified Video Display). This type of waveform shows the positive peaks and the negativepeaks, but the negative peaks are reversed and made positive.5.3.1.4.3.3 Positive Half-Wave (HW or HWP) (Rectified Video Display).This type shows only the positive peaks.5.3.1.4.3.4 Negative Half-Wave (HW- or HWN) (Rectified Video Display).This type shows only the negative peaks.5.3.1.4.4 Video Filtering. Some instruments provide varying degrees of filtering of the rectified waveforms. Filteringsmooths out the waveform, but some loss of information occurs. With minimum filtering, the presentation has greaterresolution and signal definition. Video filtering MAY affect the vertical linearity of the instrument.5.3.1.4.5 Sweep Delay. The sweep delay control determines what part of the time base is viewed on the display. An areacircled to frame the portion of the time base that an inspector wants to view is shown (Figure 5-13) on the instrument display.Adjustments to the sweep delay move the frame to the desired portion of the time base, that is, sweep delay delays the start ofthe sweep with respect to the start of the time base.5-13
TO 33B-1-1NAVAIR 01-1A-16-1TM 1-1500-335-23Figure 5-13.Relationship of CRT Sweep to Time Base5.3.1.4.5.1 To see how the sweep delay works, consider the inspection shown in Figure 5-14. Under certain control settings(e.g., immersion testing) (paragraph 5.4.2.1.1.2), an instrument with a CRT might have a sweep appear as in Figure 5-15showing only the front surface and discontinuity signals. By adjusting the sweep delay to move the “frame” to the rightalong the time base, the display shown in Figure 5-16 is obtained.NOTEThe front surface signal now appears on the far left, and the back surface signal can now be viewed also. Thedistance between the front surface and the discontinuity signals has not changed from Figure 5-15.Figure 5-14.5-14Ultrasonic Contact Inspection
TO 33B-1-1NAVAIR 01-1A-16-1TM 1-1500-335-23Figure 5-15.Display Screen Before Adjusting Sweep Delay5.3.1.4.6 Sweep Length/Range. The sweep length (range) control determines how much time/distance is represented bythe sweep on the display. If the range is adjusted to decrease the time/distance represented, the spacing between the signalswill increase. The range
5.1.3 Ultrasonic Testing.Ultrasonics uses (ultra) sound to detect internal and external discontinuities ranging from cracks to disbonds. Ultrasound can be used on almost any material to locate discontinuities from large disbonds, down to the smallest defects. It can also be used to measure the overall thickness of a material, and the specific .