Transcription
Chapter 1. Introduction to the Columbia PlateauEcoregion AnalysisLead author: Leslie Robb (Independent Researcher)Contributing authors: Sonia A. Hall (TNC), Karl Halupka (USFWS), Kelly McAllister (WSDOT),Brad McRae (TNC), Michael A. Schroeder (WDFW), Joanne Schuett-Hames (WDFW)Human beings live in an increasingly connected world. In the early 1800s, it took Lewis andClark the better part of three years to travel overland from the Atlantic to the Pacific and back.Today, the same trip takes less than a day. Yet the same infrastructure that now connects andprovides resources for an increasing number of people often disconnects the natural world. Ourability to move hinders the connectivity and success of wildlife. Highways, transmission lines,and cityscapes add to the movement barriers already posed by natural features. Unconnected,wildlife are relegated to smaller and smaller islands of suitable habitat with each islandincreasingly separated from the next occupied island. This fragmentation and lack of connectedhabitat isolates wildlife populations, increases mortality, lowers genetic heterogeneity, and,ultimately, increases rates of species extirpation and extinction. A well-connected landscape forwildlife is key to supporting more resilient wildlife populations as they face future changes inland use practices, human population growth, and potential effects of a changing climate.The Washington Wildlife Habitat Connectivity Working Group (WHCWG) was formed with themission to identify “opportunities and priorities to conserve and restore habitat connectivity” forour region’s wildlife. To address issues of wildlife habitat connectivity within Washington andadjacent lands, the WHCWG adapted a three-tiered approach focused at statewide, ecoregional,and local scales (Fig. 1.1). The first tier, a broad-scale assessment, was addressed by theWashington Connected Landscapes Project: Statewide Analysis (WHCWG 2010). The statewideanalysis revealed the Columbia Plateau as an ecoregion where natural vegetation communitieswere severely fragmented, limiting movement potential for wildlife.The analysis of habitat connectivity across the Columbia Plateau Ecoregion presented in thisreport is a second-tier assessment conducted at a finer resolution than the statewide analysis. Itbridges broad, statewide connectivity patterns to local and project-level conservation efforts andhelps identify where these efforts are warranted. In this ecoregional analysis we describe thecurrent patterns of wildlife habitat connectivity in the Columbia Plateau Ecoregion. We alsoidentify areas important for maintaining these patterns and highlight opportunities formaintaining and enhancing connectivity in this region into the future—furnishing a vision for aconnected Columbia Plateau. We foresee this analysis serving as a template for future analysesof other ecoregions, and providing a foundation for assessment and management efforts forwildlife connectivity at the third tier, the local level.1.1. The Columbia Plateau EcoregionOur project area for connectivity analysis includes the Columbia Plateau Ecoregion and thoselands within a 25 km buffer around the ecoregion boundary. Because of modeling and dataconstraints, we do not include in our analysis that portion of the Columbia Plateau extending intoBritish Columbia, Canada. Although we model habitat concentration areas (important habitatWashington Connected Landscapes Project: Analysis of the Columbia Plateau Ecoregion1
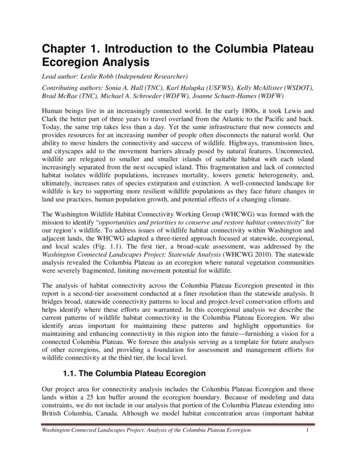
areas for wildlife) and linkages (pathways between these areas) in parts of northern Oregon andwestern Idaho, here we focus our assessment and interpretation of connectivity on that portion ofthe Columbia Plateau Ecoregion and buffer within the state of Washington (Fig. 1.2).Statewide ScaleEcoregion ScaleLocal ScaleCoarse Emphasizes wide-ranging wildlife speciesand broad patterns of ecological integrity Identifies areas important for statewideconnectivity Informs finer-scale analysesFine Emphasizes wildlife species with smallergeographic ranges Focuses on particular habitat types Increases resolution of HCAs and linkagepatterns Identifies areas important for ecoregionalconnectivity Identifies areas where local-scaleanalyses are warranted Emphasizes wildlife species with smallranges or local significance Can be accomplished by localorganizations Provides sufficient detail for project-scaleactionFigure 1.1. Scales of wildlife habitat connectivity analyses in Washington.The Columbia Plateau is the largest ecoregion in Washington and occupies nearly one-third ofthe state. It is dominated by the Columbia River and its tributaries and bordered by the CascadeRange and the Rocky and Blue mountains. A complex geologic history of volcanic activity,glaciation, and glacial floods has created a landscape of glacial deposits, coulees, channeledscablands, and rolling areas of deep soil. The semi-arid climate of the Columbia Plateau supportsnative shrubsteppe vegetation as well as other drought-tolerant plant communities. The impact ofhuman activity is high here: more than half of the shrubsteppe has been converted to agriculture,primarily dryland wheat—but also irrigated crops—while other areas have been altered bydevelopment and infrastructure. The remaining native habitat is often fragmented and on shallowsoils less amenable to agriculture. Hydroelectric energy production is important to the area’seconomy, and in recent years wind energy production has become more common, especially insouthern portions of the ecoregion. The imprint of development and agriculture is reflected in thesubstantial number of Washington’s Species of Greatest Conservation Need found here. Whilethis landscape may still provide connectivity for many species of wildlife, future changes in landuse practices, human population growth, and potential effects of a changing climate underscorethe need for a better-connected landscape—one that allows for continued and future movementof wildlife throughout the Columbia Plateau.Washington Connected Landscapes Project: Analysis of the Columbia Plateau Ecoregion2
Figure 1.2. The Columbia Plateau Ecoregion showing common geographic features and place names.Washington Connected Landscapes Project: Analysis of the Columbia Plateau Ecoregion3
1.2. GoalOur goal for this connectivity analysis of the Columbia Plateau Ecoregion is to identify the mostimportant areas for maintaining and enhancing wildlife habitat connectivity across the ecoregion.We anticipate that this analysis will provide a strong foundation for prioritizing conservationefforts, guiding development of detailed linkage design at the local scale, and encouraging futurevalidation of connectivity models.1.3. Analysis ApproachThis ecoregional analysis follows the organizational structure, methodology, and approachoutlined in the Washington Connected Landscapes Project: Statewide Analysis (2010). We urgereaders who are unfamiliar with our methods, or who need to refresh their understanding is(availablefromhttp://www.waconnected.org). As suggested above, the statewide analysis provides context andtechnical details that will enhance your ability to interpret and apply the products, such as maps,produced through this analysis and described in this document.As in the statewide analysis, the ecoregional analysis applies focal species and landscapeintegrity approaches to model patterns of habitat connectivity. The focal species approach isclosely related to functional connectivity for particular species; its strength lies in theconsideration given to the ways that each species contributes to our understanding ofconnectivity. The challenge for this approach lies in integrating results across focal species. Also,modeling is labor intensive, and connectivity patterns may not adequately represent needs ofsome non-focal species. The landscape integrity approach seeks to identify the best availableroutes to maintain movement for wildlife and ecological processes across the landscape bymodeling connectivity across large, contiguous areas that retain high levels of naturalness(limited human impact). However, its results do not assess specific ecological functions, can bedifficult to validate, and are more challenging to communicate. By taking a two-pronged strategyto model connectivity we gain the advantages associated with both approaches while addressingshortcomings associated with using each approach alone.Many of the data layers mapped in the statewide analysis were updated and used in thisecoregional analysis (See Chapter 2 and Appendix D). In addition, we compiled and mappeddata layers that were not available or not feasible to include in the statewide analysis such assoils, topographic complexity measures, railroads, transmission lines, wind turbines, andirrigation canals.1.3.1. Focal Species ModelingWe selected 11 species to represent the connectivity needs of a broader assemblage of wildlife,as well as the major vegetation classes, and threats to wildlife connectivity and persistence in theColumbia Plateau Ecoregion (See Appendix E). During the selection process we consideredspecies’ sensitivity to landscape features such as development, agriculture, and roads, as well asto energy development, fire impacts, and climate change. We chose species with differentmovement capabilities, such as mule deer (Odocoileus hemionus) and Washington groundWashington Connected Landscapes Project: Analysis of the Columbia Plateau Ecoregion4
squirrel (Urocitellus washingtoni), as well as those with diverse habitat needs, like tigersalamander (Ambystoma tigrinum) and Greater Sage-Grouse (Centrocercus urophasianus). Fiveof the focal species we selected for connectivity modeling at the ecoregional scale were alsoincluded in the statewide analysis: mule deer, Greater Sage-Grouse, Sharp-tailed Grouse(Tympanuchus phasianellus), white-tailed jackrabbit (Lepus townsendii), and black-tailedjackrabbit (L. californicus). Inclusion of these five species in the connectivity modeling for theColumbia Plateau allowed us to examine how closely complementary the coarse-scale statewideanalysis and the finer-scale ecoregional analysis might be.For each focal species, we prepared a detailed account (See Appendix A) of the connectivitymodeling analysis. These accounts discuss the biology and ecology of the focal species in thecontext of their movement and connectivity across the landscape and provide the rationale forspecific modeling decisions. The accounts also include connectivity modeling results and maps,accompanied by interpretation and insights drawn from the connectivity patterns. Modelingproducts—connectivity maps—for the focal species include: (1) landscape resistance tomovement, (2) habitat value—relative habitat suitability of the landscape, (3) habitatconcentration areas (HCAs)—important habitat areas to connect, (4) cost-weighted distance(CWD)—cumulative cost of resistance as species move outward from HCAs, and (5) modeledlinkages—movement pathways between HCAs. We provide linkage statistics, such as linkagelength and quality metrics (See Appendix B) for users to evaluate the linkage quality and degreeof connectivity between specific HCA pairs.1.3.2. Landscape Integrity ModelingLandscape integrity can provide a measure of the relative degree of human disturbance on thelandscape. We followed the landscape integrity approach outlined in the statewide analysis(WHCWG 2010), modified to include additional data layers. We produced alternative landscapeintegrity resistance models to reflect different sensitivities to human modifications, such asroads. Landscape integrity modeling products include maps of (1) landscape resistance foralternative models, (2) landscape integrity core areas, and (3) linkages among core areas foralternative resistance models.1.3.3. Linkage NetworksThe focal species and landscape integrity approaches identify habitat concentration areas andcore habitats, respectively, and areas of the landscape important for connecting them. A linkagenetwork consists of the combination of all the habitat concentration areas and the linkagesmodeled for focal species, or core areas and modeled linkages for landscape integrity (WHCWG2010; see also Glossary). We have organized the species and landscape integrity networks intothree composite networks:1) Upland Network—Species most closely associated with upland shrubsteppe habitat (theseare Sharp-tailed Grouse; Greater Sage-Grouse; Townsend’s ground squirrel, Urocitellustownsendii; Washington ground squirrel; black-tailed jackrabbit; white-tailed jackrabbit;and least chipmunk, Neotamias minimus).2) Drainage/Aquatic and Canyon Network—Species closely associated with aquatic,riparian, cliff, canyon, and talus habitats (beaver, Castor canadensis; tiger salamander;and Western rattlesnake, Crotalus oreganus).Washington Connected Landscapes Project: Analysis of the Columbia Plateau Ecoregion5
3) Generalist/Landscape Integrity Network—Species that have broad coverage across theColumbia Plateau and the buffer (mule deer) and the landscape integrity network.1.4. InterpretationBy modeling habitats and linkages important for an array of wildlife species, we have created avision for a connected landscape across the Columbia Plateau. These ecoregional level results,following up on a connectivity analysis that began at the statewide scale (WHCWG 2010; seeFig. 1.1), are intended to help prioritize connectivity conservation both ecoregionally and locally.The Columbia Plateau connectivity results, based on spatially explicit connectivity data, lendthemselves to multiple uses, including essential decision making for conservation-based wildlifeplanning.It is important for users to understand the strengths and limitations of this ecoregional analysis sothat the results can be interpreted correctly and used effectively. We identify some of thestrengths and weaknesses here and encourage the reader to refer to the statewide report(WHCWG 2010) for a more in-depth discussion. The analysis: (1) creates a vision of aconnected landscape by modeling habitats and linkages for an array of wildlife species andlandscape integrity, (2) provides information to help organizations incorporate connectivity intoconservation efforts while meeting organizational goals and priorities, (3) delivers the foundationfor linkage design analyses that can guide actions to enhance connectivity, and (4) affordsopportunities for validation of model assumptions and predictions. There are limitations to theanalysis which may include: (1) errors and limitations in spatial data, (2) reduced applicabilityoutside the Columbia Plateau project area, (3) incomplete assessment of important habitats orlinkages, (4) insufficient detail to prioritize habitats or linkages at a finer scale, and (5) lack ofadequate field data to validate all model assumptions. Despite these limitations, this analysis is apowerful tool that provides a solid foundation for interpretation of connected landscapes as wellas opportunities for future work.1.5. ApplicationThis analysis is a landscape modeling effort that reflects our best estimate of modeled pathwaysfor potential movement in the Columbia Plateau Ecoregion. We provide a great deal ofinformation in this analysis and rely on readers to select from this array the information that ismost pertinent to their specific interests and applications. We encourage users to delve into thefocal species and landscape integrity resistance models most relevant to their questions andobjectives. Likewise, the landscape integrity resistance models and connectivity products foreach focal species each provide singular information about movement opportunities available inthe Columbia Plateau Ecoregion. There are a great many ways to use these species and analysisproducts to address a wide variety of potential applications. Our composite network analysis isone way of integrating different types of information. Other approaches to integration arepossible, and we hope readers will develop and share new ideas about how to synthesize theinformation we provide to promote practical connectivity conservation.Washington Connected Landscapes Project: Analysis of the Columbia Plateau Ecoregion6
1.6. Document OrganizationOur analysis results may be viewed from different perspectives, from broad patterns ofconnectivity across the entire ecoregion (See Chapters 3 and 4) to species-specific linkagesbetween individual HCAs (See Appendices A and B). This complexity and breadth provides awealth of opportunities for application to multiple uses, but presents challenges for fulldiscussion and consideration within a single document. Thus, we have synthesized our focalspecies and landscape integrity results to highlight important patterns of connectivity across theecoregion. This approach is intended to help prioritize areas important for the conservation ofconnectivity in the Columbia Plateau, and give direction for validation and more detailed linkagedesign. We provide examples of these patterns to illustrate ways in which users can apply ourresults to inform their own decision making. Our examples are not intended to be all-inclusiveand users should explore other considerations. We stress the importance of the document’sAppendices as they provide additional detail and insight to our analysis.We have organized the Columbia Plateau Ecoregion analysis into five chapters, followed by aglossary of terms and five Appendices. In Chapter 2 we provide a detailed account of themethods used including: analysis area, focal species selection, data development, habitatmodeling, resistance modeling, habitat concentration areas, and linkage modeling for focalspecies and for landscape integrity. In Chapter 3 we present the results of our analysis and inChapter 4, an assessment of the key patterns and insights. We pose the larger patterns oflandscape connectivity across the landscape that are illustrated by the focal species andlandscape integrity modeling, and consider the recurrent patterns of connectivity in the ColumbiaPlateau. We provide examples of opportunities for conserving connectivity in the ecoregion.Chapter 5 outlines future work and tenders conclusions and next steps.The Appendices provide supporting information and substantiate in greater detail the aspects ofthis analysis. Appendix A is partitioned into individual connectivity modeling accounts,providing natural histories, modeling overviews, connectivity mapping products, andinterpretations for each of the focal species. In Appendix B we provide modeling statistics, suchas habitat concentration and core area values, and linkage length and quality. Appendix C is afile of focal species and landscape integrity resistance and habitat values, and other parametervalues used during the model runs.Washington Connected Landscapes Project: Analysis of the Columbia Plateau Ecoregion7
Scales of wildlife habitat connectivity analyses in Washington. The Columbia Plateau is the largest ecoregion in Washington and occupies nearly one-third of the state. It is dominated by the Columbia River and its tributaries and bordered by the Cascade Range and the Rocky and Blue mountains. A complex geologic history of volcanic activity,


