Transcription
ASA ResearchUsing Excelto Detect FraudJ. Carlton Collins, CPAASA Research - Atlanta, Georgia770.842.5902Carlton@ASAResearch.com
Using Excel to Detect FraudTable of Contents1. Random Numbers – Attendees will learn how to generate random numbers to be used forstatistical sampling purposes. . 52. Consolidating Data – Attendees will learn how to consolidate data (such as budgets, financialreports, departmental reports, inventory lists, salesperson reports, location reports, etc.)using four different techniques as follows: Formulas, spearing formulas, consolidation tools,pivot tools. . 93. Benford’s Law – Benford’s Law predicts the occurrence of digits in large sets of data and thesepredictions might help red-flag potential irregularities. . 234. Using Regression to Create & Using Budgets to Detect and Prevent Fraud – An accuratebudget should be the CPAs’ first line of defense for detecting and preventing fraud. Attendeeswill learn how to quickly create a budget using regression analysis applied to historical data.You will also learn how to scrutinize each line item using a variety of techniques includingPearson, R-Square, Skew and Kurtosis functions to determine if a suitable basis for regressionanalysis exists, and if not, alternative methods will be used to budget that particular line item.That budget will then be seasonalized and rounded. From there, a balance sheet budget andcash flow forecast will be prepared based on the seasonalized budget, and the importance ofusing a seasonalized budget to detect and prevent fraud will be discussed. . 295. Profit Margin Monitoring – Profit margins that miss their target speak volumes. Attendeeswill learn how to budget for profit margins by asking two simple questions and workingbackwards using prior year data to target specific profit margins. Once established, theseprofit margins can also be used as benchmarks to help detect fraud or errors. . 496. Proof of Cash - Many auditors use a four-column bank reconciliation, also known as a Proofof Cash, to help shed light on error, misstatements, and fraud. 547. Excel Data Cleaning – Attendees will learn how to clean data so that Excel’s tools can beapplied to analyze the data. For example, a general ledger will be exported to Excel and thesteps necessary to prepare the data for analysis will be explained. Attendees will learn howto parse data using functions as well as the Text to Columns tool, and will learn when thefunctions work better method for parsing data. . 588. Data Cleaning Case Study - Preparing QuickBooks Data - When it comes to pivotingQuickBooks data in Excel, you must first do a little bit of cleanup work before pivoting processcan begin. . 75www.CarltonCollins.comPage 2Copyright April 2013
Using Excel to Detect Fraud9. Looking for Fraud – This section coves 28 common things to look for when examining forfraud, and suggests various Excel tools that might help the fraud examiner conduct theseexaminations. . 8010. Data Analysis Tools – Attendees will practice using data analysis tools to slice and dice data,filter data, group data, subtotal data, and pivot data. These topics focus on the mostimportant aspect of Excel – the data tools – which can be specifically used to analyze dataand detect anomalies. . 8511. Querying – Attendees will learn how to pull data directly from an accounting system, fromwithin Excel, for quick and easy data analysis. . 11112. Sparklines - Sparklines are new tools in Excel that can be used to visually analyze largevolumes of data, and attendees will learn how to utilize this tool to save time and providebetter data visualizations. . 11713. Conditional Formatting – Attendees will practice with Excel’s conditional formatting toolswhich allows the user to create rules for highlighting data with different colors to help visuallyanalyze the data. . 11714. Excel Functions – Attendees will also learn about a variety of tips and tricks such as Aggregatefunction which can be a useful tool in analyzing data, and will receive a list of the top 171functions the course instructor thinks apply to CPAs. . 12115. Ratio Reporting – Attendees will receive sample workbooks and templates containing samplefunctions and ratio calculations. . Visit www.CarltonCollins.com, click the Fraud tab16. Instructor Biography . 144www.CarltonCollins.comPage 3Copyright April 2013
Using Excel to Detect FraudUsing Excel to Detect FraudCPE Course InformationLearning ObjectivesCourse LevelPre-RequisitesAdvanced PreparationPresentation MethodRecommended CPE CreditHandoutsInstructorsTo increase the productivity of accountants and CPAsusing Excel’s commands and functions related topossibly detecting fraudIntermediateFamiliarity with Microsoft ExcelNoneLive lecture using full color projection systems and liveInternet access with follow up course materials8 hoursTemplates, checklists, web examples, manualJ. Carlton Collins, CPAAdvisorCPE is registered with the National Association of State Boards ofAccountancy (NASBA) as a sponsor of continuing professional education onthe National Registry of CPE Sponsors. State boards of accountancy havefinal authority on the acceptance of individual courses for CPE credit.Complaints regarding registered sponsors may be addressed to the nationalRegistry of CPE Sponsors, 150 Fourth Avenue, Nashville, TN, 37219-2417.Telephone: 615-880-4200.Copyright April 2013, ASA Research and Accounting Software Advisor, LLC4480 Missendell Lane, Norcross, Georgia 30092 770.842.5904All rights reserved. No part of this publication may be reproduced or transmitted in any form without the expresswritten consent of ASA Research, subsidiaries of Accounting Software Advisor, LLC. Request may be e-mailed tomarylou@asaresearch.com or further information can be obtained by calling 770.842.5904 or by accessing theASAResearch home page at: http://www.ASAResearch.com/All trade names and trademarks used in these materials are the property of their respective manufacturers and/orowners. The use of trade names and trademarks used in these materials are not intended to convey endorsementof any other affiliations with these materials. Any abbreviations used herein are solely for the reader’s convenienceand are not intended to compromise any trademarks. Some of the features discussed within this manual apply onlyto certain versions of Excel, and from time to time, Microsoft might remove some functionality. Microsoft Excel isknown to contain numerous software bugs which may prevent the successful use of some features in some cases.Accounting Software Advisor makes no representations or warranty with respect to the contents of these materialsand disclaims any implied warranties of merchantability of fitness for any particular use. The contents of thesematerials are subject to change without notice.Contact Information for J. Carlton ltonCollinswww.CarltonCollins.comPage 4Copyright April 2013
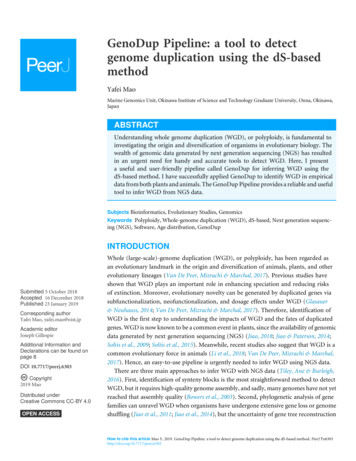
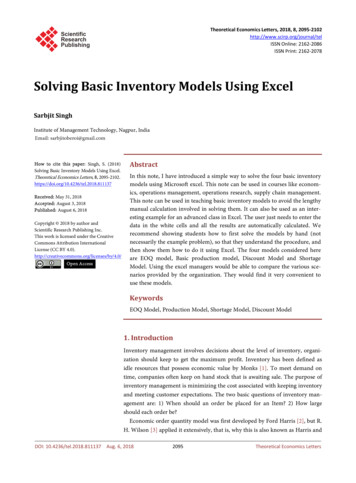
Using Excel to Detect FraudRandom NumbersExcel provides two tools for generating random numbers as follows:1. RAND2. RANDBETWEEN (You must first activate the Analysis ToolPak)RAND - The RAND function in Microsoft Excel allows you to generate random numbers in Excel.Specifically, type RAND() in a given cell to produce a random number between 0 and 1, as shown.Comments1. RAND is a volatile function, which means it will be recalculated any time the enter key ispressed, so the random number constantly changes. To prevent random numbers fromchanging, most people copy and paste them as values.2. Excel’s RAND function can be used to generate random numbers from the Uniformdistribution, however, be aware that prior to Excel 2003, this function should not be usedwith large simulation models because the older versions of Excel use the generationalgorithm which has a relatively small period (less than 1 million numbers), so if yourmodel contains hundreds of variables and you are running the simulation tens ofthousands of times, you can run out of random numbers. This problem has been fixed inExcel 2003 and later versions.3. Note that there is a known bug in Excel 2003 causing the RAND function to return negativenumbers, which can be negated using the ABS (absolute function).www.CarltonCollins.comPage 5Copyright April 2013
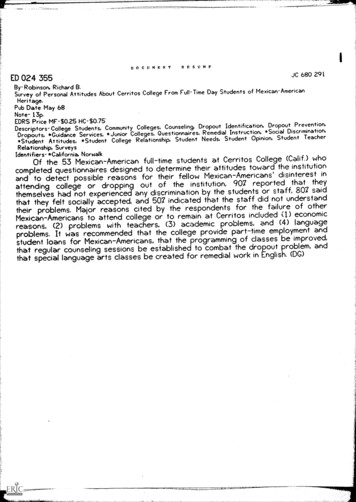
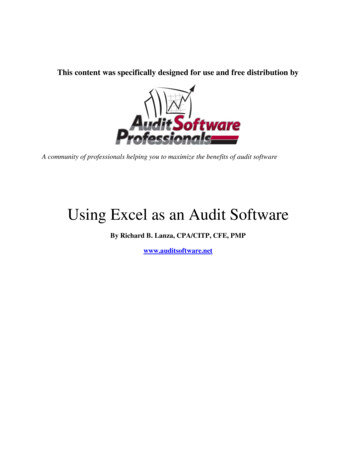
Using Excel to Detect FraudRANDBETWEEN - In Excel 2010, 2007 and 2003, you must first activate Analysis Tool Pack add-inas follows. In Excel 2010 and 2007, select File, Options, Add-ins, GO and place a check in thecheck box labeled Data Analysis ToolPak, then click OK. In Excel 2003, select Tools, Add ins, The RANDBETWEEN returns a random integer between two specified numbers, as shown.Suppose you wanted to select 100 random numbers from three different ranges of thepopulation. There are several approaches you might take. The first approach might be simply tolist all possible values, then use RAND to create a random number adjacent to those values, andthen sort. The screen shots below show the data before and after sorting. Once sorted, simplytake the desired number of samples from the top of the randomly sorted list, as suggested by thetop 7 values shaded in the second screen shot.www.CarltonCollins.comPage 6Copyright April 2013
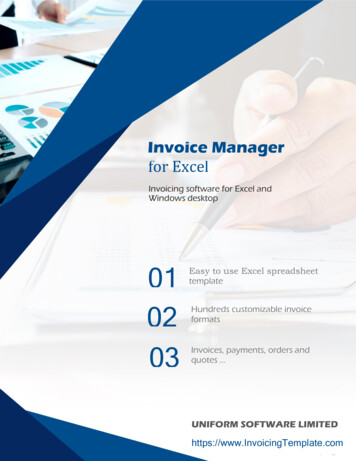
Using Excel to Detect FraudThis method takes up a lot of Excel screen real estate, but so what? Excel has millions of rowsand the generation of such a report is fairly straight forward and fast. Just use the FILL commandto fill in the necessary ranges, then add RAND and sort – it might take you 2 to 3 minutes.Random Numbers Given Three Ranges of Population DataAnother way to generate random numbers is to use RANDBETWEEN, and assigning theprobability that a random number is selected from a given range based upon the percentage thatrange represents compared to the total population. For example, consider the followingexample:www.CarltonCollins.comPage 7Copyright April 2013
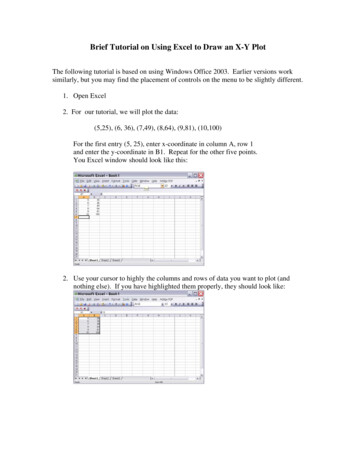
Using Excel to Detect FraudCells C4 through E5 contain the low and high values for three separate ranges of data making upthe total population. We start by calculating the number of occurrences in each range (1,111,1,277 and 55 in this example), and then calculate the percentage each range represents for thetotal population (45%, 52% and 2% in this example).Thereafter, a series of RANDBETWEEN functions are used to produce random number triggersbetween 1% and 100% (contained in cells I3 through I22 in this example), and then an IF functionis used to calculate within which range each random number trigger falls. For example, the firstrandom number trigger is 49% (in cell I3), which falls within the second range data. TheRANDBETWEEN function in cell J3 thusly calculates a random number using the second range ofdata’s low and high values (6,500 and 7,777 in this example), and the first random numbergenerated is 7,731 in this example.This method could theoretically be used to calculate random numbers for many separate rangesof data, with each member of the population having an equal chance to be selected.Download this workbook at lins.comPage 8Copyright April 2013
Using Excel to Detect FraudConsolidating Data in ExcelConsolidating data is a common task for CPAs, and Excel offers a variety of methods forperforming this task. The particular method you use will probably depend on the layout of yourdata, and you may need to clean, edit or manipulate your data a bit to prepare it forconsolidation. CPAs often have a need to consolidate data such as budgets, months,departments, locations, warehouses and sale representatives.Following I will explain four different consolidation methods - two methods for consolidating datawith similar layouts, and two more methods for consolidating data with dis-similar layouts. Thesefour methods are as follows:A.B.C.D.Simple formulas.Spearing formulas.The “Data Consolidate Command”.The “PivotTable Wizard”.A. Using Simple Formulas To Consolidate Similar DataThe workbook below contains budgets with identical layouts for Departments A, B, C and D.The goal is to consolidate these four budgets into a single consolidated budget.www.CarltonCollins.comPage 9Copyright April 2013
Using Excel to Detect Fraud1. Insert a New Worksheet on which the consolidation will appeari. Don’t click the New Sheet or Add Sheet Option - Because there is a betterand quicker approach.ii. CTRL Drag Tab – To insert a new worksheet, select worksheet labeled“Dept D”; then use the CTRL Drag Tab keystroke combination to create aduplicate worksheet of Dept D. The advantage is that the data, columnwidths, page footers and headers, and margin settings are all duplicatedautomatically, so you don’t have to create a new page from scr
Proof of Cash - Many auditors use a four-column bank reconciliation, also known as a Proof of Cash, to help shed light on error, misstatements, and fraud. 54 7. Excel Data Cleaning – Attendees will learn how to clean data so that Excel’s tools can be applied to analyze the data. For example, a general ledger will be exported to Excel and the